

text stringclasses 9
values |
|---|
# Dataset-generation pipeline dependencies (data extraction → sequences). |
# Model-training deps (torch, etc.) are intentionally excluded — this repo is scripts-only. |
earthengine-api |
geemap |
pandas |
pyarrow |
numpy |
scikit-learn |
dask[dataframe] |
🔥 Wildfire Multi-Source Spatiotemporal Dataset — Generation Pipeline
A standardized, scalable, region-configurable pipeline that turns open Google Earth Engine satellite + weather data into model-ready wildfire detection and prediction datasets.
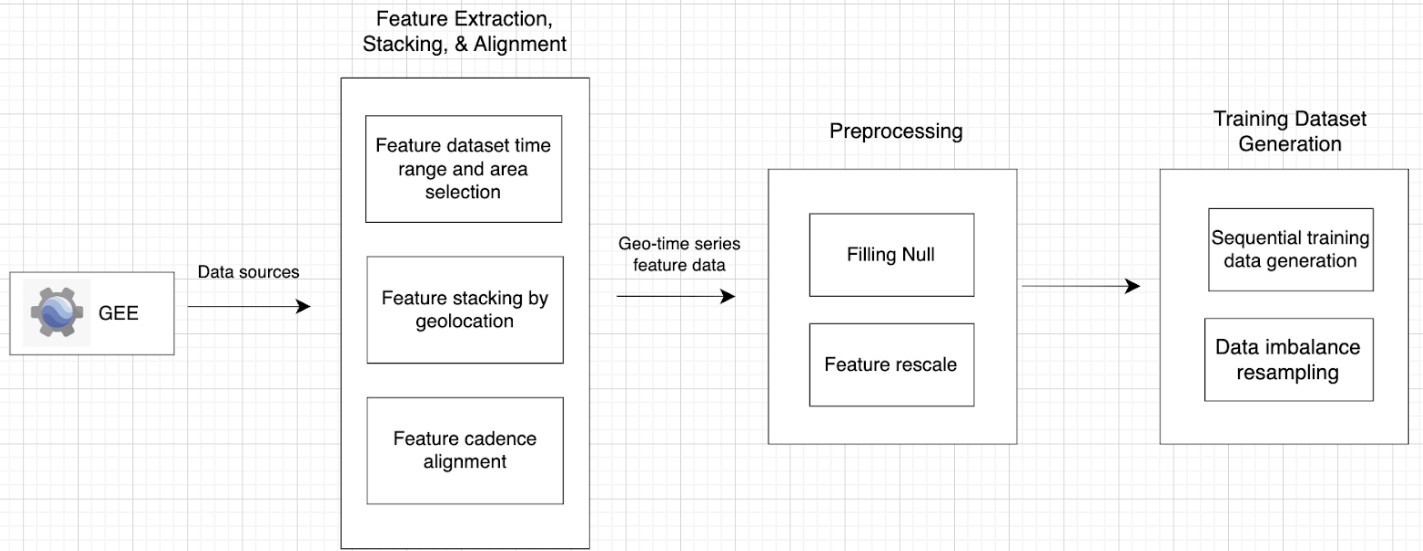
This repository ships the data-generation scripts (Colab/Jupyter notebooks), not a pre-baked download. That is deliberate: instead of one frozen dataset for one region, you get a recipe you can point at any area and time range you care about — and regenerate as new satellite data arrives.
🔗 Project website & full write-up: https://wildfire-project.vercel.app · Pipeline tutorial 💻 Code (GitHub): https://github.com/JasmineW6214/wildfire
Why I built this
In the town where I live, wildfires are tragedies we mostly see on the news — until the smoke from other provinces reaches us. I wanted to understand why wildfire seasons are worsening and what could actually be done about it, so I started this research.
The dataset was the bottleneck. When I began, there was no systematic, complete, model-ready dataset for wildfire ML research — nothing that fused the satellite, weather, vegetation, and fire-record sources you actually need, aligned in space and time, ready to train on. The single biggest thing standing between me and a working model wasn't the architecture; it was data that didn't exist yet in usable form. Satellite temperature, weather reanalysis, vegetation, elevation, land cover, and fire records all live at different resolutions and cadences, and stitching them into one clean table is where the weeks go.
So I built this pipeline from scratch — on top of free, open Google Earth Engine datasets — to generate that dataset myself, and to make it customizable to whatever a research question needs: any region, any time range, any forecast horizon. Then I standardized it and open-sourced it, so nobody else has to start from zero.
If this pipeline saves you weeks, please use it — and if it helps your work, cite it or drop a note in the Community tab. I read every one, and knowing where these scripts get used is what tells me the effort was worth it.
My hope is simple: lower the barrier so more people — especially students and early-career researchers — can generate their own wildfire datasets and build better predictive models. The fight against wildfires is a race against time; it's won through innovation and collaboration.
📋 Table of contents
- What you get
- Data sources
- How the pipeline works
- The scripts, in order
- Quickstart: generate your own dataset
- Output format
- The model & results (optional)
- Intended uses
- Limitations & scope
- Licensing & source-data terms
- How to cite
- Contribute, comment & contact
What you get
- 11 documented notebooks covering the full data path: raw extraction → spatial/temporal alignment → cleaning → scaling → sliding-window sequence generation. (The model/training code is kept in the GitHub repo; this repo is the reusable data pipeline.)
- A 1 km × 1 km, daily, EPSG:4326 grid that fuses six open geospatial sources into one aligned record per cell per day.
- Two dataset flavours from the same pipeline: detection (is there a fire on the last day of the window?) and prediction (will there be a fire in the following days?).
- Built-in handling for the two things that make wildfire ML painful: extreme class imbalance (<2% positive) and sensor gaps (cloud cover, band errors).
- Everything is parameterized — change the country/province, year range, grid scale, window size, and forecast horizon by editing a few variables.
🛰️ Data sources (Table 1)
All feature sources are open datasets on Google Earth Engine (GEE). The pipeline resamples every source onto a common 1 km / daily grid.
| Role | GEE dataset ID | Features used | Native resolution | Native cadence |
|---|---|---|---|---|
| Surface temperature | MODIS/061/MOD11A1 |
LST_Day_1km, LST_Night_1km, Emis_31, Emis_32 |
1 km | Daily |
| Weather (reanalysis) | ECMWF/ERA5_LAND/HOURLY |
temperature_2m, dewpoint_temperature_2m, soil_temperature_level_1, surface_net_thermal_radiation, u_component_of_wind_10m, v_component_of_wind_10m, surface_pressure, total_precipitation |
~9 km (0.1°) | Hourly → daily |
| Vegetation | NASA/VIIRS/002/VNP13A1 |
NDVI |
500 m | 16-day → daily |
| Elevation | USGS/SRTMGL1_003 |
elevation |
30 m | Static |
| Land cover (for filtering) | MODIS/061/MCD12Q1 |
LC_Type1, LW |
500 m | Yearly |
| Fire events (targets) | FIRMS (NASA MODIS/VIIRS active fire) |
T21, confidence → targetY |
~1 km | Daily |
| Region boundaries | FAO/GAUL/2015/level2 |
admin level-2 polygons | — | — |
14 input features total per grid cell per day; fire labels are derived from FIRMS active-fire detections.
ℹ️ Note on the weather (ERA5) step. The ERA5-Land weather features are extracted by
0_0_weather_era5.ipynband joined in0_4_merge_files.ipynb. ERA5-Land is hourly, so0_0aggregates each day per band (sum precipitation, max wind, mean the rest) onto the same 1 km / daily / EPSG:4326 grid, then consolidates to theweatherData-YYYY-MM.parquetthe merge expects. The notebook flags one subtlety worth checking: ERA5-Land accumulated bands (precipitation, thermal radiation) accumulate since 00 UTC, so if those values look inflated, switch them to.max()or useECMWF/ERA5_LAND/DAILY_AGGR.
⚙️ How the pipeline works
1. Spatial alignment — one grid to rule them all. Sources range from 30 m (elevation) to ~9 km (ERA5). I standardize everything to a 1 km × 1 km grid in EPSG:4326 using zonal statistics over a covering grid, so features from different resolutions land in the same cell and can be joined into a single record. (Coarse sources are resampled/interpolated up; fine sources are aggregated down.)
2. Temporal alignment — one cadence. Everything is standardized to a daily baseline. High-frequency sources are downsampled by aggregation (e.g., sum for precipitation, max for wind speed); low-frequency sources (NDVI, land cover) are upsampled by nearest-neighbour, replicating the closest available day.
3. Cleaning & preprocessing.
Per-location time series are sorted, missing values interpolated (linear, then forward/backward fill) to repair sensor gaps from cloud cover and band errors, then feature-scaled (StandardScaler or RobustScaler) with scaling parameters saved so they can be reused at inference.
4. (Optional) vegetation masking.
Filter to vegetated land only (LC_Type1 < 10 and land/water flag LW == 2) to focus on burnable terrain and drop water/urban/barren cells.
5. Sequence generation with imbalance handling. Wildfire data is extremely imbalanced — fire events are < 2% of samples even in peak season. A naive model hits high "accuracy" by always predicting no fire. The pipeline builds sliding-window sequences and rebalances by upsampling fire windows and downsampling non-fire windows to a configurable ratio (default ≈ 4–5 : 1 non-fire : fire) — a compromise between diversity and storage/compute. Downstream training then adds a weighted loss on top.
Two heads come out of the same machinery:
- Detection — window features → fire probability on the last day of the window (
prediction_offset = 0). - Prediction — window features → fire probability for the following days (
prediction_offset = 15, i.e. forecast ~2 weeks ahead).
📁 The scripts, in order
All notebooks live in data_processing/.
| # | Notebook | What it does |
|---|---|---|
| 0.0 | 0_0_weather_era5.ipynb |
Extract ERA5-Land weather; hourly → daily aggregation onto the grid |
| 0.1 | 0_1_surface_temperature.ipynb |
Extract MODIS land-surface temperature → 1 km zonal stats |
| 0.2 | 0_2_firms.ipynb |
Extract FIRMS active-fire records → fire targets |
| 0.3 | 0_3_vegetation_and_elevation.ipynb |
Extract VIIRS NDVI + SRTM elevation, aligned to grid |
| 0.4 | 0_4_merge_files.ipynb |
Chunked join of feature tables + ERA5 weather on (date, lat, lon) |
| 0.5 | 0_5_landcover.ipynb |
Extract MODIS land cover (LC_Type1, LW) |
| 0.6 | 0_6_filter_by_landcover.ipynb |
Keep vegetated land cells only (optional) |
| 1 | 1_process_raw_data_v3.ipynb |
Per-location time-series cleaning + interpolation, batched |
| 1.5 | 1_5_preprocess_time_series_data.ipynb |
Feature scaling; save scaler params |
| 2a | 2_generate_seq_v4_detect.ipynb |
Sliding-window sequences for detection (w=15, o=0) |
| 2b | 2_generate_seq_v4_predict.ipynb |
Sliding-window sequences for prediction (w=15, o=15) |
This repo is the dataset-generation pipeline only. The transformer model and its training notebooks (
3_*_train,v4/model/…) live in the GitHub repo — kept separate so the data pipeline stays reusable on its own.
🚀 Quickstart: generate your own dataset
Prerequisites
- A free Google Earth Engine account (registration → a cloud project ID).
- Google Colab or a Jupyter environment with
earthengine-api,geemap,pandas,pyarrow,dask,numpy,scikit-learn.
Steps
- Pick your region & window. In the
0_*notebooks, setcountry,province,year, andmonths_to_run(defaults ship as Alberta, Canada), and setcloud_projectto your own Google Earth Engine project ID. - Extract features (0.0 → 0.3, 0.5) — each notebook selects a GEE dataset by ID, chooses bands, sets the export resolution (
epsm = 1000), and exports to Google Drive. (0.0= weather,0.1= temperature,0.3= vegetation + elevation,0.5= land cover.) - Merge (0.4) all feature tables with the weather parquet on
(date, latitude, longitude). - (Optional) Filter to vegetation (0.6).
- Clean & scale (1 → 1.5).
- Generate sequences (2a / 2b) — set
WINDOW_SIZE,PREDICTION_OFFSET, andNEG_POS_RATIO; get a compressed.npzper task. - (Optional) Train (3a / 3b) the reference transformer, or plug the arrays into your own model.
See the tutorial for a screenshot-level walkthrough.
📦 Output format
The pipeline emits compressed NumPy archives, named by hyperparameters so runs are self-documenting:
sequences_y2019-2024_w15_o0_r4.npz # years 2019–2024, window 15, offset 0, neg:pos ratio 4
Each archive contains sliding-window feature tensors X of shape (N, WINDOW_SIZE, 14) and fire-label targets y (binary targetY plus probability and multi-offset variants), ready to load with numpy.load.
🤖 The model & results
The pipeline was validated with a transformer-based sequence model (FireTransformer) chosen over CNN+LSTM for its self-attention over the daily window and its headroom for future pre-training. On the author's evaluation, using AUC-PR as the primary metric (appropriate for heavy imbalance):
- Detection: ≈ 11% better recall / lower fire-miss-rate than snapshot-based NN baselines, at a comparable false-alarm rate.
- Prediction: ≈ 61% better recall / lower fire-miss-rate than CNN and MLP baselines, with a slightly higher — but far less costly — false-alarm rate.
Full methodology, tables, and figures are in the project write-up. (These are the author's reported results; reproduce with the notebooks and your own splits.)
🎯 Intended uses
- Generating training data for wildfire detection / early-warning / forecasting models.
- Benchmarking sequence models against tabular/snapshot baselines on a realistic, imbalanced geospatial task.
- Teaching end-to-end remote-sensing + time-series ML.
- A starting point for adding sources (e.g., lightning, human-activity, fuel-moisture) or new regions.
⚠️ Limitations & scope
- Region/season defaults are Alberta, Canada, fire season — configurable, but not yet validated worldwide.
- FIRMS labels reflect detected active fire; detection gaps (cloud, overpass timing) propagate into labels.
- Interpolation fills sensor gaps and can smooth real discontinuities — appropriate for trends, treat single-day extremes with care.
- Rebalancing changes the base rate; report metrics like AUC-PR / recall / FNR, not raw accuracy.
- This repo hosts the generation code, not a hosted dataset — you regenerate from GEE (which keeps it current and lets you choose your own region).
📄 Licensing & source-data terms
- This pipeline (scripts & documentation): CC-BY-4.0 — free to use, adapt, and redistribute with attribution.
- Source datasets retain their own terms. MODIS, VIIRS, SRTM, and FIRMS are NASA/USGS products (generally open, citation requested); ERA5-Land is ECMWF/Copernicus (open under the Copernicus licence). When you publish a dataset generated with this pipeline, credit the original data providers alongside this pipeline.
📚 How to cite
If this pipeline supports your research, teaching, or product, please cite it. (Replace the placeholder fields before publishing.)
@software{jasminew2026wildfire,
  author  = {Jasmine W.},
  title   = {Wildfire Multi-Source Spatiotemporal Dataset — Generation Pipeline},
  year    = 2026,
  url      = {https://huggingface.co/datasets/jasmine314342/wildfire-dataset-pipeline},
  note    = {Code: https://github.com/JasmineW6214/wildfire ; Project: https://wildfire-project.vercel.app},
  license = {CC-BY-4.0}
}
Plain text: Jasmine W.. Wildfire Multi-Source Spatiotemporal Dataset — Generation Pipeline. 2026. https://huggingface.co/datasets/jasmine314342/wildfire-dataset-pipeline
💬 Contribute, comment & contact
I actively want your feedback and questions — this page is meant to be a conversation.
- 💭 Open the Community tab and tell me: Which region or fire season would you want a ready-made dataset for? Your answer helps me prioritize.
- 🐛 Found a bug, a better source, or a resolution mismatch? Open a discussion or a PR.
- ⭐ If this saved you time, a like on this repo helps other researchers find it.
- 📄 Using it in a paper or project? I'd love to hear about it — drop a link in the discussions.
- ✉️ Contact: Jasmine W. — 1wangjas2@gmail.com
Especially if you're a student or early-career researcher: reach out. Lowering the barrier to wildfire research is the whole point of this project.
🙏 Acknowledgements
Data courtesy of NASA LP DAAC / FIRMS, USGS, and ECMWF / Copernicus, accessed via Google Earth Engine. Built to help the communities — including Indigenous communities — most affected by wildfire.
- Downloads last month
- 58