

YAML Metadata Warning:empty or missing yaml metadata in repo card
Check out the documentation for more information.
NCAA Basketball Player Value Analysis & Prediction
Project Video Overview
Overview
This project explores a comprehensive dataset of NCAA college basketball players to understand patterns in player efficiency and to build machine learning models that can predict a player's intrinsic value.
The workflow includes:
- Exploratory Data Analysis (EDA) to understand the data story.
- Regression Models to predict the exact value metric (
porpag). - Feature Engineering using Unsupervised Learning (Clustering).
- Classification Models to categorize players into performance tiers.
- Model Selection based on performance metrics.
1. Exploratory Data Analysis (EDA)
We started by analyzing the distribution of the target variable and understanding key correlations.
Target Distribution
First, we looked at the spread of player value across the entire dataset.

Correlation Analysis
We examined which statistics are most strongly correlated with player value.

Key Drivers: Efficiency & Usage
We investigated the relationship between shooting efficiency, usage rate, and value.
Efficiency: A strong positive correlation exists between effective shooting and value.

Usage Rate: We analyzed how volume of play (
usg) impacts value.


Categorical Insights: Conference & Class
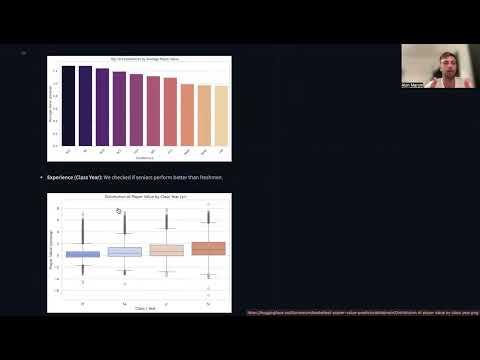
Conference Strength: Major conferences produce higher-valued players on average.

Experience (Class Year): We checked if seniors perform better than freshmen.


2. Regression Modeling
We trained a baseline Linear Regression model to predict the exact porpag score.
Performance: Actual vs. Predicted
The scatter plot below shows how well the model's predictions align with reality. Ideally, points should lie on the diagonal red line.

Feature Importance (Linear Model)
We analyzed which features had the highest positive and negative coefficients in the regression model.

3. Feature Engineering (Clustering)
We used K-Means Clustering to identify 5 distinct player archetypes based on their stats.
Cluster Visualization (PCA)
Using Principal Component Analysis (PCA), we visualized the clusters in 2D space.

Interpreting the Clusters
To understand the meaning of each group, we analyzed the average player value within each cluster.

4. Classification Modeling
We reframed the problem to classify players into three balanced tiers: Low, Mid, and High Value.
Class Balance Check
We ensured the classes were balanced (approx. 33% each) before training.

Model Comparison
We trained three models (Logistic Regression, Random Forest, Gradient Boosting) and compared their RMSE/Error rates.

Prediction Visualization
A visualization of the predicted labels compared to true labels (Confusion Matrix / Prediction Spread).

5. Winning Model Analysis
The Gradient Boosting / Random Forest model was selected as the winner due to superior performance.
Top Predictors
What features mattered most to the winning model?

6. How to Use & Model Deployment
The trained models are hosted on Hugging Face for easy access and reproducibility.
[
Available Models
- Regression Model (
random_forest_model.pkl): Predicts exactporpagvalue. - Classification Model (
gradient_boosting_classifier.pkl): Predicts player tier (Low/Mid/High).
Loading the Models locally
After downloading the .pkl files, you can load them using Python:
import pickle

# Example: Load the classification model
with open("gradient_boosting_classifier.pkl", "rb") as f:
    model = pickle.load(f)

print("Model loaded successfully!")
7. Conclusion & Key Takeaways
This analysis demonstrated that NCAA player value is highly predictable using statistical performance metrics. By combining exploratory analysis with advanced machine learning techniques, we established a robust framework for player evaluation.
Key Findings:
- Efficiency over Volume: While usage rate is important, shooting efficiency (Effective Field Goal Percentage) proved to be a more critical driver of high player value (
porpag). - The Power of Ensembles: Non-linear models like Random Forest and Gradient Boosting significantly outperformed linear baselines, highlighting the complex, non-linear relationships between player stats and their overall impact.
- Actionable Insights: The segmentation of players into clusters and value tiers allows scouts and coaches to go beyond raw averages, identifying specific player archetypes that fit their team's strategic needs.