Endometrial cancer segmentation
This repository contains weights and exported learner (encapsulates both the model architecture and its trained parameters) for a deep learning model designed to automate the segmentation of endometrial cancer on MR images. Our VIBE model utilizes a Residual U-Net architecture, trained on data derived from the study Automated segmentation of endometrial cancer on MR images using deep learning. The primary objective of this repository is to reproduce the results reported in the study and to integrate this model into research PACS (see Results for VIBE section). In addition, we have looked at improving the segmentation performance using multi-sequence MR images (T2w, VIBE, and ADC) (see Results for multi-sequence (T2, VIBE, and ADC) section).
Requirements
Last checked and validated with fastMONAI version 0.3.9. Please ensure that you have the correct version of fastMONAI installed to guarantee the correct operation of the model.
Usage
The source code for training the model and running inference on your own data is available at: https://github.com/MMIV-ML/fastMONAI/tree/master/research/endometrial_cancer. Test our model live with the Gradio app for VIBE on Hugging Face Spaces.
Results for VIBE
Note that our results are not directly comparable with the results reported in study, as we opted to use the test set for validation to allocate more data to training. Unlike the approach detailed in the study, we refrained from post-processing steps, such as retaining only the largest object.
Predictions from new test cases indicate that this method could occasionally eliminate the tumor.
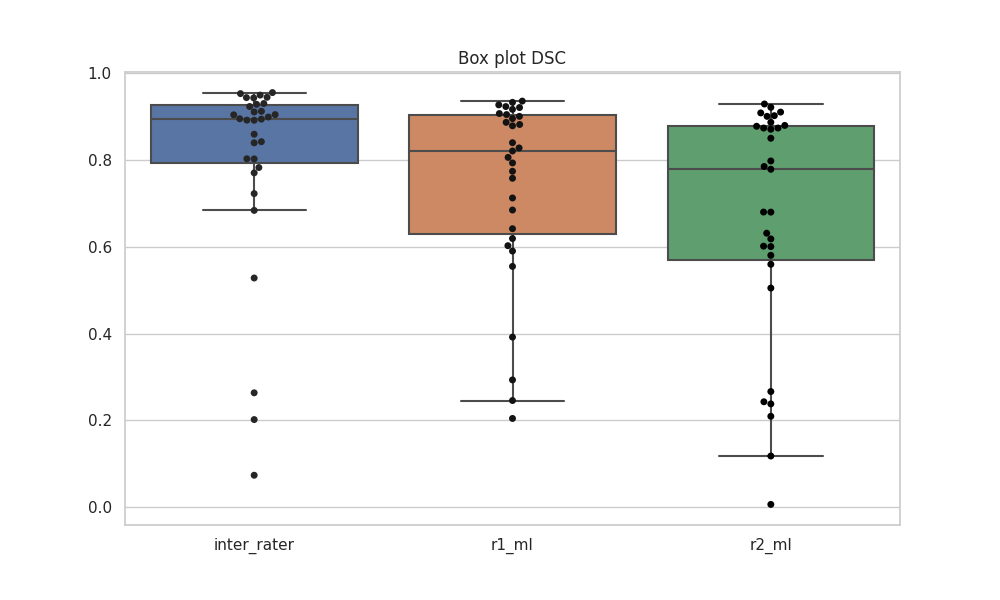
Below is the box plot showcasing predictions on the validation set:
The results from the validation set are also presented in the table below:
| subject_id | tumor_vol | inter_rater | r1_ml | r2_ml | n_components | |
|---|---|---|---|---|---|---|
| 0 | 29 | 4.16 | 0.201835 | 0.806382 | 0.00623053 | 3 |
| 1 | 32 | 8 | 0.684142 | 0.293306 | 0.209449 | 4 |
| 2 | 36 | 19.06 | 0.92875 | 0.793055 | 0.784799 | 2 |
| 3 | 47 | 11.01 | 0.944209 | 0.900945 | 0.898409 | 2 |
| 4 | 50 | 6.26 | 0.722867 | 0.614357 | 0.624832 | 1 |
| 5 | 65 | 13.09 | 0.930613 | 0.879279 | 0.850546 | 2 |
| 6 | 67 | 3.71 | 0.943498 | 0.887189 | 0.878163 | 2 |
| 7 | 75 | 7.16 | 0.263539 | 0.774237 | 0.266619 | 2 |
| 8 | 86 | 7.04 | 0.842577 | 0.821208 | 0.798148 | 1 |
| 9 | 135 | 8.1 | 0.839964 | 0.758176 | 0.680348 | 2 |
| 10 | 140 | 19.78 | 0.895506 | 0.936177 | 0.874019 | 4 |
| 11 | 164 | 16.98 | 0.905008 | 0.923559 | 0.887268 | 1 |
| 12 | 246 | 6.59 | 0.899448 | 0.895311 | 0.860322 | 3 |
| 13 | 255 | 36.22 | 0.955784 | 0.927517 | 0.921816 | 6 |
| 14 | 343 | 0.69 | 0.528261 | 0.840237 | 0.600751 | 4 |
| 15 | 349 | 2.96 | 0.912664 | 0.828181 | 0.778983 | 1 |
| 16 | 367 | 1.02 | 0.0734848 | 0.391737 | 0.118035 | 1 |
| 17 | 370 | 10.82 | 0.953443 | 0.917094 | 0.908893 | 1 |
| 18 | 371 | 3.83 | 0.859781 | 0.684751 | 0.618114 | 1 |
| 19 | 375 | 11.67 | 0.911141 | 0.921079 | 0.91056 | 4 |
| 20 | 377 | 4.37 | 0.782994 | 0.712791 | 0.680165 | 1 |
| 21 | 381 | 7.63 | 0.89199 | 0.246428 | 0.238641 | 1 |
| 22 | 385 | 2.67 | 0.803215 | 0.641916 | 0.60169 | 1 |
| 23 | 395 | 0.68 | 0.770738 | 0.198273 | 0.236343 | 5 |
| 24 | 397 | 5.94 | 0.904544 | 0.882265 | 0.874036 | 3 |
| 25 | 409 | 11.86 | 0.944934 | 0.900727 | 0.900767 | 1 |
| 26 | 411 | 5.98 | 0.949977 | 0.933271 | 0.929499 | 1 |
| 27 | 425 | 0.91 | 0.802867 | 0.589069 | 0.545761 | 1 |
| 28 | 434 | 94.42 | 0.894601 | 0.590408 | 0.580585 | 1 |
| 29 | 531 | 22.08 | 0.89225 | 0.555066 | 0.505109 | 1 |
| 30 | 540 | 8.35 | 0.923702 | 0.855009 | 0.840958 | 1 |
Median DSC: 0.8946, 0.8212, 0.779
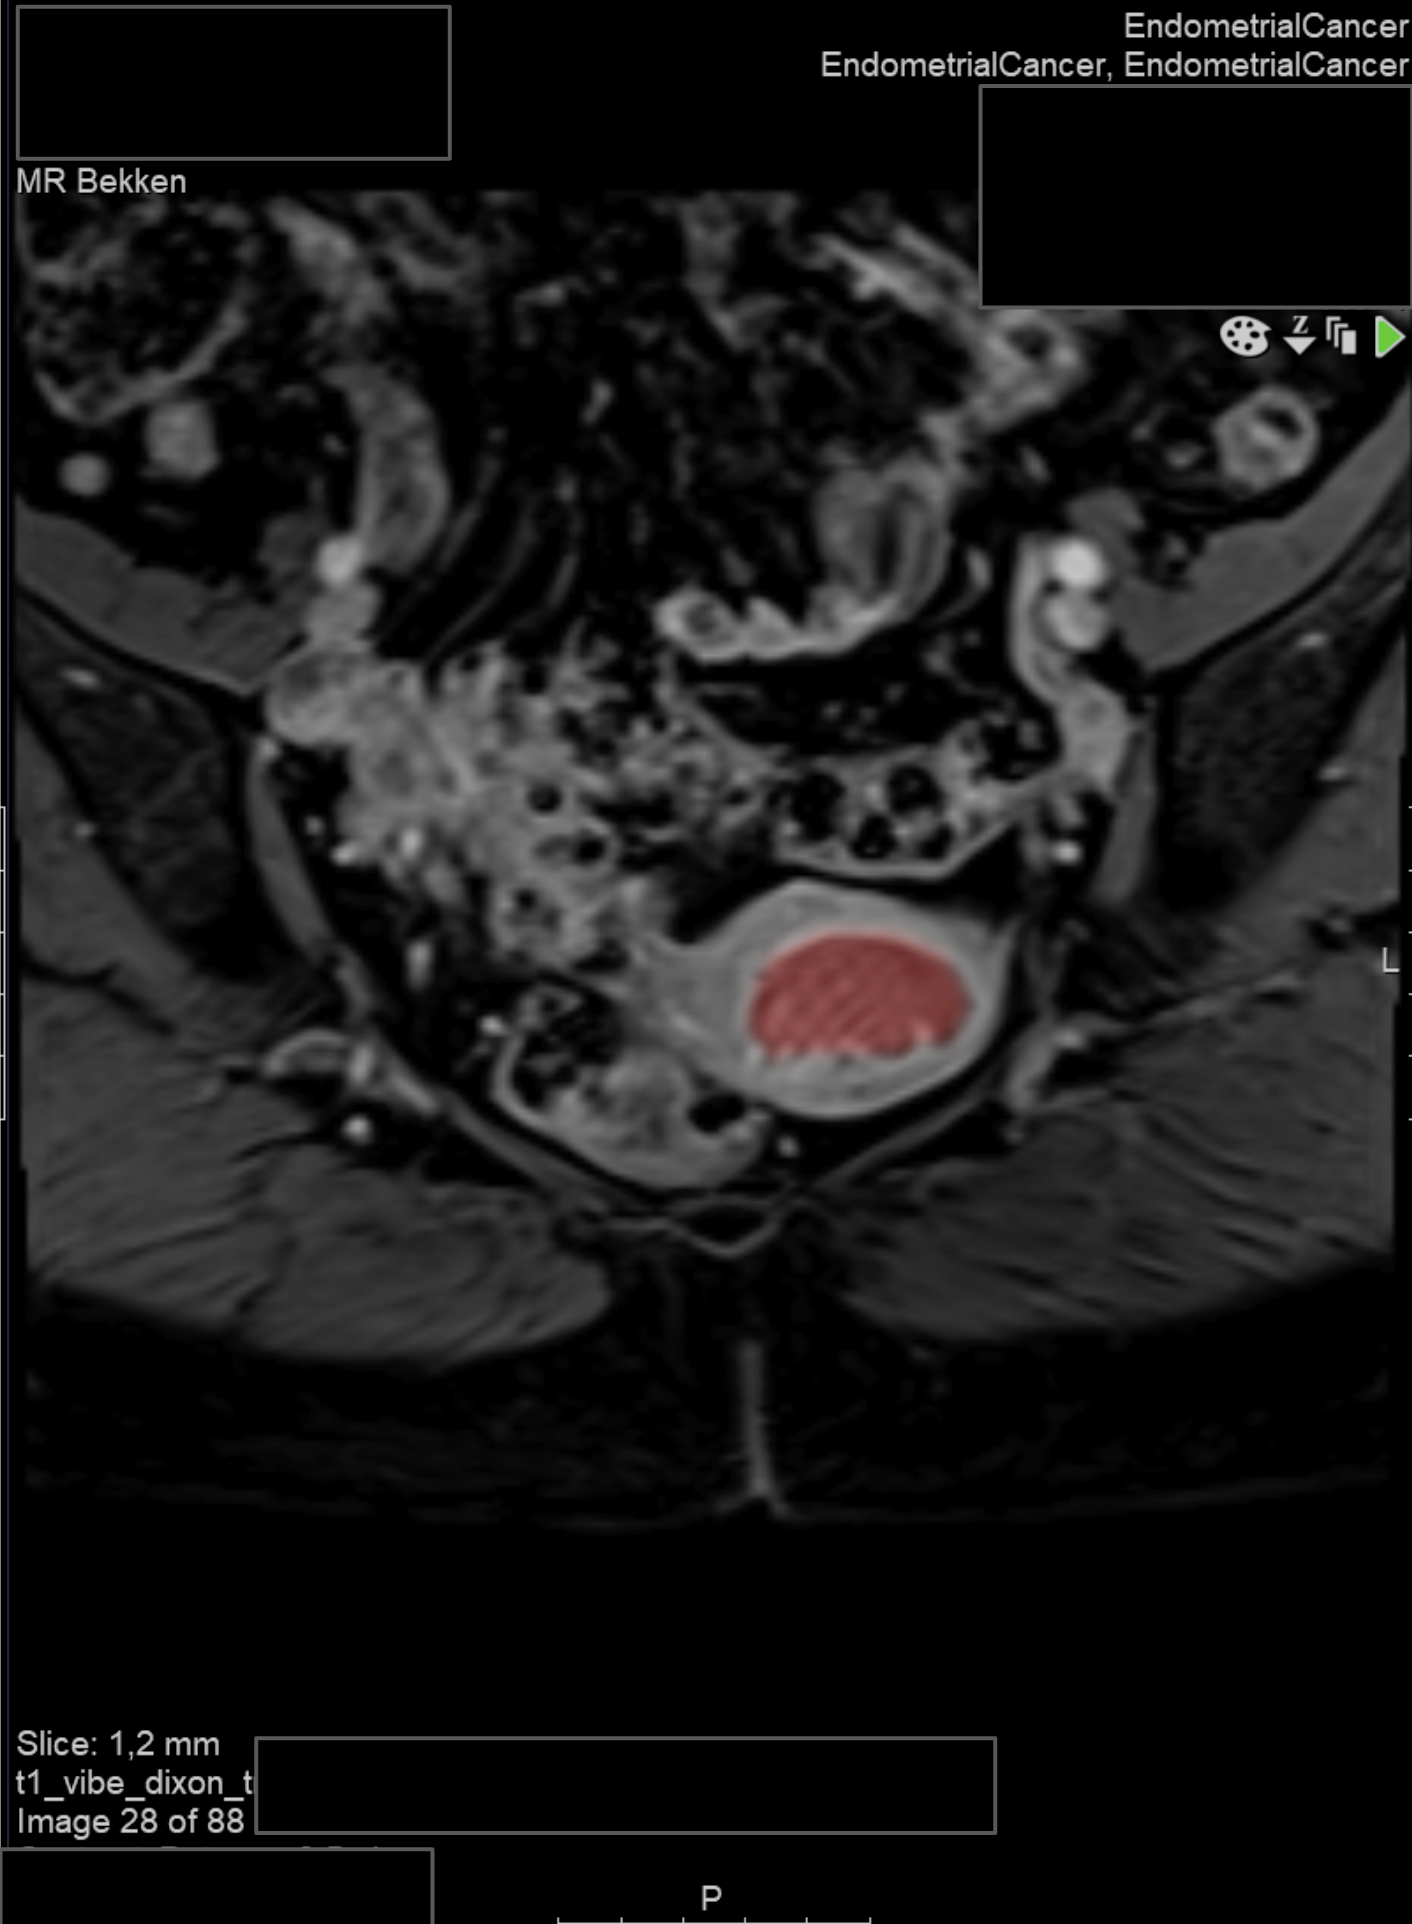
Prediction on a new subject in the research PACS:

Results for multi-sequence (T2, VIBE, and ADC)
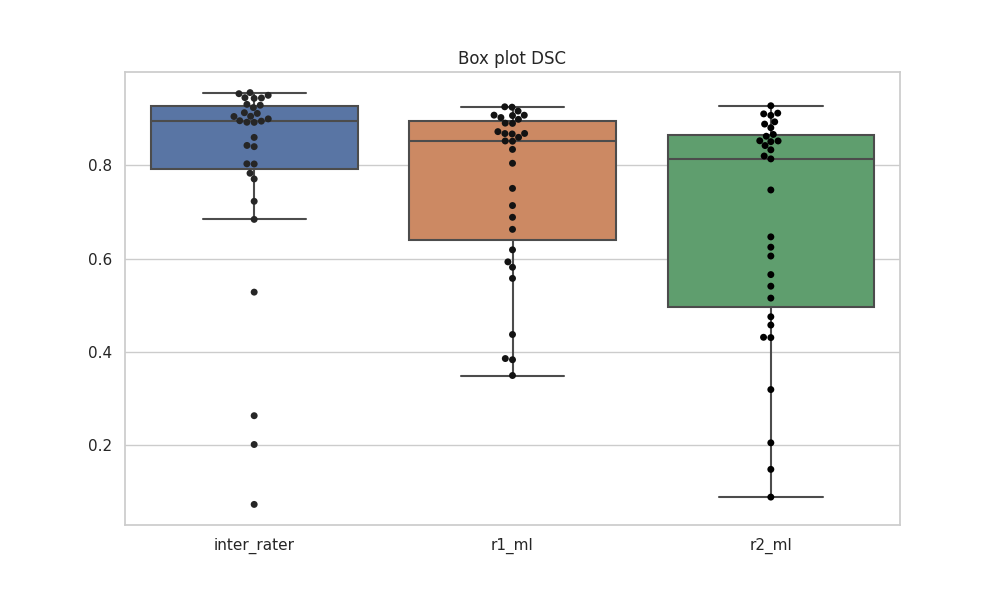
The box plot of the predictions on the validation set:

The results from the validation set are also presented in the table below:
| subject_id | tumor_vol | inter_rater | r1_ml | r2_ml | n_components | |
|---|---|---|---|---|---|---|
| 0 | 29 | 4.16 | 0.201835 | 0.859937 | 0.148586 | 4 |
| 1 | 32 | 8 | 0.684142 | 0.662779 | 0.515479 | 10 |
| 2 | 36 | 19.06 | 0.92875 | 0.902343 | 0.888306 | 1 |
| 3 | 47 | 11.01 | 0.944209 | 0.907344 | 0.907 | 3 |
| 4 | 50 | 6.26 | 0.722867 | 0.581594 | 0.540991 | 5 |
| 5 | 65 | 13.09 | 0.930613 | 0.889782 | 0.862255 | 4 |
| 6 | 67 | 3.71 | 0.943498 | 0.851658 | 0.842331 | 2 |
| 7 | 75 | 7.16 | 0.263539 | 0.750551 | 0.205457 | 2 |
| 8 | 86 | 7.04 | 0.842577 | 0.87216 | 0.81374 | 1 |
| 9 | 135 | 8.1 | 0.839964 | 0.80436 | 0.747164 | 1 |
| 10 | 140 | 19.78 | 0.895506 | 0.907457 | 0.852548 | 1 |
| 11 | 164 | 16.98 | 0.905008 | 0.92533 | 0.893135 | 2 |
| 12 | 246 | 6.59 | 0.899448 | 0.906569 | 0.852195 | 5 |
| 13 | 255 | 36.22 | 0.955784 | 0.924517 | 0.927624 | 2 |
| 14 | 343 | 0.69 | 0.528261 | 0.868251 | 0.457711 | 3 |
| 15 | 349 | 2.96 | 0.912664 | 0.85214 | 0.819898 | 1 |
| 16 | 367 | 1.02 | 0.0734848 | 0.383455 | 0.0891463 | 3 |
| 17 | 370 | 10.82 | 0.953443 | 0.916154 | 0.911768 | 2 |
| 18 | 371 | 3.83 | 0.859781 | 0.593136 | 0.565848 | 8 |
| 19 | 375 | 11.67 | 0.911141 | 0.898501 | 0.910147 | 3 |
| 20 | 377 | 4.37 | 0.782994 | 0.713798 | 0.646684 | 3 |
| 21 | 381 | 7.63 | 0.89199 | 0.4375 | 0.430847 | 1 |
| 22 | 385 | 2.67 | 0.803215 | 0.688608 | 0.624595 | 1 |
| 23 | 395 | 0.68 | 0.770738 | 0.385992 | 0.43154 | 2 |
| 24 | 397 | 5.94 | 0.904544 | 0.868022 | 0.850653 | 6 |
| 25 | 409 | 11.86 | 0.944934 | 0.83407 | 0.833206 | 5 |
| 26 | 411 | 5.98 | 0.949977 | 0.867137 | 0.866112 | 1 |
| 27 | 425 | 0.91 | 0.802867 | 0.557732 | 0.475499 | 3 |
| 28 | 434 | 94.42 | 0.894601 | 0.618916 | 0.605596 | 6 |
| 29 | 531 | 22.08 | 0.89225 | 0.349648 | 0.319533 | 1 |
| 30 | 540 | 8.35 | 0.923702 | 0.890343 | 0.88052 | 1 |
Median DSC: 0.8946, 0.8521, 0.8137
Results for multi-sequence (T2, VIBE, and ADC) with extra training data (n=54)
Need to run cross-validation to make a better comparison.
| subject_id | tumor_vol | inter_rater | r1_ml | r2_ml | n_components | |
|---|---|---|---|---|---|---|
| 0 | 29 | 4.16 | 0.201835 | 0.836437 | 0.0599303 | 2 |
| 1 | 32 | 8 | 0.684142 | 0.65186 | 0.503093 | 11 |
| 2 | 36 | 19.06 | 0.92875 | 0.876779 | 0.862773 | 3 |
| 3 | 47 | 11.01 | 0.944209 | 0.914218 | 0.911429 | 4 |
| 4 | 50 | 6.26 | 0.722867 | 0.667869 | 0.60398 | 1 |
| 5 | 65 | 13.09 | 0.930613 | 0.88374 | 0.859066 | 1 |
| 6 | 67 | 3.71 | 0.943498 | 0.861391 | 0.851904 | 1 |
| 7 | 75 | 7.16 | 0.263539 | 0.769195 | 0.236445 | 4 |
| 8 | 86 | 7.04 | 0.842577 | 0.848937 | 0.80314 | 3 |
| 9 | 135 | 8.1 | 0.839964 | 0.810392 | 0.732383 | 1 |
| 10 | 140 | 19.78 | 0.895506 | 0.92261 | 0.865316 | 1 |
| 11 | 164 | 16.98 | 0.905008 | 0.923593 | 0.879799 | 5 |
| 12 | 246 | 6.59 | 0.899448 | 0.919342 | 0.864234 | 1 |
| 13 | 255 | 36.22 | 0.955784 | 0.939234 | 0.938806 | 2 |
| 14 | 343 | 0.69 | 0.528261 | 0.839357 | 0.448649 | 5 |
| 15 | 349 | 2.96 | 0.912664 | 0.877018 | 0.839009 | 1 |
| 16 | 367 | 1.02 | 0.0734848 | 0.255149 | 0.0615073 | 1 |
| 17 | 370 | 10.82 | 0.953443 | 0.916431 | 0.907043 | 18 |
| 18 | 371 | 3.83 | 0.859781 | 0.508698 | 0.475138 | 1 |
| 19 | 375 | 11.67 | 0.911141 | 0.90593 | 0.910805 | 1 |
| 20 | 377 | 4.37 | 0.782994 | 0.622583 | 0.598939 | 4 |
| 21 | 381 | 7.63 | 0.89199 | 0.392978 | 0.381061 | 1 |
| 22 | 385 | 2.67 | 0.803215 | 0.666327 | 0.583576 | 2 |
| 23 | 395 | 0.68 | 0.770738 | 0.53442 | 0.54433 | 4 |
| 24 | 397 | 5.94 | 0.904544 | 0.867964 | 0.868074 | 5 |
| 25 | 409 | 11.86 | 0.944934 | 0.826939 | 0.827658 | 5 |
| 26 | 411 | 5.98 | 0.949977 | 0.786394 | 0.796158 | 1 |
| 27 | 425 | 0.91 | 0.802867 | 0.508261 | 0.43545 | 1 |
| 28 | 434 | 94.42 | 0.894601 | 0.77102 | 0.758085 | 2 |
| 29 | 531 | 22.08 | 0.89225 | 0.271076 | 0.253303 | 1 |
| 30 | 540 | 8.35 | 0.923702 | 0.898613 | 0.890637 | 1 |
Median DSC: 0.8946, 0.8364, 0.7962
Support and Contribution
For any issues related to the model or the source code, please open an issue in the corresponding GitHub repository. Contributions to the code or the model are welcome and should be proposed through a pull request.