

rabuahmad/cc-tweets-classifier
Text Classification
•
Updated
•
12
statement_idx
int64 0
8.09k
| report
stringclasses 3
values | page_num
int64 18
2.84k
| sent_num
int64 0
78
| statement
stringlengths 13
4.29k
| confidence
stringclasses 4
values | score
int64 0
3
| split
stringclasses 2
values |
|---|---|---|---|---|---|---|---|
0 | AR6_WGI | 20 | 22 | Since 2011 (measurements reported in AR5), concentrations have continued to increase in the atmosphere, reaching annual averages of 410 parts per million (ppm) for carbon dioxide (CO 2), 1866 parts per billion (ppb) for methane (CH 4), and 332 ppb for nitrous oxide (N 2O) in 2019.6 Land and ocean have taken up a near-constant proportion (globally about 56% per year) of CO 2 emissions from human activities over the past six decades, with regional differences | high | 2 | train |
1 | AR6_WGI | 21 | 8 | Mid-latitude storm tracks have likely shifted poleward in both hemispheres since the 1980s, with marked seasonality in trends | medium | 1 | train |
2 | AR6_WGI | 21 | 18 | The average rate of sea level rise was 1.3 [0.6 to 2.1] mm yr–1 between 1901 and 1971, increasing to 1.9 [0.8 to 2.9] mm yr–1 between 1971 and 2006, and further increasing to 3.7 [3.2 to 4.2] mm yr–1 between 2006 and 2018 | high | 2 | train |
3 | AR6_WGI | 24 | 2 | Since 1750, increases in CO2 (47%) and CH4 (156%) concentrations far exceed – and increases in N2O (23%) are similar to – the natural multi-millennial changes between glacial and interglacial periods over at least the past 800,000 years | very high | 3 | test |
4 | AR6_WGI | 24 | 4 | Temperatures during the most recent decade (2011–2020) exceed those of the most recent multi-century warm period, around 6500 years ago13 [0.2°C to 1°C relative to 1850–1900] | medium | 1 | train |
5 | AR6_WGI | 24 | 5 | Prior to that, the next most recent warm period was about 125,000 years ago, when the multi-century temperature [0.5°C to 1.5°C relative to 1850–1900] overlaps the observations of the most recent decade | medium | 1 | train |
6 | AR6_WGI | 24 | 7 | Late summer Arctic sea ice area was smaller than at any time in at least the past 1000 years | medium | 1 | train |
7 | AR6_WGI | 24 | 8 | The global nature of glacier retreat since the 1950s, with almost all of the world’s glaciers retreating synchronously, is unprecedented in at least the last 2000 years | medium | 1 | train |
8 | AR6_WGI | 24 | 10 | The global ocean has warmed faster over the past century than since the end of the last deglacial transition (around 11,000 years ago) | medium | 1 | train |
9 | AR6_WGI | 24 | 11 | A long-term increase in surface open ocean pH occurred over the past 50 million years | high | 2 | train |
10 | AR6_WGI | 24 | 12 | However, surface open ocean pH as low as recent decades is unusual in the last 2 million years | medium | 1 | train |
11 | AR6_WGI | 24 | 17 | Marine heatwaves have approximately doubled in frequency since the 1980s | high | 2 | train |
12 | AR6_WGI | 24 | 19 | Human-induced climate change has contributed to increases in agricultural and ecological droughts15 in some regions due to increased land evapotranspiration16 | medium | 1 | train |
13 | AR6_WGI | 25 | 1 | Over South Asia, East Asia and West Africa, increases in monsoon precipitation due to warming from GHG emissions were counteracted by decreases in monsoon precipitation due to cooling from human-caused aerosol emissions over the 20th century | high | 2 | train |
14 | AR6_WGI | 25 | 2 | Increases in West African monsoon precipitation since the 1980s are partly due to the growing influence of GHGs and reductions in the cooling effect of human-caused aerosol emissions over Europe and North America | medium | 1 | train |
15 | AR6_WGI | 25 | 5 | Event attribution studies and physical understanding indicate that human-induced climate change increases heavy precipitation associated with tropical cyclones | high | 2 | train |
16 | AR6_WGI | 25 | 7 | This includes increases in the frequency of concurrent heatwaves and droughts on the global scale (high confidence), fire weather in some regions of all inhabited continents (medium confidence), and compound flooding in some locations | medium | 1 | train |
17 | AR6_WGI | 27 | 21 | The remainder is due to improved scientific understanding and changes in the assessment of aerosol forcing, which include decreases in concentration and improvement in its calculation | high | 2 | train |
18 | AR6_WGI | 27 | 23 | The observed average rate of heating of the climate system increased from 0.50 [0.32 to 0.69] W m–2 for the period 1971–200619 to 0.79 [0.52 to 1.06] W m–2 for the period 2006–201820 | high | 2 | train |
19 | AR6_WGI | 27 | 24 | Ocean warming accounted for 91% of the heating in the climate system, with land warming, ice loss and atmospheric warming accounting for about 5%, 3% and 1%, respectively | high | 2 | train |
20 | AR6_WGI | 27 | 28 | Together, ice-sheet and glacier mass loss were the dominant contributors to global mean sea level rise during 2006–2018 | high | 2 | train |
21 | AR6_WGI | 27 | 30 | Based on multiple lines of evidence,21 the very likely range of equilibrium climate sensitivity is between 2°C (high confidence) and 5°C | medium | 1 | train |
22 | AR6_WGI | 27 | 31 | The AR6 assessed best estimate is 3°C with a likely range of 2.5°C to 4°C | high | 2 | train |
23 | AR6_WGI | 31 | 7 | For example, every additional 0.5°C of global warming causes clearly discernible increases in the intensity and frequency of hot extremes, including heatwaves (very likely), and heavy precipitation (high confidence), as well as agricultural and ecological droughts30 in some regions | high | 2 | train |
24 | AR6_WGI | 31 | 8 | Discernible changes in intensity and frequency of meteorological droughts, with more regions showing increases than decreases, are seen in some regions for every additional 0.5°C of global warming | medium | 1 | train |
25 | AR6_WGI | 31 | 9 | Increases in frequency and intensity of hydrological droughts become larger with increasing global warming in some regions | medium | 1 | train |
26 | AR6_WGI | 31 | 11 | Projected percentage changes in frequency are larger for rarer events | high | 2 | train |
27 | AR6_WGI | 31 | 13 | The Arctic is projected to experience the highest increase in the temperature of the coldest days, at about three times the rate of global warming | high | 2 | train |
28 | AR6_WGI | 31 | 14 | With additional global warming, the frequency of marine heatwaves will continue to increase (high confidence), particularly in the tropical ocean and the Arctic | medium | 1 | train |
29 | AR6_WGI | 32 | 1 | At the global scale, extreme daily precipitation events are projected to intensify by about 7% for each 1°C of global warming | high | 2 | train |
30 | AR6_WGI | 32 | 2 | The proportion of intense tropical cyclones (Category 4–5) and peak wind speeds of the most intense tropical cyclones are projected to increase at the global scale with increasing global warming | high | 2 | train |
31 | AR6_WGI | 35 | 20 | The portion of the global land experiencing detectable increases or decreases in seasonal mean precipitation is projected to increase | medium | 1 | train |
32 | AR6_WGI | 35 | 25 | The monsoon season is projected to have a delayed onset over North and South America and West Africa (high confidence) and a delayed retreat over West Africa | medium | 1 | train |
33 | AR6_WGI | 36 | 1 | This is projected to result in a higher proportion of emitted CO 2 remaining in the atmosphere | high | 2 | train |
34 | AR6_WGI | 36 | 3 | Under the very low and low GHG emissions scenarios (SSP1-1.9, SSP1-2.6), where CO 2 concentrations peak and decline during the 21st century, the land and ocean begin to take up less carbon in response to declining atmospheric CO 2 concentrations (high confidence) and turn into a weak net source by 2100 under SSP1-1.9 | medium | 1 | train |
35 | AR6_WGI | 36 | 4 | It is very unlikely that the combined global land and ocean sink will turn into a source by 2100 under scenarios without net negative emissions (SSP2-4.5, SSP3-7.0, SSP5-8.5).32 {4.3, 5.4, 5.5, 5.6, Box TS.5, TS.3.3} B.4.3 The magnitude of feedbacks between climate change and the carbon cycle becomes larger but also more uncertain in high CO 2 emissions scenarios | very high | 3 | train |
36 | AR6_WGI | 36 | 5 | However, climate model projections show that the uncertainties in atmospheric CO 2 concentrations by 2100 are dominated by the differences between emissions scenarios | high | 2 | train |
37 | AR6_WGI | 36 | 6 | Additional ecosystem responses to warming not yet fully included in climate models, such as CO 2 and CH 4 fluxes from wetlands, permafrost thaw and wildfires, would further increase concentrations of these gases in the atmosphere | high | 2 | train |
38 | AR6_WGI | 37 | 7 | Based on multiple lines of evidence, upper ocean stratification (virtually certain), ocean acidification (virtually certain) and ocean deoxygenation | high | 2 | train |
39 | AR6_WGI | 37 | 8 | Changes are irreversible on centennial to millennial time scales in global ocean temperature (very high confidence), deep-ocean acidification (very high confidence) and deoxygenation | medium | 1 | train |
40 | AR6_WGI | 37 | 10 | Loss of permafrost carbon following permafrost thaw is irreversible at centennial time scales | high | 2 | train |
41 | AR6_WGI | 37 | 14 | Relative to 1995–2014, the likely global mean sea level rise by 2100 is 0.28–0.55 m under the very low GHG emissions scenario (SSP1-1.9); 0.32–0.62 m under the low GHG emissions scenario (SSP1-2.6); 0.44–0.76 m under the intermediate GHG emissions scenario (SSP2-4.5); and 0.63–1.01 m under the very high GHG emissions scenario (SSP5-8.5); and by 2150 is 0.37–0.86 m under the very low scenario (SSP1-1.9); 0.46–0.99 m under the low scenario (SSP1-2.6); 0.66–1.33 m under the intermediate scenario (SSP2-4.5); and 0.98–1.88 m under the very high scenario (SSP5-8.5) (medium confidence).35 Global mean sea level rise above the likely range – approaching 2 m by 2100 and 5 m by 2150 under a very high GHG emissions scenario (SSP5-8.5) | low | 0 | train |
42 | AR6_WGI | 37 | 16 | Over the next 2000 years, global mean sea level will rise by about 2 to 3 m if warming is limited to 1.5°C, 2 to 6 m if limited to 2°C and 19 to 22 m with 5°C of warming, and it will continue to rise over subsequent millennia | low | 0 | test |
43 | AR6_WGI | 37 | 17 | Projections of multi-millennial global mean sea level rise are consistent with reconstructed levels during past warm climate periods: likely 5–10 m higher than today around 125,000 years ago, when global temperatures were very likely 0.5°C–1.5°C higher than 1850–1900; and very likely 5–25 m higher roughly 3 million years ago, when global temperatures were 2.5°C–4°C higher | medium | 1 | train |
44 | AR6_WGI | 39 | 32 | For example, internal decadal variability and variations in solar and volcanic drivers partially masked human-caused surface global warming during 1998–2012, with pronounced regional and seasonal signatures | high | 2 | train |
45 | AR6_WGI | 39 | 33 | Nonetheless, the heating of the climate system continued during this period, as reflected in both the continued warming of the global ocean (very high confidence) and in the continued rise of hot extremes over land | medium | 1 | train |
46 | AR6_WGI | 40 | 1 | At global and regional scales, near-term changes in monsoons will be dominated by the effects of internal variability | medium | 1 | train |
47 | AR6_WGI | 40 | 2 | In addition to the influence of internal variability, near-term projected changes in precipitation at global and regional scales are uncertain because of model uncertainty and uncertainty in forcings from natural and anthropogenic aerosols | medium | 1 | train |
48 | AR6_WGI | 40 | 8 | Further decreases are projected in permafrost; snow, glaciers and ice sheets; and lake and Arctic sea ice (medium to high confidence).40 These changes would be larger at 2°C global warming or above than at 1.5°C | high | 2 | train |
49 | AR6_WGI | 40 | 9 | For example, extreme heat thresholds relevant to agriculture and health are projected to be exceeded more frequently at higher global warming levels | high | 2 | train |
50 | AR6_WGI | 40 | 11 | Also, more frequent and/or severe agricultural and ecological droughts are projected in a few regions in all inhabited continents except Asia compared to 1850–1900 (medium confidence); increases in meteorological droughts are also projected in a few regions | medium | 1 | train |
51 | AR6_WGI | 40 | 12 | A small number of regions are projected to experience increases or decreases in mean precipitation | medium | 1 | train |
52 | AR6_WGI | 40 | 14 | Heavy precipitation and associated flooding events are projected to become more intense and frequent in the Pacific Islands and across many regions of North America and Europe (medium to high confidence).40 These changes are also seen in some regions in Australasia and Central and South America | medium | 1 | train |
53 | AR6_WGI | 40 | 16 | A small number of regions in Africa, Australasia, Europe and North America are also projected to be affected by increases in hydrological droughts, and several regions are projected to be affected by increases or decreases in meteorological droughts, with more regions displaying an increase | medium | 1 | train |
54 | AR6_WGI | 40 | 17 | Mean precipitation is projected to increase in all polar, northern European and northern North American regions, most Asian regions and two regions of South America | high | 2 | train |
55 | AR6_WGI | 41 | 1 | Region-specific changes include intensification of tropical cyclones and/or extratropical storms | medium | 1 | train |
56 | AR6_WGI | 41 | 3 | Approximately two-thirds of the global coastline has a projected regional relative sea level rise within ±20% of the global mean increase | medium | 1 | train |
57 | AR6_WGI | 41 | 4 | Due to relative sea level rise, extreme sea level events that occurred once per century in the recent past are projected to occur at least annually at more than half of all tide gauge locations by 2100 | high | 2 | train |
58 | AR6_WGI | 41 | 5 | Relative sea level rise contributes to increases in the frequency and severity of coastal flooding in low-lying areas and to coastal erosion along most sandy coasts | high | 2 | train |
59 | AR6_WGI | 41 | 7 | Urbanization also increases mean and heavy precipitation over and/or downwind of cities (medium confidence) and resulting runoff intensity | high | 2 | train |
60 | AR6_WGI | 41 | 8 | In coastal cities, the combination of more frequent extreme sea level events (due to sea level rise and storm surge) and extreme rainfall/ riverflow events will make flooding more probable | high | 2 | train |
61 | AR6_WGI | 41 | 11 | Concurrent extremes at multiple locations, including in crop-producing areas, become more frequent at 2°C and above compared to 1.5°C global warming | high | 2 | train |
62 | AR6_WGI | 43 | 4 | The probability of low-likelihood, high-impact outcomes increases with higher global warming levels | high | 2 | train |
63 | AR6_WGI | 43 | 5 | Abrupt responses and tipping points of the climate system, such as strongly increased Antarctic ice-sheet melt and forest dieback, cannot be ruled out | high | 2 | train |
64 | AR6_WGI | 45 | 13 | When adjusted for emissions since previous reports, estimates of remaining carbon budgets are therefore of similar magnitude compared to SR1.5 but larger compared to AR5 due to methodological improvements.44 {5.5, Box 5.2, TS.3.3} (Table SPM.2) D.1.4 Anthropogenic CO 2 removal (CDR) has the potential to remove CO 2 from the atmosphere and durably store it in reservoirs | high | 2 | train |
65 | AR6_WGI | 45 | 15 | CDR methods can have potentially wide-ranging effects on biogeochemical cycles and climate, which can either weaken or strengthen the potential of these methods to remove CO 2 and reduce warming, and can also influence water availability and quality, food production and biodiversity45 | high | 2 | train |
66 | AR6_WGI | 46 | 1 | CDR would lower atmospheric CO 2 by an amount approximately equal to the increase from an anthropogenic emission of the same magnitude | high | 2 | train |
67 | AR6_WGI | 46 | 2 | The atmospheric CO 2 decrease from anthropogenic CO 2 removals could be up to 10% less than the atmospheric CO 2 increase from an equal amount of CO 2 emissions, depending on the total amount of CDR | medium | 1 | train |
68 | AR6_WGI | 46 | 4 | For instance, it would take several centuries to millennia for global mean sea level to reverse course even under large net negative CO 2 emissions | high | 2 | train |
69 | AR6_WGI | 46 | 6 | In the long term, this net warming is lower in scenarios assuming air pollution controls combined with strong and sustained CH 4 emissions reductions | high | 2 | train |
70 | AR6_WGI | 46 | 8 | Because of the short lifetime of both CH 4 and aerosols, these climate effects partially counterbalance each other, and reductions in CH 4 emissions also contribute to improved air quality by reducing global surface ozone | high | 2 | train |
71 | AR6_WGI | 46 | 12 | Emissions pathways that reach and sustain net zero GHG emissions defined by the 100-year global warming potential are projected to result in a decline in surface temperature after an earlier peak | high | 2 | train |
72 | AR6_WGI | 46 | 14 | Under these contrasting scenarios, discernible differences in trends of global surface temperature would begin to emerge from natural variability within around 20 years, and over longer time periods for many other climatic impact-drivers | high | 2 | train |
73 | AR6_WGI | 46 | 16 | Global and regional climate responses to this temporary forcing are, however, undetectable above natural variability | high | 2 | train |
74 | AR6_WGI | 46 | 17 | Atmospheric CO 2 concentrations continued to rise in 2020, with no detectable decrease in the observed CO 2 growth rate | medium | 1 | train |
75 | AR6_WGI | 47 | 1 | Scenarios with targeted reductions of air pollutant emissions lead to more rapid improvements in air quality within years compared to reductions in GHG emissions only, but from 2040, further improvements are projected in scenarios that combine efforts to reduce air pollutants as well as GHG emissions, with the magnitude of the benefit varying between regions | high | 2 | train |
76 | AR6_WGI | 47 | 5 | The response of many other climate variables would emerge from natural variability at different times later in the 21st century | high | 2 | train |
77 | AR6_WGI | 47 | 7 | By the end of the century, scenarios with very low and low GHG emissions would strongly limit the change of several CIDs, such as the increases in the frequency of extreme sea level events, heavy precipitation and pluvial flooding, and exceedance of dangerous heat thresholds, while limiting the number of regions where such exceedances occur, relative to higher GHG emissions scenarios | high | 2 | test |
78 | AR6_WGI | 47 | 8 | Changes would also be smaller in very low compared to low GHG emissions scenarios, as well as for intermediate (SSP2-4.5) compared to high or very high GHG emissions scenarios | high | 2 | train |
79 | AR6_WGI | 57 | 25 | Since 2012, strong warming has been observed, with the past five years (2016–2020) being the hottest five- year period in the instrumental record since at least 1850 | high | 2 | train |
80 | AR6_WGI | 62 | 1 | Changes in temperature by latitude in response to multiple forcings show that polar amplification (stronger warming at high latitudes than the global average) is a prominent feature of the climate system across multiple climate states, and the ability of models to simulate this polar amplification in past warm climates has improved since AR5 | high | 2 | train |
81 | AR6_WGI | 62 | 2 | Over the past millennium, and especially since about 1300 CE, simulated global surface temperature anomalies are well within the uncertainty of reconstructions | medium | 1 | test |
82 | AR6_WGI | 62 | 7 | Model uncertainties in (a) and (b) are 5–95% ranges of multi-model ensemble means; reconstructed uncertainties are 5–95% ranges | medium | 1 | train |
83 | AR6_WGI | 62 | 15 | Climate models are able to reproduce decadal drought variability on large regional scales, including the severity, persistence and spatial extent of past megadroughts known from proxy records | medium | 1 | train |
84 | AR6_WGI | 63 | 1 | Although past and future global warming differ in their forcings, evidence from paleoclimate records and modelling show that ice-sheet mass and global mean sea level (GMSL) responded dynamically over multiple millennia | high | 2 | train |
85 | AR6_WGI | 63 | 3 | For example, under a past global warming levels of around [2.5°C to 4°C] relative to 1850–1900, like during the mid-Pliocene Warm Period, sea level was [5 to 25 m] higher than 1900 (medium confidence); under past global warming levels of [10°C to 18°C], like during the Early Eocene, the planet was essentially ice free | high | 2 | train |
86 | AR6_WGI | 63 | 8 | The paleo context supports the assessment that ongoing increase in ocean heat content (OHC) represents a long-term commitment, essentially irreversible on human time scales | high | 2 | test |
87 | AR6_WGI | 63 | 16 | At the same time, the storage of remineralized carbon in the ocean interior increased by as much as 750–950 PgC, sufficient to balance the removal of carbon from the atmosphere (200 PgC) and terrestrial biosphere reservoirs combined | high | 2 | train |
88 | AR6_WGI | 64 | 16 | Increasing horizontal resolution in global climate models improves the representation of small-scale features and the statistics of daily precipitation | high | 2 | train |
89 | AR6_WGI | 64 | 17 | Earth system models, which include additional biogeochemical feedbacks, often perform as well as their lower-complexity global climate model counterparts, which do not account for these additional feedbacks | medium | 1 | train |
90 | AR6_WGI | 64 | 26 | Earth system models, characterized by additional biogeochemical feedbacks, often perform at least as well as related, more constrained, lower-complexity models lacking these feedbacks | medium | 1 | train |
91 | AR6_WGI | 64 | 29 | The CMIP6 models also reproduce surface temperature variations over the past millennium, including the cooling that follows periods of intense volcanism | medium | 1 | train |
92 | AR6_WGI | 65 | 4 | Because a negative cloud optical depth feedback in response to surface warming results from ‘brightening’ of clouds via active phase change from ice to liquid cloud particles (increasing their shortwave cloud radiative effect), the extratropical cloud shortwave feedback in CMIP6 models tends to be less negative, leading to a better agreement with observational estimates | medium | 1 | train |
93 | AR6_WGI | 65 | 7 | Increasing horizontal resolution in global climate models improves the representation of small-scale features and the statistics of daily precipitation | high | 2 | train |
94 | AR6_WGI | 65 | 11 | The overall performance of CMIP6 models in simulating the intensity and frequency of extreme precipitation is similar to that of CMIP5 models | high | 2 | train |
95 | AR6_WGI | 65 | 21 | Models reproduce observed spatial features and variance of the Southern Annular Mode (SAM) and Northern Annular Mode (NAM) very well | high | 2 | train |
96 | AR6_WGI | 65 | 22 | The summertime SAM trend is well captured, with CMIP6 models outperforming CMIP5 models | medium | 1 | train |
97 | AR6_WGI | 65 | 25 | Model performance is limited in reproducing sea surface temperature anomalies for decadal modes of variability, despite improvements from CMIP5 to CMIP6 | medium | 1 | train |
98 | AR6_WGI | 65 | 30 | These higher sensitivity values can, in some models, be traced to changes in extratropical cloud feedbacks | medium | 1 | test |
99 | AR6_WGI | 66 | 12 | The signal of temperature change has emerged more clearly in tropical regions, where year-to-year variations tend to be small over land, than in regions with greater warming but larger year- to-year variations | high | 2 | train |
What do LLMs know about climate? Let's find out!
We introduce the Expert Confidence in Climate Statements (ClimateX) dataset, a novel, curated, expert-labeled, natural language dataset of 8094 statements extracted or paraphrased from the IPCC Assessment Report 6: Working Group I report, Working Group II report, and Working Group III report, respectively.
Each statement is labeled with the corresponding IPCC report source, the page number in the report PDF, and the corresponding confidence level, along with their associated confidence levels (low, medium, high, or very high) as assessed by IPCC climate scientists based on available evidence and agreement among their peers.
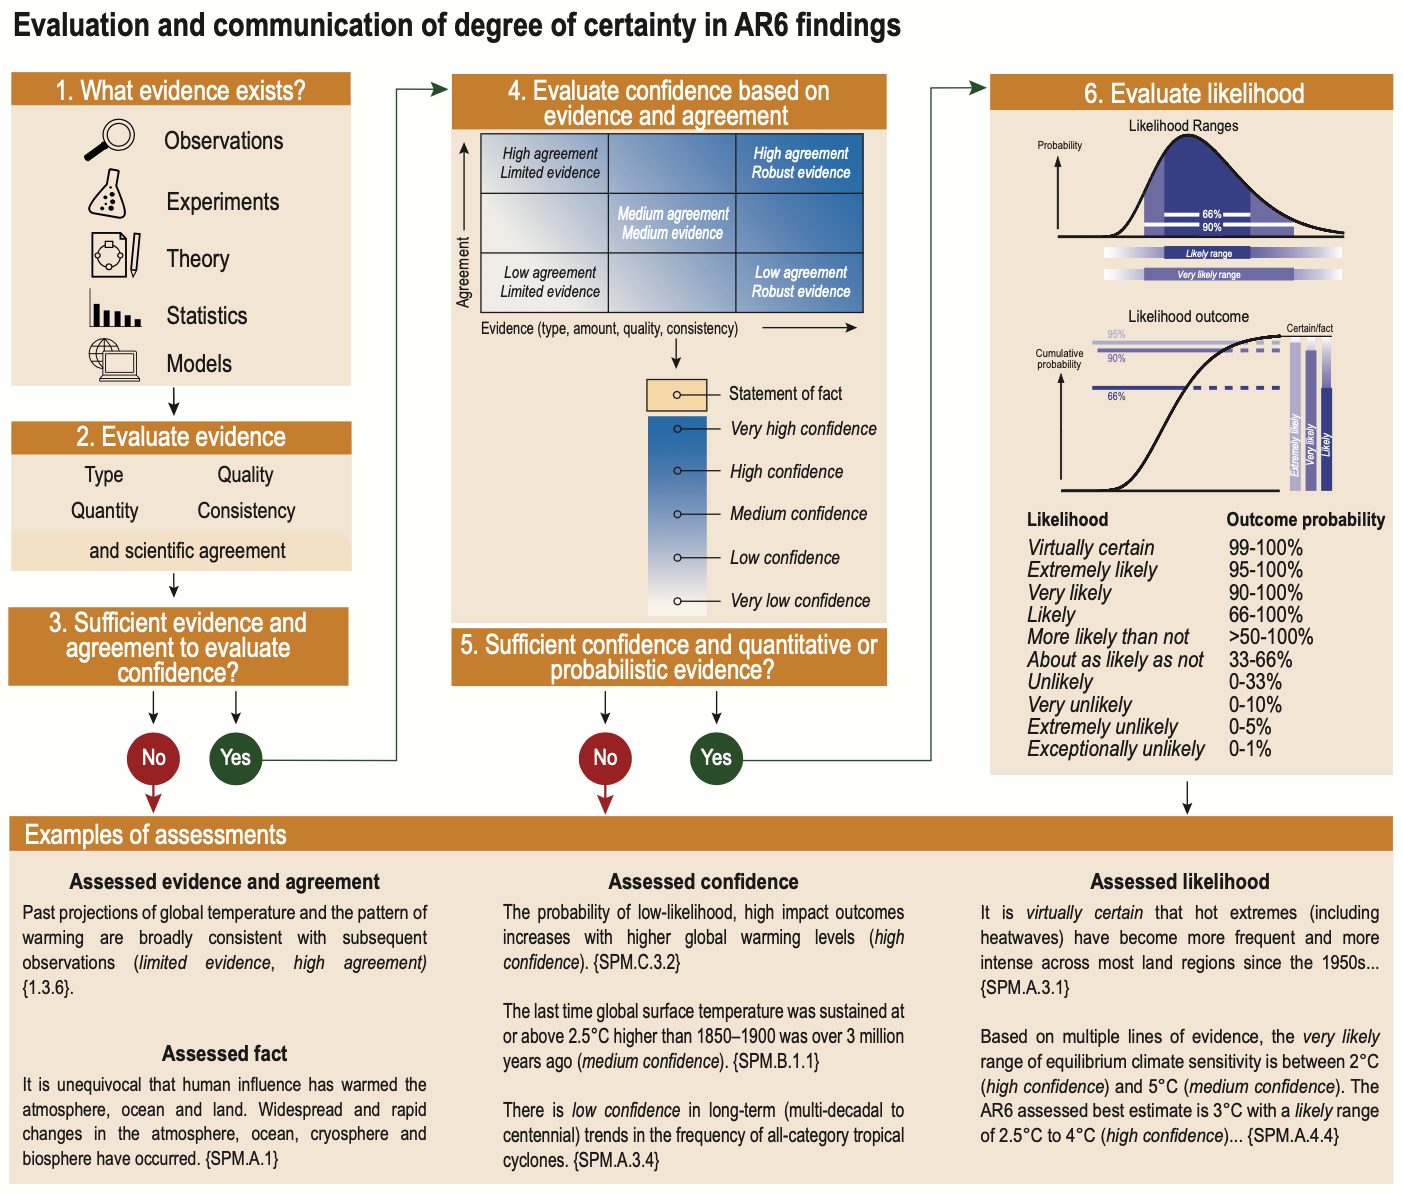
The authors of the United Nations International Panel on Climate Change (IPCC) reports have developed a structured framework to communicate the confidence and uncertainty levels of statements regarding our knowledge of climate change (Mastrandrea, 2010).
Our dataset leverages this distinctive and consistent approach to labelling uncertainty across topics, disciplines, and report chapters, to help NLP and climate communication researchers evaluate how well LLMs can assess human expert confidence in a set of climate science statements from the IPCC reports.
Source: IPCC AR6 Working Group I report
To construct the dataset, we retrieved the complete raw text from each of the three IPCC report PDFs that are available online using an open-source library pypdf2. We then normalized the whitespace, tokenized the text into sentences using NLTK , and used regex search to filter for complete sentences including a parenthetical confidence label at the end of the statement, of the form sentence (low|medium|high|very high confidence). The final ClimateX dataset contains 8094 labeled sentences.
From the full 8094 labeled sentences, we further selected 300 statements to form a smaller and more tractable test dataset. We performed a random selection of sentences within each report and confidence category, with the following objectives:
Then, we manually reviewed and cleaned each sentence in the test set to provide for a fairer assessment of model capacity. We then progamatically cleaned up the train set (removing references and extraneous confidence labels, and explaining acronyms)
The remaining 7794 sentences not allocated to the test split form our train split.
Of note: while the IPCC report uses a 5 levels scale for confidence, almost no very low confidence statement makes it through the peer review process to the final reports, such that no statement of the form sentence (very low confidence) was retrievable. Therefore, we chose to build our data set with only statements labeled as low, medium, high and very high confidence.
The code to reproduce dataset collection and our LLM benchmarking experiments is released on GitHub.