

bartowski/INTELLECT-1-Instruct-GGUF
Text Generation
•
10B
•
Updated
•
19.8k
•
5
url
stringlengths 14
2.42k
| text
stringlengths 100
1.02M
| date
stringlengths 19
19
| metadata
stringlengths 1.06k
1.1k
|
|---|---|---|---|
https://telescoper.wordpress.com/2010/11/23/bayes-and-hi-theorem/ | Bayes and his Theorem
My earlier post on Bayesian probability seems to have generated quite a lot of readers, so this lunchtime I thought I’d add a little bit of background. The previous discussion started from the result
$P(B|AC) = K^{-1}P(B|C)P(A|BC) = K^{-1} P(AB|C)$
where
$K=P(A|C).$
Although this is called Bayes’ theorem, the general form of it as stated here was actually first written down, not by Bayes but by Laplace. What Bayes’ did was derive the special case of this formula for “inverting” the binomial distribution. This distribution gives the probability of x successes in n independent “trials” each having the same probability of success, p; each “trial” has only two possible outcomes (“success” or “failure”). Trials like this are usually called Bernoulli trials, after Daniel Bernoulli. If we ask the question “what is the probability of exactly x successes from the possible n?”, the answer is given by the binomial distribution:
$P_n(x|n,p)= C(n,x) p^x (1-p)^{n-x}$
where
$C(n,x)= n!/x!(n-x)!$
is the number of distinct combinations of x objects that can be drawn from a pool of n.
You can probably see immediately how this arises. The probability of x consecutive successes is p multiplied by itself x times, or px. The probability of (n-x) successive failures is similarly (1-p)n-x. The last two terms basically therefore tell us the probability that we have exactly x successes (since there must be n-x failures). The combinatorial factor in front takes account of the fact that the ordering of successes and failures doesn’t matter.
The binomial distribution applies, for example, to repeated tosses of a coin, in which case p is taken to be 0.5 for a fair coin. A biased coin might have a different value of p, but as long as the tosses are independent the formula still applies. The binomial distribution also applies to problems involving drawing balls from urns: it works exactly if the balls are replaced in the urn after each draw, but it also applies approximately without replacement, as long as the number of draws is much smaller than the number of balls in the urn. I leave it as an exercise to calculate the expectation value of the binomial distribution, but the result is not surprising: E(X)=np. If you toss a fair coin ten times the expectation value for the number of heads is 10 times 0.5, which is five. No surprise there. After another bit of maths, the variance of the distribution can also be found. It is np(1-p).
So this gives us the probability of x given a fixed value of p. Bayes was interested in the inverse of this result, the probability of p given x. In other words, Bayes was interested in the answer to the question “If I perform n independent trials and get x successes, what is the probability distribution of p?”. This is a classic example of inverse reasoning. He got the correct answer, eventually, but by very convoluted reasoning. In my opinion it is quite difficult to justify the name Bayes’ theorem based on what he actually did, although Laplace did specifically acknowledge this contribution when he derived the general result later, which is no doubt why the theorem is always named in Bayes’ honour.
This is not the only example in science where the wrong person’s name is attached to a result or discovery. In fact, it is almost a law of Nature that any theorem that has a name has the wrong name. I propose that this observation should henceforth be known as Coles’ Law.
So who was the mysterious mathematician behind this result? Thomas Bayes was born in 1702, son of Joshua Bayes, who was a Fellow of the Royal Society (FRS) and one of the very first nonconformist ministers to be ordained in England. Thomas was himself ordained and for a while worked with his father in the Presbyterian Meeting House in Leather Lane, near Holborn in London. In 1720 he was a minister in Tunbridge Wells, in Kent. He retired from the church in 1752 and died in 1761. Thomas Bayes didn’t publish a single paper on mathematics in his own name during his lifetime but despite this was elected a Fellow of the Royal Society (FRS) in 1742. Presumably he had Friends of the Right Sort. He did however write a paper on fluxions in 1736, which was published anonymously. This was probably the grounds on which he was elected an FRS.
The paper containing the theorem that now bears his name was published posthumously in the Philosophical Transactions of the Royal Society of London in 1764.
P.S. I understand that the authenticity of the picture is open to question. Whoever it actually is, he looks to me a bit like Laurence Olivier…
11 Responses to “Bayes and his Theorem”
1. Bryn Jones Says:
The Royal Society is providing free access to electronic versions of its journals until the end of this month. Readers of this blog might like to look at Thomas Bayes’s two posthumous publications in the Philosophical Transactions.
The first is a short paper about series. The other is the paper about statistics communicated by Richard Price. (The statistics paper may be accessible on a long-term basis because it is one of the Royal Society’s Trailblazing papers the society provides access to as part of its 350th anniversary celebrations.)
Incidentally, both Thomas Bayes and Richard Price were buried in the Bunhill Fields Cemetery in London and their tombs can be seen there today.
2. Steve Warren Says:
You may be remembered in history as the discoverer of coleslaw, but you weren’t the first.
• Anton Garrett Says:
For years I thought it was “cold slaw” because it was served cold. A good job I never asked for warm slaw.
3. telescoper Says:
My surname, in Spanish, means “Cabbages”. So it was probably one of my ancestors who invented the chopped variety.
4. Anton Garrett Says:
Thomas Bayes is now known to have gone to Edinburgh University, where his name appears in the records. He was barred from English universities because his nonconformist family did not have him baptised in the Church of England. (Charles Darwin’s nonconformist family covered their bets by having baby Charles baptised in the CoE, although perhaps they believed it didn’t count as a baptism since Charles had no say in it. Tist is why he was able to go to Christ’s College, Cambridge.)
5. “Cole” is an old English word for cabbage, which survives in “cole slaw”. The German word is “Kohl”. (Somehow, I don’t see PM or President Cabbage being a realistic possibility. 🙂 )
Note that Old King Cole is unrelated (etymologically). Of course, this discussion could cause Peter to post a clip of
Nat “King” Cole
(guess what his real surname is).
To remind people to pay attention to spelling when they hear words, we’ll close with the Quote of the Day:
It’s important to pay close attention in school. For years I thought that
bears masturbated all winter.
—Damon R. Milhem
6. Of course, this discussion could cause Peter to post a clip of
Nat King Cole
(giess what his real surname is).
7. Of course, this discussion could cause Peter to post a clip of
Nat King Cole
(giess what his real surname is).
The first typo was my fault; the extra linebreaks in the second attempt
(tested again here) appear to be a new “feature”.
8. telescoper Says:
The noun “cole” can be found in English dictionaries as a generic name for plants of the cabbage family. It is related to the German kohl and scottish kail or kale. These are all derived from the latin word colis (or caulis) meaning a stem, which is also the root of the word cauliflower.
The surname “Cole” and the variant “Coles” are fairly common in England and Wales, but are not related to the latin word for cabbage. Both are diminutives of the name “Nicholas”.
9. […] I posted a little piece about Bayesian probability. That one and the others that followed it (here and here) proved to be surprisingly popular so I’ve been planning to add a few more posts […]
10. It already has a popular name: Stigler’s law of eponymy. | 2016-09-28 22:12:05 | {"extraction_info": {"found_math": true, "script_math_tex": 0, "script_math_asciimath": 0, "math_annotations": 0, "math_alttext": 0, "mathml": 0, "mathjax_tag": 0, "mathjax_inline_tex": 0, "mathjax_display_tex": 0, "mathjax_asciimath": 0, "img_math": 4, "codecogs_latex": 0, "wp_latex": 0, "mimetex.cgi": 0, "/images/math/codecogs": 0, "mathtex.cgi": 0, "katex": 0, "math-container": 0, "wp-katex-eq": 0, "align": 0, "equation": 0, "x-ck12": 0, "texerror": 0, "math_score": 0.6193313002586365, "perplexity": 1089.0032368849284}, "config": {"markdown_headings": false, "markdown_code": true, "boilerplate_config": {"ratio_threshold": 0.18, "absolute_threshold": 10, "end_threshold": 15, "enable": true}, "remove_buttons": true, "remove_image_figures": true, "remove_link_clusters": true, "table_config": {"min_rows": 2, "min_cols": 3, "format": "plain"}, "remove_chinese": true, "remove_edit_buttons": true, "extract_latex": true}, "warc_path": "s3://commoncrawl/crawl-data/CC-MAIN-2016-40/segments/1474738661768.10/warc/CC-MAIN-20160924173741-00020-ip-10-143-35-109.ec2.internal.warc.gz"} |
https://www.physicsforums.com/threads/physical-quantity-analogous-to-inductance.691308/ | Physical Quantity Analogous to Inductance
1. May 12, 2013
tapan_ydv
Hi,
I understand that some physical quantities in electromagnetism are analogous to physical quantities in heat transfer. For instance, electric field is analogous to temperature gradient.
I want to know which physical quantity in heat transfer is analogous to Inductance ("L") ?
Regards,
2. May 12, 2013
tiny-tim
welcome to pf!
hi tapan_ydv! welcome to pf!
i don't know about a heat transfer analogy,
but a hydraulics analogy is a paddle-wheel
A heavy paddle wheel placed in the current. The mass of the wheel and the size of the blades restrict the water's ability to rapidly change its rate of flow (current) through the wheel due to the effects of inertia, but, given time, a constant flowing stream will pass mostly unimpeded through the wheel, as it turns at the same speed as the water flow …
(from http://en.wikipedia.org/wiki/Hydraulic_analogy#Component_equivalents )
3. May 12, 2013
technician
In mechanics.....inertia
4. May 12, 2013
tiny-tim
how?
5. May 12, 2013
technician
Reluctance to change...as in a paddle wheel.
Last edited: May 12, 2013 | 2018-03-25 03:47:16 | {"extraction_info": {"found_math": false, "script_math_tex": 0, "script_math_asciimath": 0, "math_annotations": 0, "math_alttext": 0, "mathml": 0, "mathjax_tag": 0, "mathjax_inline_tex": 0, "mathjax_display_tex": 0, "mathjax_asciimath": 0, "img_math": 0, "codecogs_latex": 0, "wp_latex": 0, "mimetex.cgi": 0, "/images/math/codecogs": 0, "mathtex.cgi": 0, "katex": 0, "math-container": 0, "wp-katex-eq": 0, "align": 0, "equation": 0, "x-ck12": 0, "texerror": 0, "math_score": 0.8782012462615967, "perplexity": 2018.39232950813}, "config": {"markdown_headings": false, "markdown_code": true, "boilerplate_config": {"ratio_threshold": 0.18, "absolute_threshold": 20, "end_threshold": 15, "enable": true}, "remove_buttons": true, "remove_image_figures": true, "remove_link_clusters": true, "table_config": {"min_rows": 2, "min_cols": 3, "format": "plain"}, "remove_chinese": true, "remove_edit_buttons": true, "extract_latex": true}, "warc_path": "s3://commoncrawl/crawl-data/CC-MAIN-2018-13/segments/1521257651780.99/warc/CC-MAIN-20180325025050-20180325045050-00464.warc.gz"} |
https://docs.microej.com/en/latest/ApplicationDeveloperGuide/testsuiteEngine.html | # MicroEJ Test Suite Engine
## Introduction
The MicroEJ Test Suite Engine is a generic tool made for validating any development project using automatic testing.
This section details advanced configuration for users who wish to integrate custom test suites in their build flow.
The MicroEJ Test Suite Engine allows the user to test any kind of projects within the configuration of a generic Ant file.
The MicroEJ Test Suite Engine is already pre-configured for running test suites on a MicroEJ Platform (either on Simulator or on Device).
## Using the MicroEJ Test Suite Ant Tasks
Multiple Ant tasks are available in the testsuite-engine.jar provided in the Build Kit:
• testsuite allows the user to run a given test suite and to retrieve an XML report document in a JUnit format.
• javaTestsuite is a subtask of the testsuite task, used to run a specialized test suite for Java (will only run Java classes).
• htmlReport is a task which will generate an HTML report from a list of JUnit report files.
### The testsuite Task
The following attributes are mandatory:
testsuite task mandatory attributes
Attribute Name Description
outputDir The output folder of the test suite. The final report will be generated at [outputDir]/[label]/[reportName].xml, see the testsuiteReportFileProperty and testsuiteReportDirProperty attributes.
harnessScript The harness script must be an Ant script and it is the script which will be called for each test by the test suite engine. It is called with a basedir located at output location of the current test.
The test suite engine provides the following properties to the harness script giving all the informations to start the test:
harnessScript properties
Attribute Name Description
testsuite.test.name The output name of the current test in the report. Default value is the relative path of the test. It can be manually set by the user. More details on the output name are available in the section Specific Custom Properties.
testsuite.test.path The current test absolute path in the filesystem.
testsuite.test.properties The absolute path to the custom properties of the current test (see the property customPropertiesExtension)
testsuite.common.properties The absolute path to the common properties of all the tests (see the property commonProperties)
testsuite.report.dir The absolute path to the directory of the final report.
The following attributes are optional:
testsuite task optional attributes
Attribute Name Description Default value
timeOut The time in seconds before any test is considerated as unknown. Set it to 0 to disable the time-out. 60
verboseLevel The required level to output messages from the test suite. Can be one of those values: error, warning, info, verbose, debug. info
reportName The final report name (without extension). testsuite-report
customPropertiesExtension The extension of the custom properties for each test. For instance, if it is set to .options, a test named xxx/Test1.class will be associated with xxx/Test1.options. If a file exists for a test, the property testsuite.test.properties is set with its absolute path and given to the harnessScript. If the test path references a directory, then the custom properties path is the concatenation of the test path and the customPropertiesExtension value. .properties
commonProperties The properties to apply to every test of the test suite. Those options might be overridden by the custom properties of each test. If this option is set and the file exists, the property testsuite.common.properties is set to the absolute path of the harnessScript file. no common properties
label The build label. timestamp of when the test suite was invoked.
productName The name of the current tested product. TestSuite
jvm The location of your Java VM to start the test suite (the harnessScript is called as is: [jvm] [...] -buildfile [harnessScript]). java.home location if the property is set, java otherwise.
jvmargs The arguments to pass to the Java VM started for each test. None.
testsuiteReportFileProperty The name of the Ant property in which the path of the final report is stored. Path is [outputDir]/[label]/[reportName].xml testsuite.report.file
testsuiteReportDirProperty The name of the Ant property in which is store the path of the directory of the final report. Path is [outputDir]/[label]. testsuite.report.dir
testsuiteResultProperty The name of the Ant property in which you want to have the result of the test suite (true or false), depending if every tests successfully passed the test suite or not. Ignored tests do not affect this result. None
Finally, you have to give as nested element the path containing the tests.
testsuite task nested elements
Element Name Description
testPath Containing all the file of the tests which will be launched by the test suite.
testIgnoredPath (optional) Any test in the intersection between testIgnoredPath and testPath will be executed by the test suite, but will not appear in the JUnit final report. It will still generate a JUnit report for each test, which will allow the HTML report to let them appears as “ignored” if it is generated. Mostly used for known bugs which are not considered as failure but still relevant enough to appears on the HTML report.
Example of test suite task invocation
<!-- Launch the testusite engine -->
<testsuite:testsuite
timeOut="${microej.kf.testsuite.timeout}" outputDir="${target.test.xml}/testkf"
harnessScript="${com.is2t.easyant.plugins#microej-kf-testsuite.microej-kf-testsuite-harness-jpf-emb.xml.file}" commonProperties="${microej.kf.launch.propertyfile}"
testsuiteResultProperty="testkf.result"
testsuiteReportDirProperty="testkf.testsuite.report.dir"
productName="${module.name} testkf" jvmArgs="${microej.kf.testsuite.jvmArgs}"
lockPort="${microej.kf.testsuite.lockPort}" verboseLevel="${testkf.verbose.level}"
>
<testPath refid="target.testkf.path"/>
</testsuite:testsuite>
### The javaTestsuite Task
This task extends the testsuite task, specializing the test suite to only start real Java class. This task retrieves the classname of the tests from the classfile and provides new properties to the harness script:
javaTestsuite task properties
Property Name Description
testsuite.test.class The classname of the current test. The value of the property testsuite.test.name is also set to the classname of the current test.
testsuite.test.classpath The classpath of the current test.
<!-- Launch test suite -->
<testsuite:javaTestsuite
verboseLevel="${microej.testsuite.verboseLevel}" timeOut="${microej.testsuite.timeout}"
outputDir="${target.test.xml}/@{prefix}" harnessScript="${harness.file}"
commonProperties="${microej.launch.propertyfile}" testsuiteResultProperty="@{prefix}.result" testsuiteReportDirProperty="@{prefix}.testsuite.report.dir" productName="${module.name} @{prefix}"
jvmArgs="${microej.testsuite.jvmArgs}" lockPort="${microej.testsuite.lockPort}"
retryCount="${microej.testsuite.retry.count}" retryIf="${microej.testsuite.retry.if}"
retryUnless="${microej.testsuite.retry.unless}" > <testPath refid="target.@{prefix}.path"/> <testIgnoredPath refid="tests.@{prefix}.ignored.path" /> </testsuite:javaTestsuite> ### The htmlReport Task¶ This task allow the user to transform a given path containing a sample of JUnit reports to an HTML detailed report. Here is the attributes to fill: • A nested fileset element containing all the JUnit reports of each test. Take care to exclude the final JUnit report generated by the test suite. • A nested element report: • format: The format of the generated HTML report. Must be noframes or frames. When noframes format is choosen, a standalone HTML file is generated. • todir: The output folder of your HTML report. • The report tag accepts the nested tag param with name and expression attributes. These tags can pass XSL parameters to the stylesheet. The built-in stylesheets support the following parameters: • PRODUCT: the product name that is displayed in the title of the HTML report. • TITLE: the comment that is displayed in the title of the HTML report. Note It is advised to set the format to noframes if your test suite is not a Java test suite. If the format is set to frames, with a non-Java MicroEJ Test Suite, the name of the links will not be relevant because of the non-existency of packages. Example of htmlReport task invocation <!-- Generate HTML report --> <testsuite:htmlReport> <fileset dir="${@{prefix}.testsuite.report.dir}">
<include name="**/*.xml"/> <!-- include unary reports -->
<exclude name="**/bin/**/*.xml"/> <!-- exclude test bin files -->
<exclude name="*.xml"/> <!-- exclude global report -->
</fileset>
<report format="noframes" todir="\${target.test.html}/@{prefix}"/>
</testsuite:htmlReport>
## Using the Trace Analyzer
This section will shortly explains how to use the Trace Analyzer. The MicroEJ Test Suite comes with an archive containing the Trace Analyzer which can be used to analyze the output trace of an application. It can be used from different forms;
• The FileTraceAnalyzer will analyze a file and research for the given tags, failing if the success tag is not found.
• The SerialTraceAnalyzer will analyze the data from a serial connection.
Here is the common options to all TraceAnalyzer tasks:
• successTag: the regular expression which is synonym of success when found (by default .*PASSED.*).
• failureTag: the regular expression which is synonym of failure when found (by default .*FAILED.*).
• verboseLevel: int value between 0 and 9 to define the verbose level.
• waitingTimeAfterSuccess: waiting time (in s) after success before closing the stream (by default 5).
• noActivityTimeout: timeout (in s) with no activity on the stream before closing the stream. Set it to 0 to disable timeout (default value is 0).
• stopEOFReached: boolean value. Set to true to stop analyzing when input stream EOF is reached. If false, continue until timeout is reached (by default false).
• onlyPrintableCharacters: boolean value. Set to true to only dump ASCII printable characters (by default false).
Here is the specific options of the FileTraceAnalyzer task:
• traceFile: path to the file to analyze.
Here is the specific options of the SerialTraceAnalyzer task:
• port: the comm port to open.
• baudrate: serial baudrate (by default 9600).
• databits: databits (5|6|7|8) (by default 8).
• stopBits: stopbits (0|1|3 for (1_5)) (by default 1).
• parity: none | odd | event (by default none).
## Appendix
The goal of this section is to explain some tips and tricks that might be useful in your usage of the test suite engine.
### Specific Custom Properties
Some custom properties are specifics and retrieved from the test suite engine in the custom properties file of a test.
• The testsuite.test.name property is the output name of the current test. Here are the steps to compute the output name of a test:
• If the custom properties are enabled and a property named testsuite.test.name is find on the corresponding file, then the output name of the current test will be set to it.
• Otherwise, if the running MicroEJ Test Suite is a Java test suite, the output name is set to the class name of the test.
• Otherwise, from the path containing all the tests, a common prefix will be retrieved. The output name will be set to the relative path of the current test from this common prefix. If the common prefix equals the name of the test, then the output name will be set to the name of the test.
• Finally, if multiples tests have the same output name, then the current name will be followed by _XXX, an underscore and an integer.
• The testsuite.test.timeout property allow the user to redefine the time out for each test. If it is negative or not an integer, then global timeout defined for the MicroEJ Test Suite is used. | 2021-10-16 06:03:46 | {"extraction_info": {"found_math": true, "script_math_tex": 0, "script_math_asciimath": 0, "math_annotations": 0, "math_alttext": 0, "mathml": 0, "mathjax_tag": 0, "mathjax_inline_tex": 1, "mathjax_display_tex": 0, "mathjax_asciimath": 1, "img_math": 0, "codecogs_latex": 0, "wp_latex": 0, "mimetex.cgi": 0, "/images/math/codecogs": 0, "mathtex.cgi": 0, "katex": 0, "math-container": 0, "wp-katex-eq": 0, "align": 0, "equation": 0, "x-ck12": 0, "texerror": 0, "math_score": 0.26926159858703613, "perplexity": 3266.692339823195}, "config": {"markdown_headings": true, "markdown_code": true, "boilerplate_config": {"ratio_threshold": 0.18, "absolute_threshold": 10, "end_threshold": 15, "enable": true}, "remove_buttons": true, "remove_image_figures": true, "remove_link_clusters": true, "table_config": {"min_rows": 2, "min_cols": 3, "format": "plain"}, "remove_chinese": true, "remove_edit_buttons": true, "extract_latex": true}, "warc_path": "s3://commoncrawl/crawl-data/CC-MAIN-2021-43/segments/1634323583423.96/warc/CC-MAIN-20211016043926-20211016073926-00486.warc.gz"} |
https://www.biostars.org/p/57152/ | T-Test In R On Microarray Data
3
1
Entering edit mode
10.4 years ago
Diana ▴ 900
Hello everyone,
I'm trying to do a simple t-test on my microarray sample in R. My sample looks like this:
gene_id gene sample_1 value_1 sample_2 value_2
XLOC_000001 LOC425783 Renal 20.8152 Heart 14.0945
XLOC_000002 GOLGB1 Renal 10.488 Heart 8.89434
So the t-test is between sample 1 and sample 2 and my code looks like this:
ttestfun = function(x) t.test(x[4], x[6])$p.value p.value = apply(expression_data, 1, ttestfun) It gives me the following error: Error in t.test.default(x[6], x[8]) : not enough 'x' observations In addition: Warning message: In mean.default(x) : argument is not numeric or logical: returning NA What am I doing wrong? Please help. Many thanks. r microarray • 15k views ADD COMMENT 8 Entering edit mode Nag your supervisor to provide some more arrays and allow you to run the experiment again. The arguments to convince him or her are possibly that: • a nonreplicated experiment does not meet the standards of research in the field (does it in any field?) • the data will therefore not be publishable • the money and time invested in the first screen will therefore be wasted ADD REPLY 3 Entering edit mode +1 because I can't give +2 or more. ADD REPLY 9 Entering edit mode 10.4 years ago I think there's some misconceptions operating here from the original questioner. First and foremost, a t-test is not just a way of calculating p-values, it is a statistical test to determine whether two populations have varying means. The p-value that results from the test is a useful indicator for whether or not to support your null hypothesis (that the two populations have the same mean), but is not the purpose of the test. In order to carry out a t-test between two populations, you need to know two things about those populations: 1) the mean of the observations and 2) the variance about that mean. The single value you have for each population could be a proxy for the mean (although it is a particularly bad one - see below), but there is no way that you can know the variance from only one observation. This is why replicates are required for microarray analysis, not a nice optional extra. The reason a single observation on a single microarray is a bad proxy for the population mean is because you have no way of knowing whether the individual tested is typical for the population concerned. Assuming the expression of a given gene is normally distributed among your population (and this is an assumption that you have to make in order for the t-test to be a valid test anyway), your single individual could come from anywhere on the bell curve. Yes, it is most likely that the observation is somewhere near the mean (by definition, ~68% within 1 standard deviation, see the graph), but there is a significant chance that it could have come from either extreme. Finally, I've read what you suggest about the hypergeometric test in relation to RNA-Seq data recently, but again the use of this test is based on a flawed assumption (that the variance of a gene between the 2 populations is equivalent to the population variance). Picking a random statistical test out of the bag, just because it is able to give you a p-value in your particular circumstance is almost universally bad practise. You need to be able to justify it in light of the assumptions you are making in order to apply the test. BTW, your data does not look like it is in log2 scale (if it is, there's an ~32-fold difference between the renal and heart observations for the first gene above) - how have you got the data into R & normalised it? ADD COMMENT 0 Entering edit mode +1 excellent explaination for beginners ADD REPLY 3 Entering edit mode 10.4 years ago It looks like you are trying to do a t-test with one value per group. That is a statistical impossibility (hence, the "not enough 'x' observations" error). Your only real option is to calculate a fold-change between the two samples by calculating a ratio. expression_data$ratio = expression_data[,3]-expression_data[,5] # assumes log scaled data
You can choose 2-fold changed genes by:
expression_data_filtered = expression_data[abs(expression_data$ratio)>2,] After you obtain replicates, you will want to use limma for gene expression analysis. Unmoderated t-tests are probably not the best way to go. ADD COMMENT 0 Entering edit mode Thank you so much Ben and Sean. Actually I'm trying to answer which of the genes are differentially expressed between these two samples and these are the only values I have. I don't have replicate experiments. Basically I want to associate some kind of significance to the differential expression and I thought calculating p-values would do that and hence the t-test. So there's no way I can calculate p-value for each gene with this data? ADD REPLY 3 Entering edit mode Hi, Diana. Unfortunately there is no way a statistical test can be performed without replication. The only option you have to compute p-values is to repeat the experiment. ADD REPLY 0 Entering edit mode Your interpretation is correct--no p-values with the data that you have in hand. ADD REPLY 0 Entering edit mode I don't know if this is a stupid question again, but someone whose working on such data suggested to me that a hypergeometric test can be done with only these values in hand. I wanted to confirm before I embarked on a useless journey. What do you all think? ADD REPLY 0 Entering edit mode How would you apply that test? ADD REPLY 0 Entering edit mode The hypergeometric distribution is used for the analysis of overlaps of gene sets, e.g. given 2 gene sets selected by some arbitrary choice, what is the probability that 100 or more out of the 1000 genes in each set are common to both both. That doesn't fit because you cannot make sensible gene sets yet. ADD REPLY 0 Entering edit mode Another point. The way you are approaching your problem is detrimental to the solution. Instead of responding by picking some random methods which you seemingly don't understand, you should: - respond to our proposal to replicate the experiment (what did your boss say about replication?) - try to understand how tests work ADD REPLY 0 Entering edit mode Thanks. No replicates for now. Maybe in near future. ADD REPLY 2 Entering edit mode 10.4 years ago Ben ★ 2.0k You are applying the t-test to the 4th and 6th value in each row; firstly R doesn't use zero-indexing so you don't seem to have a 6th column and secondly you are comparing two single values each time. For an (unpaired) t-test comparing expression_data$value_1 and expression_data$value_2 try: t.test(expression_data[,3], expression_data[,5])$p.value
edit: of course it's probably more useful to keep the whole returned list than just the p-value
0
Entering edit mode
Thanks a lot. I want to put all pairwise p-values in one object. When I try to use a loop, it gives me the same error again.
for(i in 1:38620)
{
u = t.test(expression_data[i,3], expression_data[i,5])
}
Error in t.test.default(RNA[i, 3], RNA[i, 5]) : not enough 'x' observations
What's wrong with my loop?
3
Entering edit mode
Again, you're trying to perform a t-test on two values... I think you need to look at what a t-test is and think about what you're trying to find from this data. You likely just want to add paired=T to the code I gave you above. See ?t.test in R too.
0
Entering edit mode
I need to do a t-test for each gene and I will be using two values for comparison. My question is: how can I do the pairwise t-test for each of the two values quickly...I was thinking a loop but its giving me an error. I don't want to do a t-test for each gene individually because I have a lot of genes
0
Entering edit mode
As Ben and I point out, you cannot perform a t-test between groups with only 1 member in them. As an aside, using a for-loop like this in R is usually not the best way to go. See the "apply" function for a better approach (can be orders-of-magnitude faster than a for loop). | 2023-04-02 02:31:46 | {"extraction_info": {"found_math": true, "script_math_tex": 0, "script_math_asciimath": 0, "math_annotations": 0, "math_alttext": 0, "mathml": 0, "mathjax_tag": 0, "mathjax_inline_tex": 1, "mathjax_display_tex": 0, "mathjax_asciimath": 1, "img_math": 0, "codecogs_latex": 0, "wp_latex": 0, "mimetex.cgi": 0, "/images/math/codecogs": 0, "mathtex.cgi": 0, "katex": 0, "math-container": 0, "wp-katex-eq": 0, "align": 0, "equation": 0, "x-ck12": 0, "texerror": 0, "math_score": 0.3696608543395996, "perplexity": 2290.7514236553943}, "config": {"markdown_headings": true, "markdown_code": true, "boilerplate_config": {"ratio_threshold": 0.18, "absolute_threshold": 10, "end_threshold": 15, "enable": true}, "remove_buttons": true, "remove_image_figures": true, "remove_link_clusters": true, "table_config": {"min_rows": 2, "min_cols": 3, "format": "plain"}, "remove_chinese": true, "remove_edit_buttons": true, "extract_latex": true}, "warc_path": "s3://commoncrawl/crawl-data/CC-MAIN-2023-14/segments/1679296950373.88/warc/CC-MAIN-20230402012805-20230402042805-00763.warc.gz"} |
https://www.scootersoftware.com/vbulletin/showthread.php?11869-how-to-compare-multiple-files&p=39716 | # Thread: how to compare multiple files?
1. Visitor
Join Date
Jun 2013
Posts
4
## how to compare multiple files?
hi,
I dont have much exp with BC 3 and scripting, i would like to build script to compare four files for example:
scenario1:
file 1: \\server1\folder1\text.txt
file 2: \\server2\folder1\text.txt
scenario2:
file 3: \\server3\folder1\text.txt
file 4: \\server4\folder1\text.txt
ofc, I would like to have these two comparisons done in the same time.
2. Team Scooter
Join Date
Oct 2007
Location
Posts
11,375
Hello,
Would you like to generate a report comparing file1 to file2, then generate a 2nd report comparing file3 to file4?
This can be done in scripting using the command line:
bcompare.exe "@c:\bcscript.txt"
Then the script file example could be:
[CODE]
text-report layout:side-by-side output-to:"c:bcreport1.html" output-options:html-color "\\server1\folder1\text.txt" "\\server2\folder1\text.txt"
text-report layout:side-by-side output-to:"c:bcreport2.html" output-options:html-color "\\server3\folder1\text.txt" "\\server4\folder1\text.txt"
Scripting actions follow the general actions you can perform in the graphical interface. Could you provide more details on the steps you are following in the interface and the reports you are generating from there? We can then help with the script to follow similar steps.
3. Visitor
Join Date
Jun 2013
Posts
4
would it be possible to have output in one file instead of multiple files? for example:
bcreport.html
also, where exactly output file bcreport.html will be saved?
4. Visitor
Join Date
Jun 2013
Posts
4
also, would it be possible to note only file differences (if any)?
5. Team Scooter
Join Date
Oct 2007
Location
Posts
11,375
It is not possible to have a single HTML report file for multiple text comparisons unless you open a folder compare, select the multiple files you want to compare, then generate the report. If you pass in pairs of files on the command line, we do not support appended reports together.
Code:
log verbose "c:\bclog.txt"
criteria rules-based
expand all
select diff.files
text-report layout:side-by-side options:display-mismatches output-to:"c:\bcreport.html" output-options:html-color
For a plain text report, you could append them together using a batch file:
Code:
bcompare.exe "@c:\script.txt" "c:\file1" "c:\file2"
type tempReport.txt >> mainreport.txt
bcompare.exe "@c:\script.txt" "c:\file3" "c:\file4"
type tempReport.txt >> mainreport.txt
Where script.txt is
Code:
text-report layout:side-by-side options:display-mismatches output-to:"c:\tempReport.txt" "%1" "%2"
6. Team Scooter
Join Date
Oct 2007
Location
Posts
11,375
To show only differences, add the "options:display-mismatches" parameter to the text-report command. Detailed documentation can be found in the Help file -> Scripting Reference, or in the Help file -> Using Beyond Compare -> Automating with Script chapter.
7. Visitor
Join Date
Jun 2013
Posts
4
thank you, this was very useful! | 2018-02-21 03:33:45 | {"extraction_info": {"found_math": true, "script_math_tex": 0, "script_math_asciimath": 0, "math_annotations": 0, "math_alttext": 0, "mathml": 0, "mathjax_tag": 0, "mathjax_inline_tex": 0, "mathjax_display_tex": 0, "mathjax_asciimath": 1, "img_math": 0, "codecogs_latex": 0, "wp_latex": 0, "mimetex.cgi": 0, "/images/math/codecogs": 0, "mathtex.cgi": 0, "katex": 0, "math-container": 0, "wp-katex-eq": 0, "align": 0, "equation": 0, "x-ck12": 0, "texerror": 0, "math_score": 0.21669554710388184, "perplexity": 13077.311894654757}, "config": {"markdown_headings": true, "markdown_code": true, "boilerplate_config": {"ratio_threshold": 0.18, "absolute_threshold": 10, "end_threshold": 15, "enable": true}, "remove_buttons": true, "remove_image_figures": true, "remove_link_clusters": true, "table_config": {"min_rows": 2, "min_cols": 3, "format": "plain"}, "remove_chinese": true, "remove_edit_buttons": true, "extract_latex": true}, "warc_path": "s3://commoncrawl/crawl-data/CC-MAIN-2018-09/segments/1518891813322.19/warc/CC-MAIN-20180221024420-20180221044420-00151.warc.gz"} |
http://www.self.gutenberg.org/articles/eng/Sampling_distribution | #jsDisabledContent { display:none; } My Account | Register | Help
# Sampling distribution
Article Id: WHEBN0000520670
Reproduction Date:
Title: Sampling distribution Author: World Heritage Encyclopedia Language: English Subject: Collection: Statistical Theory Publisher: World Heritage Encyclopedia Publication Date:
### Sampling distribution
In statistics a sampling distribution or finite-sample distribution is the probability distribution of a given statistic based on a random sample. Sampling distributions are important in statistics because they provide a major simplification en route to statistical inference. More specifically, they allow analytical considerations to be based on the sampling distribution of a statistic, rather than on the joint probability distribution of all the individual sample values.
## Contents
• Introduction 1
• Standard error 2
• Examples 3
• Statistical inference 4
• References 5
## Introduction
The sampling distribution of a statistic is the distribution of that statistic, considered as a random variable, when derived from a random sample of size n. It may be considered as the distribution of the statistic for all possible samples from the same population of a given size. The sampling distribution depends on the underlying distribution of the population, the statistic being considered, the sampling procedure employed, and the sample size used. There is often considerable interest in whether the sampling distribution can be approximated by an asymptotic distribution, which corresponds to the limiting case either as the number of random samples of finite size, taken from an infinite population and used to produce the distribution, tends to infinity, or when just one equally-infinite-size "sample" is taken of that same population.
For example, consider a normal population with mean μ and variance σ². Assume we repeatedly take samples of a given size from this population and calculate the arithmetic mean \scriptstyle \bar x for each sample – this statistic is called the sample mean. Each sample has its own average value, and the distribution of these averages is called the "sampling distribution of the sample mean". This distribution is normal \scriptstyle \mathcal{N}(\mu,\, \sigma^2/n) (n is the sample size) since the underlying population is normal, although sampling distributions may also often be close to normal even when the population distribution is not (see central limit theorem). An alternative to the sample mean is the sample median. When calculated from the same population, it has a different sampling distribution to that of the mean and is generally not normal (but it may be close for large sample sizes).
The mean of a sample from a population having a normal distribution is an example of a simple statistic taken from one of the simplest statistical populations. For other statistics and other populations the formulas are more complicated, and often they don't exist in closed-form. In such cases the sampling distributions may be approximated through Monte-Carlo simulations[1][p. 2], bootstrap methods, or asymptotic distribution theory.
## Standard error
The standard deviation of the sampling distribution of a statistic is referred to as the standard error of that quantity. For the case where the statistic is the sample mean, and samples are uncorrelated, the standard error is:
\sigma_{\bar x} = \frac{\sigma}{\sqrt{n}}
where \sigma is the standard deviation of the population distribution of that quantity and n is the sample size (number of items in the sample).
An important implication of this formula is that the sample size must be quadrupled (multiplied by 4) to achieve half (1/2) the measurement error. When designing statistical studies where cost is a factor, this may have a role in understanding cost–benefit tradeoffs.
## Examples
Population Statistic Sampling distribution
Normal: \mathcal{N}(\mu, \sigma^2) Sample mean \bar X from samples of size n \bar X \sim \mathcal{N}\Big(\mu,\, \frac{\sigma^2}{n} \Big)
Bernoulli: \operatorname{Bernoulli}(p) Sample proportion of "successful trials" \bar X n \bar X \sim \operatorname{Binomial}(n, p)
Two independent normal populations:
\mathcal{N}(\mu_1, \sigma_1^2) and \mathcal{N}(\mu_2, \sigma_2^2)
Difference between sample means, \bar X_1 - \bar X_2 \bar X_1 - \bar X_2 \sim \mathcal{N}\! \left(\mu_1 - \mu_2,\, \frac{\sigma_1^2}{n_1} + \frac{\sigma_2^2}{n_2} \right)
Any absolutely continuous distribution F with density ƒ Median X_{(k)} from a sample of size n = 2k − 1, where sample is ordered X_{(1)} to X_{(n)} f_{X_{(k)}}(x) = \frac{(2k-1)!}{(k-1)!^2}f(x)\Big(F(x)(1-F(x))\Big)^{k-1}
Any distribution with distribution function F Maximum M=\max\ X_k from a random sample of size n F_M(x) = P(M\le x) = \prod P(X_k\le x)= \left(F(x)\right)^n
## Statistical inference
In the theory of statistical inference, the idea of a sufficient statistic provides the basis of choosing a statistic (as a function of the sample data points) in such a way that no information is lost by replacing the full probabilistic description of the sample with the sampling distribution of the selected statistic.
In frequentist inference, for example in the development of a statistical hypothesis test or a confidence interval, the availability of the sampling distribution of a statistic (or an approximation to this in the form of an asymptotic distribution) can allow the ready formulation of such procedures, whereas the development of procedures starting from the joint distribution of the sample would be less straightforward.
In Bayesian inference, when the sampling distribution of a statistic is available, one can consider replacing the final outcome of such procedures, specifically the conditional distributions of any unknown quantities given the sample data, by the conditional distributions of any unknown quantities given selected sample statistics. Such a procedure would involve the sampling distribution of the statistics. The results would be identical provided the statistics chosen are jointly sufficient statistics.
## References
1. ^
• Merberg, A. and S.J. Miller (2008). "The Sample Distribution of the Median". Course Notes for Math 162: Mathematical Statistics, on the web at http://web.williams.edu/Mathematics/sjmiller/public_html/BrownClasses/162/Handouts/MedianThm04.pdf pgs 1–9. | 2020-08-10 05:32:56 | {"extraction_info": {"found_math": false, "script_math_tex": 0, "script_math_asciimath": 0, "math_annotations": 0, "math_alttext": 0, "mathml": 0, "mathjax_tag": 0, "mathjax_inline_tex": 0, "mathjax_display_tex": 0, "mathjax_asciimath": 0, "img_math": 0, "codecogs_latex": 0, "wp_latex": 0, "mimetex.cgi": 0, "/images/math/codecogs": 0, "mathtex.cgi": 0, "katex": 0, "math-container": 0, "wp-katex-eq": 0, "align": 0, "equation": 0, "x-ck12": 0, "texerror": 0, "math_score": 0.90926194190979, "perplexity": 696.0688358784275}, "config": {"markdown_headings": true, "markdown_code": true, "boilerplate_config": {"ratio_threshold": 0.18, "absolute_threshold": 10, "end_threshold": 15, "enable": true}, "remove_buttons": true, "remove_image_figures": true, "remove_link_clusters": true, "table_config": {"min_rows": 2, "min_cols": 3, "format": "plain"}, "remove_chinese": true, "remove_edit_buttons": true, "extract_latex": true}, "warc_path": "s3://commoncrawl/crawl-data/CC-MAIN-2020-34/segments/1596439738609.73/warc/CC-MAIN-20200810042140-20200810072140-00013.warc.gz"} |
https://kimsereylam.com/azure/2017/07/22/conemu-a-better-command-prompt-for-windows.html | By Kimserey Lam with
# Conemu A Better Command Prompt For Windows
Jul 22nd, 2017 - written by Kimserey with .
When developing multiple Web api under multiple Visual Studio solutions, it can become very tedious to maintain, run and debug. Opening multiple instances of Visual Studio is very costly in term of memory and running all at once also clutter the screen which rapidly becomes irritating. With the advent of dotnet CLI tools, it has been clear that the next step would be to move out of the common “right click/build, F5” of Visual Studio and toward “dotnet run” on a command prompt. Last month I was looking for a Windows alternative of the bash terminal which can be found on Mac and I found ConEmu. ConEmu provides access to all typical shells via an enhanced UI. Today we will see how we can use ConEmu to ease our development process by leveraging only 2 of its features; the tasks and environment setup.
1. dotnet CLI
2. Setup environment
4. Apply to multiple services
## 1. dotnet CLI
We can start first by getting ConEmu from the repository releases https://github.com/Maximus5/ConEmu/releases. From now we can start straight using ConEmu as a command prompt. Multi tabs are supported by default, win + w hotkey opens a new tab.
Next what we can do is navigate to our Web API project and run dotnet run. This will run the Web API service in the command prompt, here in ConEmu.
It is also possible to restore packages with dotnet restore and build a project without running with dotnet build.
When the project is ran, it is ran in production mode. This is the default behaviour since usually the production setup is the most restrictive one. In order to have the environment set to development we can set it by setting it in the current command prompt context:
1
set ASPNETCORE_ENVIRONMENT=Development
We would need to run this on every new command prompt window. If we want to persist it, we can set it as a global Windows variable but this will affect the whole operating system. Lucky us ConEmu provides a way to run repeated commands on start of prompt which we will see now.
## 2. Setup environment
At each prompt start, ConEmu allows us to run a set of commands. Those can be used to set environment variables or to set aliases which will exist only in ConEmu context.
In order to access the environment setup, go to settings > startup > environment and the following window will show:
From here we can see that we can set variables, here I’ve set ASPNETCORE_ENVIRONMENT and also the base path of all my projects. And I also set an alias ns which helps me to quickly serve an Angular app with Angular CLI ng serve.
ConEmuBaseDir is the base directory containing ConEmu files. As we can see, %ConEmuBaseDir%\Scripts is also set to the path. This \Scripts folder is provided by ConEmu and already set to path for us to place scripts in which are then easy access for our tasks.
Now that we know how to setup environment variables, we will no longer need to manually set the ASPNETCORE_ENVIRONMENT variable as it will be done automatically. What we still need to do is to navigate to our service and dotnet run the project manually. Lucky us, again, ConEmu has a way to automate that by creating a script and setting it to a hotkey with ConEmu tasks which we will see next.
Let’s say we have a Web API located in C:\Projects\MyApi\MyApi.Web. In order to run it, we could do the following:
1
2
3
title My Api
cd C:\Projects\MyApi\MyApi.Web
dotnet run
This would set the title of the prompt to My Api then navigate to the service folder and run the project under development environment (since it was set in 2.). What we can do now is put those 3 lines in MyApi.cmd file which we will place under ConEmu \Scripts folder.
1
\ConEmu\ConEmu\Scripts\MyApi.cmd
Since the \Scripts folder is added to PATH in each prompt, we should be able to launch it straight from anywhere.
1
> MyApi.cmd
This is already pretty neat as it cut down a lot of time for quick launching but we can go a step further by defining a task.
We start by opening the task settings settings > startup > tasks.
From there we can set a task which will start a new prompt and run the MyApi.cmd script. We do that by clicking on +, naming the service Services::My Api and adding the command cmd.exe /k MyApi.cmd.
The naming convention allows grouping of tasks for easy access through the UI, [Group]::[Task] which is accessable from + on the main UI page.
A Hotkey can also be set with a combination of keys for even quicker access.
## 4. Apply to multiple services
All we have to do left is to create a script and task per service that we have. We can then create a global task which we can call Services::Multi containing all services:
1
2
3
4
5
cmd.exe /k MyApi.cmd
cmd.exe /k MyApi2.cmd
cmd.exe /k MyApi3.cmd
This task when ran will open 3 tabs and launch one script per tab which will result in a start of all services in one click.
# Conclusion
Today we saw how to configure ConEmu to environment and task to allow us to start multiple services running ASP NET Core Web API in a single click. The ease of use and the support of multi tab make ConEmu a major contributor to reducing the amount of time wasted in development cycle. Hope you enjoyed reading this post as much as I enjoyed writing it. If you have any questions leave it here or hit me on Twitter @Kimserey_Lam. See you next time!
Designed, built and maintained by Kimserey Lam. | 2019-07-22 11:33:58 | {"extraction_info": {"found_math": true, "script_math_tex": 0, "script_math_asciimath": 0, "math_annotations": 0, "math_alttext": 0, "mathml": 0, "mathjax_tag": 0, "mathjax_inline_tex": 0, "mathjax_display_tex": 0, "mathjax_asciimath": 1, "img_math": 0, "codecogs_latex": 0, "wp_latex": 0, "mimetex.cgi": 0, "/images/math/codecogs": 0, "mathtex.cgi": 0, "katex": 0, "math-container": 0, "wp-katex-eq": 0, "align": 0, "equation": 0, "x-ck12": 0, "texerror": 0, "math_score": 0.18113961815834045, "perplexity": 2410.309029130337}, "config": {"markdown_headings": true, "markdown_code": true, "boilerplate_config": {"ratio_threshold": 0.18, "absolute_threshold": 10, "end_threshold": 15, "enable": true}, "remove_buttons": true, "remove_image_figures": true, "remove_link_clusters": true, "table_config": {"min_rows": 2, "min_cols": 3, "format": "plain"}, "remove_chinese": true, "remove_edit_buttons": true, "extract_latex": true}, "warc_path": "s3://commoncrawl/crawl-data/CC-MAIN-2019-30/segments/1563195528013.81/warc/CC-MAIN-20190722113215-20190722135215-00025.warc.gz"} |
https://community.wolfram.com/groups/-/m/t/2373558 | # Why does the DSolve not solve the PDE giving the 'Arbitrary functions'?
Posted 1 month ago
343 Views
|
6 Replies
|
0 Total Likes
|
Hello, I have two PDEs (strainDisp11 & strainDisp22) in 2 variables x1 and x2. strainDisp11 is a PDE with the partial differential term in x1 whereas, strainDisp22 is a PDE with the partial differential term in x2 I am trying to solve these two PDEs separately using DSolve (Last two command lines in the attached file), however, the solution is not generated along with the required arbitrary functions C1[1] which should be f1[x2] and C1[1] which should be f2[x1] in the respective solutions of the PDEs. Attached is Notebook for your reference. Appreciate your help.
6 Replies
Sort By:
Posted 1 month ago
A Tip: Don't use Subscript , because causes problems.
Posted 1 month ago
Thanks! Very much appreciated.
Posted 11 days ago
Hello, I have two PDEs in 2 variables 'r' and 'theta'. I am trying to solve these two PDEs separately using DSolve (The last two command lines in the attached file). The solution is generated as expected for the 1st PDE (Integration with respect to variable 'r'), however, the solution is not generated for the 2nd PDE (Integration with respect to 'theta'). I cannot understand why Mathematica does not solve all the terms and has replaced 'theta' by K[1] in the unsolved integral with limits? Attached is Notebook for your reference. Appreciate your help.
Posted 11 days ago
Maybe: solDispRR = DSolve[strainDispRR == 0, uR, {r, \[Theta]}] // Flatten; solDisp\[Theta]\[Theta] = DSolve[strainDisp\[Theta]\[Theta] == 0, u\[Theta], {r, \[Theta]}] // Flatten; uRFunctionTemp = uR[r, \[Theta]] /. solDispRR[[1]] u\[Theta]FunctionTemp = (u\[Theta][r, \[Theta]] /. solDisp\[Theta]\[Theta][[1]] /. solDispRR[[1]]) // Activate // ExpandAll Looks like MMA can't integrate, a workaround: u\[Theta]FunctionTemp = (Integrate[#, {K[1], 1, \[Theta]}] & /@ (u\[Theta]FunctionTemp[[1, 1]])) + u\[Theta]FunctionTemp[[2]] (*Integrate[-C[1][K[1]], {K[1], 1, \[Theta]}] + (2*P*\[Nu]^2*Log[r]*(Sin[1] - Sin[\[Theta]]))/(Pi*\[DoubleStruckCapitalE]) + (2*P*\[Nu]*(-Sin[1] + Sin[\[Theta]]))/(Pi*\[DoubleStruckCapitalE]) + (2*P*\[Nu]^2*(-Sin[1] + Sin[\[Theta]]))/(Pi*\[DoubleStruckCapitalE]) + (2*P*Log[r]*(-Sin[1] + Sin[\[Theta]]))/(Pi*\[DoubleStruckCapitalE]) + C[1][r]*) In this line: Integrate[-C[1][K[1]], {K[1], 1, \[Theta]}] what answer do you expect? | 2021-10-28 08:17:36 | {"extraction_info": {"found_math": true, "script_math_tex": 0, "script_math_asciimath": 0, "math_annotations": 0, "math_alttext": 0, "mathml": 0, "mathjax_tag": 0, "mathjax_inline_tex": 0, "mathjax_display_tex": 0, "mathjax_asciimath": 1, "img_math": 0, "codecogs_latex": 0, "wp_latex": 0, "mimetex.cgi": 0, "/images/math/codecogs": 0, "mathtex.cgi": 0, "katex": 0, "math-container": 0, "wp-katex-eq": 0, "align": 0, "equation": 0, "x-ck12": 0, "texerror": 0, "math_score": 0.26450031995773315, "perplexity": 7160.811352501623}, "config": {"markdown_headings": true, "markdown_code": true, "boilerplate_config": {"ratio_threshold": 0.18, "absolute_threshold": 10, "end_threshold": 15, "enable": true}, "remove_buttons": true, "remove_image_figures": true, "remove_link_clusters": true, "table_config": {"min_rows": 2, "min_cols": 3, "format": "plain"}, "remove_chinese": true, "remove_edit_buttons": true, "extract_latex": true}, "warc_path": "s3://commoncrawl/crawl-data/CC-MAIN-2021-43/segments/1634323588282.80/warc/CC-MAIN-20211028065732-20211028095732-00550.warc.gz"} |
http://mathhelpforum.com/calculus/209791-partial-derivative-notation-question.html | # Math Help - partial derivative notation question
1. ## partial derivative notation question
what does the notation at the bottom mean? the second derivative wrt z over the partial of y times the partial of x. Is that right? and what does that mean procedurally?
2. ## Re: partial derivative notation question
It means to first take the partial derivative of z with respect to y, then take the partial derivative of this result with respect to x.
For a function like this which is continuous and the respective partials exist, the order of differentiation does not matter, i.e.:
$\frac{\delta^2 z}{\delta x\delta y}=\frac{\delta^2 z}{\delta y\delta x}$ | 2014-10-22 04:12:17 | {"extraction_info": {"found_math": true, "script_math_tex": 0, "script_math_asciimath": 0, "math_annotations": 0, "math_alttext": 0, "mathml": 0, "mathjax_tag": 0, "mathjax_inline_tex": 0, "mathjax_display_tex": 0, "mathjax_asciimath": 0, "img_math": 0, "codecogs_latex": 1, "wp_latex": 0, "mimetex.cgi": 0, "/images/math/codecogs": 0, "mathtex.cgi": 0, "katex": 0, "math-container": 0, "wp-katex-eq": 0, "align": 0, "equation": 0, "x-ck12": 0, "texerror": 0, "math_score": 0.9681448936462402, "perplexity": 317.01724842933305}, "config": {"markdown_headings": true, "markdown_code": true, "boilerplate_config": {"ratio_threshold": 0.18, "absolute_threshold": 10, "end_threshold": 5, "enable": true}, "remove_buttons": true, "remove_image_figures": true, "remove_link_clusters": true, "table_config": {"min_rows": 2, "min_cols": 3, "format": "plain"}, "remove_chinese": true, "remove_edit_buttons": true, "extract_latex": true}, "warc_path": "s3://commoncrawl/crawl-data/CC-MAIN-2014-42/segments/1413507445299.20/warc/CC-MAIN-20141017005725-00146-ip-10-16-133-185.ec2.internal.warc.gz"} |
https://www.dsprelated.com/showarticle/1228.php | # Compute the Frequency Response of a Multistage Decimator
Figure 1a shows the block diagram of a decimation-by-8 filter, consisting of a low-pass finite impulse response (FIR) filter followed by downsampling by 8 [1]. A more efficient version is shown in Figure 1b, which uses three cascaded decimate-by-two filters. This implementation has the advantages that only FIR 1 is sampled at the highest sample rate, and the total number of filter taps is lower.
The frequency response of the single-stage decimator before downsampling is just the response of the FIR filter from f = 0 to fs/2. After downsampling, remaining signal components above fs/16 create aliases at frequencies below fs/16. It’s not quite so clear how to find the frequency response of the multistage filter: after all, the output of FIR 3 has unique spectrum extending only to fs/8, and we need to find the response from 0 to fs/2. Let’s look at an example to see how to calculate the frequency response. Although the example uses decimation-by-2 stages, our approach applies to any integer decimation factor.
Figure 1. Decimation by 8. (a) Single-stage decimator. (b) Three-stage decimator.
For this example, let the input sample rate of the decimator in Figure 1b equal 1600 Hz. The three FIR filters then have sample rates of 1600, 800, and 400 Hz. Each is a half-band filter [2 - 4] with passband of at least 0 to 75 Hz. Here is Matlab code that defines the three sets of filter coefficients (See Appendix):
b1= [-1 0 9 16 9 0 -1]/32; % fs = 1600 Hz
b2= [23 0 -124 0 613 1023 613 0 -124 0 23]/2048; % fs/2 = 800 Hz
b3= [-11 0 34 0 -81 0 173 0 -376 0 1285 2050 1285 0 -376 0 173 0 ...
-81 0 34 0 -11]/4096; % fs/4 = 400 Hz
The frequency responses of these filters are plotted in Figure 2. Each response is plotted over f = 0 to half its sampling rate:
FIR 1: 0 to 800 Hz
FIR 2: 0 to 400 Hz
FIR 3: 0 to 200 Hz
Figure 2. Frequency Responses of halfband decimation filters.
Now, to find the overall response at fs = 1600 Hz, we need to know the time or frequency response of FIR 2 and FIR 3 at this sample rate. Converting the time response is just a matter of sampling at fs instead of at fs /2 or fs /4 – i.e., upsampling. For example, the following Matlab code upsamples the FIR 2 coefficients by 2, from fs/2 to fs:
b2_up= zeros(1,21);
b2_up(1:2:21)= b2;
Figure 3 shows the coefficients b2 and b2_up. The code has inserted samples of value zero halfway between each of the original samples of b2 to create b2_up. b2_up now has a sample rate of fs. But although we have a new representation of the coefficients, upsampling has no effect on the math: b2_up and b2 have the same coefficient values and the same time interval between the coefficients.
For FIR 3, we need to upsample by 4 as follows:
b3_up= zeros(1,89);
b3_up(1:4:89)= b3;
Figure 4 shows the coefficients b3 and b3_up. Again, the upsampled version is mathematically identical to the original version. Now we have three sets of coefficients, all sampled at fs = 1600 Hz. A block diagram of the cascade of these coefficients is shown in Figure 5.
Figure 3. Top: Halfband filter coefficients b2. Bottom: Coefficients upsampled by 2.
Figure 4. Top: Halfband filter coefficients b3. Bottom: Coefficients upsampled by 4.
Figure 5. Conceptual diagram showing cascade of FIR 1 and upsampled versions of FIR 2 and FIR 3, used for computing frequency response of decimator of Figure 1b.
Using the DFT, we can compute and plot the frequency response of each filter stage, as shown in Figure 6. Upsampling b2 and b3 has allowed us to compute the DFT at the input sampling frequency fs for those sections. The sampling theorem [5] tells us that the frequency response of b2, which has a sample rate of 800 Hz, has an image between 400 and 800 Hz. Since b2_up has a sample rate of 1600 Hz, this image appears in its DFT (middle plot). Similarly, the DFT of b3_up has images from 200 to 400; 400 to 600; and 600 to 800 Hz (bottom plot).
Each decimation filter response in Figure 6 has stopband centered at one-half of its original sample frequency, shown as a red horizontal line (see Appendix). This attenuates spectrum in that band prior to downsampling by 2.
Figure 6. Frequency responses of decimator stages, fs = 1600 Hz.
Top: FIR 1 (b1 ) Middle: FIR 2 (b2_up) Bottom: FIR 3 (b3_up)
Now let’s find the overall frequency response. To do this, we could a) find the product of the three frequency responses in Figure 6, or b) compute the impulse response of the cascade of b1, b2_up, and b3_up, then use it to find H(z). Taking the latter approach, the overall impulse response is:
b123 = b1 ⊛ (b2up ⊛ b3up)
where ⊛ indicates convolution. The Matlab code is:
b23= conv(b2_up,b3_up);
b123= conv(b23,b1); % overall impulse response at fs= 1600 Hz
The impulse response is plotted in Figure 7. It is worth comparing the length of this response to that of the decimator stages. The impulse response has 115 samples; that is, it would take a 115-tap FIR filter to implement the decimator as a single stage FIR sampled at 1600 Hz. Of the 115 taps, 16 are zero. By contrast, the length of the three decimator stages are 7, 11, and 23 taps, of which a total of 16 taps are zero. So the multistage approach saves taps, and furthermore, only the first stage operates at 1600 Hz. Thus, the multistage decimator uses significantly fewer resources than a single stage decimator.
Calculating the frequency response from b_123:
fs= 1600; % Hz decimator input sample rate
[h,f]= freqz(b123,1,256,fs);
H= 20*log10(abs(h)); % overall freq response magnitude
The frequency response magnitude is plotted in Figure 8, with the stopband specified in the Appendix shown in red.
Here is a summary of the steps to compute the decimator frequency response:
1. Upsample the coefficients of all of the decimator stages (except the first stage) so that their sample rate equals the input sample rate.
2. Convolve all the coefficients from step 1 to obtain the overall impulse response at the input sample rate.
3. Take the DFT of the overall impulse response to obtain the frequency response.
Our discussion of upsampling may bring to mind the use of that process in interpolators. As in our example, upsampling in an interpolator creates images of the signal spectrum at multiples of the original sample frequency. The interpolation filter then attenuates those images [6].
We don’t want to forget aliasing, so we’ll take a look at that next.
Figure 7. Overall impulse response of three-stage decimator at fs = 1600 Hz (length = 115).
Figure 8. Overall frequency response of Decimator at fs= 1600 Hz.
## Taking Aliasing into Account
The output sample rate of the decimator in Figure 1b is fs out = 1600/8 = 200 Hz. If we apply sinusoids to its input, they will be filtered by the response of Figure 8, but then any components above fs out /2 (100 Hz) will produce aliases in the band of 0 to fs out /2. Let’s apply equal level sinusoids at 75, 290, and 708 Hz, as shown in Figure 9. The response in the bottom of Figure 9 shows the expected attenuation at 290 Hz is about 52 dB and at 708 Hz is about 53 dB (red dots). For reference, the component at 75 Hz has 0 dB attenuation. After decimation, the components at 290 and 708 Hz alias as follows:
f1 = 290 – fs out = 290 – 200 = 90 Hz
f= 4*fs out – 708 = 800 – 708 = 92 Hz
So, after decimation, we expect a component at 90 MHz that is about 52 dB below the component at 75 Hz, and a component at 92 Hz that is about 53 dB down. This is in fact what we get when we go through the filtering and downsampling operations: see Figure 10.
Note that the sines at 290 and 708 MHz are not within the stopbands as defined in the Appendix for FIR 1 and FIR 2. For that reason, the aliased components are greater than the specified stopband of -57 dB. This is not necessarily a problem, however, because they fall outside the passband of 75 Hz. They can be further attenuated by a subsequent channel filter.
Figure 9. Top: Multiple sinusoidal input to decimator at 75, 290, and 708 Hz.
Bottom: Decimator overall frequency response. Note fs out = fs/8.
Figure 10. Decimator output spectrum for input of Figure 9. fs out = fs/8 = 200 Hz.
## Appendix: Decimation Filter Synthesis
The halfband decimators were designed by the window method [3] using Matlab function fir1. We obtain halfband coefficients by setting the cutoff frequency to one-quarter of the sample rate. The order of each filter was chosen to meet the passband and stopband requirements shown in the table. Frequency responses are plotted in Figure 2 of the main text. We could have made the stopband attenuation of FIR 3 equal to that of the other filters, at the expense of more taps.
Common parameters:
Passband: > -0.1 dB at 75 Hz
Window function: Chebyshev, -47 dB
Section Sample rate Stopband edge Stopband atten Order FIR 1 fs = 1600 Hz fs/2 – 75 = 725 Hz 57 dB 6 FIR 2 fs/2 = 800 Hz fs/4 – 75 = 325 Hz 57 dB 10 FIR 3 fs/4 = 400 Hz fs/8 - 75 = 125 Hz 43 dB 22
Note that the filters as synthesized by fir1 have zero-valued coefficients on each end, so the actual filter order is two less than that in the function call. Using N = 6 and 10 in fir1 (instead of 8 and 12) would eliminate these superfluous zero coefficients, but would result in somewhat different responses.
% dec_fil1.m 1/31/19 Neil Robertson
% synthesize halfband decimators using window method
% fc = (fs/4)/fnyq = (fs/4)/(fs/2) = 1/2
% resulting coeffs have zeros on the each end,so actual filter order is N-2.
%
> fc= 1/2; % -6 dB freq divided by nyquist freq
%
% b1: halfband decimator from fs= 1600 Hz to 800 Hz
N= 8;
win= chebwin(N+1,47); % chebyshev window function, -47 dB
b= fir1(N,fc,win); % filter synthesis by window method
b1= round(b*32)/32; % fixed-point coefficients
%
% b2: halfband decimator from fs= 800 Hz to 400 Hz
N= 12;
win= chebwin(N+1,47);
b= fir1(N,fc,win);
b2= round(b*2048)/2048;
%
% b3: halfband decimator from fs= 400 Hz to 200 Hz
N= 24;
win= chebwin(N+1,47);
b= fir1(N,fc,win);
b3= round(b*4096)/4096;
## References
1. Lyons, Richard G. , Understanding Digital Signal Processing, 2nd Ed., Prentice Hall, 2004, section 10.1.
2. Mitra, Sanjit K.,Digital Signal Processing, 2nd Ed., McGraw-Hill, 2001, p 701-702.
3. Robertson, Neil, “Simplest Calculation of Halfband Filter Coefficients”, DSP Related website, Nov, 2017 https://www.dsprelated.com/showarticle/1113.php
4. Lyons, Rick, “Optimizing the Half-band Filters in Multistage Decimation and Interpolation”, DSP Related website, Jan, 2016 https://www.dsprelated.com/showarticle/903.php
5. Oppenheim, Alan V. and Shafer, Ronald W., Discrete-Time Signal Processing, Prentice Hall, 1989, Section 3.2.
6. Lyons, Richard G. , Understanding Digital Signal Processing, 2nd Ed., Prentice Hall, 2004, section 10.2.
Neil Robertson February 2019
[ - ]
Comment by February 11, 2019
Hi Neil.
This is a great blog. Your Figure 10 shows a very important principle that we sometimes forget. That principle is: After decimation by 8, *ALL* of the spectral energy that exists in the freq range of 0 -to- 800 Hz in the filter's output in Figure 8 is folded down and shows up in the decimated-by-8 signal's spectrum that you show your Figure 10. Good job!
[ - ]
Comment by February 12, 2019
Thanks Rick, I appreciate the encouragement!
To post reply to a comment, click on the 'reply' button attached to each comment. To post a new comment (not a reply to a comment) check out the 'Write a Comment' tab at the top of the comments. | 2021-04-23 10:43:08 | {"extraction_info": {"found_math": true, "script_math_tex": 0, "script_math_asciimath": 0, "math_annotations": 0, "math_alttext": 0, "mathml": 0, "mathjax_tag": 0, "mathjax_inline_tex": 0, "mathjax_display_tex": 0, "mathjax_asciimath": 1, "img_math": 0, "codecogs_latex": 0, "wp_latex": 0, "mimetex.cgi": 0, "/images/math/codecogs": 0, "mathtex.cgi": 0, "katex": 0, "math-container": 0, "wp-katex-eq": 0, "align": 0, "equation": 0, "x-ck12": 0, "texerror": 0, "math_score": 0.7315039038658142, "perplexity": 3455.8979256515695}, "config": {"markdown_headings": true, "markdown_code": true, "boilerplate_config": {"ratio_threshold": 0.18, "absolute_threshold": 10, "end_threshold": 15, "enable": true}, "remove_buttons": true, "remove_image_figures": true, "remove_link_clusters": true, "table_config": {"min_rows": 2, "min_cols": 3, "format": "plain"}, "remove_chinese": true, "remove_edit_buttons": true, "extract_latex": true}, "warc_path": "s3://commoncrawl/crawl-data/CC-MAIN-2021-17/segments/1618039617701.99/warc/CC-MAIN-20210423101141-20210423131141-00498.warc.gz"} |
https://economics.stackexchange.com/questions/14047/why-are-vacancy-rate-and-unemployment-rate-negatively-correlated | # Why are vacancy rate and unemployment rate negatively correlated?
Why is this the case?
Since Vacancy rate is defined as following,
let $A,Q,U$ denote number of vacancies in the economy, labor force, unemployed respectively.
$$\frac{A}{A+Q-U}$$
Here we can see that if unemployed increase vacancy rate would go up?
Why is there a negatively correlation then? Take the beveridge curve as an example :
https://en.wikipedia.org/wiki/Beveridge_curve
• I have no idea what you are asking here. Maybe rephrase the question. – Jamzy Nov 1 '16 at 22:05
• Are you asking 'why is unemployment lower when job vacancies are higher?'. Unemployed people are people are looking for work. When you increase the thing that they are looking for (work), there will be less of them. – Jamzy Nov 1 '16 at 22:08
Adopting your notation, the vacancy rate at any given time is defined as $A/Q$. There is no mechanical relationship between the unemployment rate $U/Q$ and vacancy rate (A/Q). | 2019-10-20 09:38:34 | {"extraction_info": {"found_math": true, "script_math_tex": 0, "script_math_asciimath": 0, "math_annotations": 0, "math_alttext": 0, "mathml": 0, "mathjax_tag": 0, "mathjax_inline_tex": 1, "mathjax_display_tex": 1, "mathjax_asciimath": 0, "img_math": 0, "codecogs_latex": 0, "wp_latex": 0, "mimetex.cgi": 0, "/images/math/codecogs": 0, "mathtex.cgi": 0, "katex": 0, "math-container": 0, "wp-katex-eq": 0, "align": 0, "equation": 0, "x-ck12": 0, "texerror": 0, "math_score": 0.7795020341873169, "perplexity": 2063.607101534271}, "config": {"markdown_headings": true, "markdown_code": true, "boilerplate_config": {"ratio_threshold": 0.18, "absolute_threshold": 10, "end_threshold": 15, "enable": true}, "remove_buttons": true, "remove_image_figures": true, "remove_link_clusters": true, "table_config": {"min_rows": 2, "min_cols": 3, "format": "plain"}, "remove_chinese": true, "remove_edit_buttons": true, "extract_latex": true}, "warc_path": "s3://commoncrawl/crawl-data/CC-MAIN-2019-43/segments/1570986705411.60/warc/CC-MAIN-20191020081806-20191020105306-00218.warc.gz"} |
https://www.computer.org/csdl/trans/td/2008/08/ttd2008081099-abs.html | Issue No. 08 - August (2008 vol. 19)
ISSN: 1045-9219
pp: 1099-1110
ABSTRACT
Peer-to-peer (P2P) networks often demand scalability, low communication latency among nodes, and low system-wide overhead. For scalability, a node maintains partial states of a P2P network and connects to a few nodes. For fast communication, a P2P network intends to reduce the communication latency between any two nodes as much as possible. With regard to a low system-wide overhead, a P2P network minimizes its traffic in maintaining its performance efficiency and functional correctness. In this paper, we present a novel tree-based P2P network with low communication delay and low system-wide overhead. The merits of our tree-based network include: $(i)$ a tree-shaped P2P network which guarantees that the degree of a node is constant in probability regardless of the system size. The network diameter in our tree-based network increases logarithmically with an increase of the system size. Specially, given a physical network with a power-law latency expansion property, we show that the diameter of our tree network is constant. $(ii)$ Our proposal has the provable performance guarantees. We evaluate our proposal by rigorous performance analysis, and validate by extensive simulations.
INDEX TERMS
Distributed networks, Distributed Systems, Multicast
CITATION
H. Hsiao and C. He, "A Tree-Based Peer-to-Peer Network with Quality Guarantees," in IEEE Transactions on Parallel & Distributed Systems, vol. 19, no. , pp. 1099-1110, 2007.
doi:10.1109/TPDS.2007.70798 | 2018-05-28 10:18:54 | {"extraction_info": {"found_math": true, "script_math_tex": 0, "script_math_asciimath": 0, "math_annotations": 0, "math_alttext": 0, "mathml": 0, "mathjax_tag": 0, "mathjax_inline_tex": 1, "mathjax_display_tex": 0, "mathjax_asciimath": 0, "img_math": 0, "codecogs_latex": 0, "wp_latex": 0, "mimetex.cgi": 0, "/images/math/codecogs": 0, "mathtex.cgi": 0, "katex": 0, "math-container": 0, "wp-katex-eq": 0, "align": 0, "equation": 0, "x-ck12": 0, "texerror": 0, "math_score": 0.7336714267730713, "perplexity": 1543.3951099112298}, "config": {"markdown_headings": true, "markdown_code": true, "boilerplate_config": {"ratio_threshold": 0.18, "absolute_threshold": 10, "end_threshold": 15, "enable": true}, "remove_buttons": true, "remove_image_figures": true, "remove_link_clusters": true, "table_config": {"min_rows": 2, "min_cols": 3, "format": "plain"}, "remove_chinese": true, "remove_edit_buttons": true, "extract_latex": true}, "warc_path": "s3://commoncrawl/crawl-data/CC-MAIN-2018-22/segments/1526794872766.96/warc/CC-MAIN-20180528091637-20180528111637-00313.warc.gz"} |
https://mathhothouse.me/category/pre-rmo-2/ | ## Category Archives: Pre-RMO
### Rules for Inequalities
If a, b and c are real numbers, then
1. $a < b \Longrightarrow a + c< b + c$
2. $a < b \Longrightarrow a - c < b - c$
3. $a < b \hspace{0.1in} and \hspace{0.1in}c > 0 \Longrightarrow ac < bc$
4. $a < b \hspace{0.1in} and \hspace{0.1in}c < 0 \Longrightarrow bc < ac$ special case: $a < b \Longrightarrow -b < -a$
5. $a > 0 \Longrightarrow \frac{1}{a} > 0$
6. If a and b are both positive or both negative, then $a < b \Longrightarrow \frac{1}{b} < \frac{1}{a}$.
Remarks:
Notice the rules for multiplying an inequality by a number: Multiplying by a positive number preserves the inequality; multiplying by a negative number reverses the inequality. Also, reciprocation reverses the inequality for numbers of the same sign.
Regards,
Nalin Pithwa.
### Set Theory, Relations, Functions Preliminaries: II
Relations:
Concept of Order:
Let us say that we create a “table” of two columns in which the first column is the name of the father, and the second column is name of the child. So, it can have entries like (Yogesh, Meera), (Yogesh, Gopal), (Kishor, Nalin), (Kishor, Yogesh), (Kishor, Darshna) etc. It is quite obvious that “first” is the “father”, then “second” is the child. We see that there is a “natural concept of order” in human “relations”. There is one more, slightly crazy, example of “importance of order” in real-life. It is presented below (and some times also appears in basic computer science text as rise and shine algorithm) —-
Rise and Shine algorithm:
When we get up from sleep in the morning, we brush our teeth, finish our morning ablutions; next, we remove our pyjamas and shirt and then (secondly) enter the shower; there is a natural order here; first we cannot enter the shower, and secondly we do not remove the pyjamas and shirt after entering the shower. 🙂
Ordered Pair: Definition and explanation:
A pair $(a,b)$ of numbers, such that the order, in which the numbers appear is important, is called an ordered pair. In general, ordered pairs (a,b) and (b,a) are different. In ordered pair (a,b), ‘a’ is called first component and ‘b’ is called second component.
Two ordered pairs (a,b) and (c,d) are equal, if and only if $a=c$ and $b=d$. Also, $(a,b)=(b,a)$ if and only if $a=b$.
Example 1: Find x and y when $(x+3,2)=(4,y-3)$.
Solution 1: Equating the first components and then equating the second components, we have:
$x+3=4$ and $2=y-3$
$x=1$ and $y=5$
Cartesian products of two sets:
Let A and B be two non-empty sets then the cartesian product of A and B is denoted by A x B (read it as “A cross B”),and is defined as the set of all ordered pairs (a,b) such that $a \in A$, $b \in B$.
Thus, $A \times B = \{ (a,b): a \in A, b \in B\}$
e.g., if $A = \{ 1,2\}$ and $B = \{ a,b,c\}$, tnen $A \times B = \{ (1,a),(1,b),(1,c),(2,a),(2,b),(2,c)\}$.
If $A = \phi$ or $B=\phi$, we define $A \times B = \phi$.
Number of elements of a cartesian product:
By the following basic counting principle: If a task A can be done in m ways, and a task B can be done in n ways, then the tasks A (first) and task B (later) can be done in mn ways.
So, the cardinality of A x B is given by: $n(A \times B)= n(A) \times n(B)$.
So, in general if a cartesian product of p finite sets, viz, $A_{1}, A_{2}, A_{3}, \ldots, A_{p}$ is given by $n(A_{1} \times A_{2} \times A_{3} \ldots A_{p}) = n(A_{1}) \times n(A_{2}) \times \ldots \times n(A_{p})$
Definitions of relations, arrow diagrams (or pictorial representation), domain, co-domain, and range of a relation:
Consider the following statements:
i) Sunil is a friend of Anil.
ii) 8 is greater than 4.
iii) 5 is a square root of 25.
Here, we can say that Sunil is related to Anil by the relation ‘is a friend of’; 8 and 4 are related by the relation ‘is greater than’; similarly, in the third statement, the relation is ‘is a square root of’.
The word relation implies an association of two objects according to some property which they possess. Now, let us some mathematical aspects of relation;
Definition:
A and B are two non-empty sets then any subset of $A \times B$ is called relation from A to B, and is denoted by capital letters P, Q and R. If R is a relation and $(x,y) \in R$ then it is denoted by $xRy$.
y is called image of x under R and x is called pre-image of y under R.
Let $A=\{ 1,2,3,4,5\}$ and $B=\{ 1,4,5\}$.
Let R be a relation such that $(x,y) \in R$ implies $x < y$. We list the elements of R.
Solution: Here $A = \{ 1,2,3,4,5\}$ and $B=\{ 1,4,5\}$ so that $R = \{ (1,4),(1,5),(2,4),(2,5),(3,4),(3,5),(4,5)\}$ Note this is the relation R from A to B, that is, it is a subset of A x B.
Check: Is a relation $R^{'}$ from B to A defined by x<y, with $x \in B$ and $y \in A$ — is this relation $R^{'}$ *same* as R from A to B? Ans: Let us list all the elements of R^{‘} explicitly: $R^{'} = \{ (1,2),(1,3),(1,4),(1,5),(4,5)\}$. Well, we can surely compare the two sets R and $R^{'}$ — the elements “look” different certainly. Even if they “look” same in terms of numbers, the two sets $R$ and $R^{'}$ are fundamentally different because they have different domains and co-domains.
Definition : Domain of a relation R: The set of all the first components of the ordered pairs in a relation R is called the domain of relation R. That is, if $R \subseteq A \times B$, then domain (R) is $\{ a: (a,b) \in R\}$.
Definition: Range: The set of all second components of all ordered pairs in a relation R is called the range of the relation. That is, if $R \subseteq A \times B$, then range (R) = $\{ b: (a,b) \in R\}$.
Definition: Codomain: If R is a relation from A to B, then set B is called co-domain of the relation R. Note: Range is a subset of co-domain.
Type of Relations:
One-one relation: A relation R from a set A to B is said to be one-one if every element of A has at most one image in B and distinct elements in A have distinct images in B. For example, let $A = \{ 1,2,3,4\}$, and let $B=\{ 2,3,4,5,6,7\}$ and let $R_{1}= \{ (1,3),(2,4),(3,5)\}$ Then $R_{1}$ is a one-one relation. Here, domain of $R_{1}= \{ 1,2,3\}$ and range of $R_{1}$ is $\{ 3,4,5\}$.
Many-one relation: A relation R from A to B is called a many-one relation if two or more than two elements in the domain A are associated with a single (unique) element in co-domain B. For example, let $R_{2}=\{ (1,4),(3,7),(4,4)\}$. Then, $R_{2}$ is many-one relation from A to B. (please draw arrow diagram). Note also that domain of $R_{1}=\{ 1,3,4\}$ and range of $R_{1}=\{ 4,7\}$.
Into Relation: A relation R from A to B is said to be into relation if there exists at least one element in B, which has no pre-image in A. Let $A=\{ -2,-1,0,1,2,3\}$ and $B=\{ 0,1,2,3,4\}$. Consider the relation $R_{1}=\{ (-2,4),(-1,1),(0,0),(1,1),(2,4) \}$. So, clearly range is $\{ 0,1,4\}$ and $range \subseteq B$. Thus, $R_{3}$ is a relation from A INTO B.
Onto Relation: A relation R from A to B is said to be ONTO relation if every element of B is the image of some element of A. For example: let set $A= \{ -3,-2,-1,1,3,4\}$ and set $B= \{ 1,4,9\}$. Let $R_{4}=\{ (-3,9),(-2,4), (-1,1), (1,1),(3,9)\}$. So, clearly range of $R_{4}= \{ 1,4,9\}$. Range of $R_{4}$ is co-domain of B. Thus, $R_{4}$ is a relation from A ONTO B.
Binary Relation on a set A:
Let A be a non-empty set then every subset of $A \times A$ is a binary relation on set A.
Illustrative Examples:
E.g.1: Let $A = \{ 1,2,3\}$ and let $A \times A = \{ (1,1),(1,2),(1,3),(2,1),(2,2),(2,3),(3,1),(3,2),(3,3)\}$. Now, if we have a set $R = \{ (1,2),(2,2),(3,1),(3,2)\}$ then we observe that $R \subseteq A \times A$, and hence, R is a binary relation on A.
E.g.2: Let N be the set of natural numbers and $R = \{ (a,b) : a, b \in N and 2a+b=10\}$. Since $R \subseteq N \times N$, R is a binary relation on N. Clearly, $R = \{ (1,8),(2,6),(3,4),(4,2)\}$. Also, for the sake of completeness, we state here the following: Domain of R is $\{ 1,2,3,4\}$ and Range of R is $\{ 2,4,6,8\}$, codomain of R is N.
Note: (i) Since the null set is considered to be a subset of any set X, so also here, $\phi \subset A \times A$, and hence, $\phi$ is a relation on any set A, and is called the empty or void relation on A. (ii) Since $A \times A \subset A \times A$, we say that $A \subset A$ is a relation on A called the universal relation on A.
Note: Let the cardinality of a (finite) set A be $n(A)=p$ and that of another set B be $n(B)=q$, then the cardinality of the cartesian product $n(A \times B)=pq$. So, the number of possible subsets of $A \times B$ is $2^{pq}$ which includes the empty set.
Types of relations:
Let A be a non-empty set. Then, a relation R on A is said to be: (i) Reflexive: if $(a,a) \in R$ for all $a \in A$, that is, aRa for all $a \in A$. (ii) Symmetric: If $(a,b) \in R \Longrightarrow (b,a) \in R$ for all $a,b \in R$ (iii) Transitive: If $(a,b) \in R$, and $(b,c) \in R$, then so also $(a,c) \in R$.
Equivalence Relation:
A (binary) relation on a set A is said to be an equivalence relation if it is reflexive, symmetric and transitive. An equivalence appears in many many areas of math. An equivalence measures “equality up to a property”. For example, in number theory, a congruence modulo is an equivalence relation; in Euclidean geometry, congruence and similarity are equivalence relations.
Also, we mention (without proof) that an equivalence relation on a set partitions the set in to mutually disjoint exhaustive subsets.
Illustrative examples continued:
E.g. Let R be an equivalence relation on $\mathbb{Q}$ defined by $R = \{ (a,b): a, b \in \mathbb{Q}, (a-b) \in \mathbb{Z}\}$. Prove that R is an equivalence relation.
Proof: Given that $R = \{ (a,b) : a, b \in \mathbb{Q}, (a-b) \in \mathbb{Z}\}$. (i) Let $a \in \mathbb{Q}$ then $a-a=0 \in \mathbb{Z}$, hence, $(a,a) \in R$, so relation R is reflexive. (ii) Now, note that $(a,b) \in R \Longrightarrow (a-b) \in \mathbb{Z}$, that is, $(a-b)$ is an integer $\Longrightarrow -(b-a) \in \mathbb{Z} \Longrightarrow (b-a) \in \mathbb{Z} \Longrightarrow (b,a) \in R$. That is, we have proved $(a,b) \in R \Longrightarrow (b,a) \in R$ and so relation R is symmetric also. (iii) Now, let $(a,b) \in R$, and $(b,c) \in R$, which in turn implies that $(a-b) \in \mathbb{Z}$ and $(b-c) \in \mathbb{Z}$ so it $\Longrightarrow (a-b)+(b-c)=a-c \in \mathbb{Z}$ (as integers are closed under addition) which in turn $\Longrightarrow (a,c) \in R$. Thus, $(a,b) \in R$ and $(b,c) \in R$ implies $(a,c) \in R$ also, Hence, given relation R is transitive also. Hence, R is also an equivalence relation on $\mathbb{Q}$.
Illustrative examples continued:
E.g.: If $(x+1,y-2) = (3,4)$, find the values of x and y.
Solution: By definition of an ordered pair, corresponding components are equal. Hence, we get the following two equations: $x+1=3$ and $y-2=4$ so the solution is $x=2,y=6$.
E.g.: If $A = (1,2)$, list the set $A \times A$.
Solution: $A \times A = \{ (1,1),(1,2),(2,1),(2,2)\}$
E.g.: If $A = \{1,3,5 \}$ and $B=\{ 2,3\}$, find $A \times B$, and $B \times A$, check if cartesian product is a commutative operation, that is, check if $A \times B = B \times A$.
Solution: $A \times B = \{ (1,2),(1,3),(3,2),(3,3),(5,2),(5,3)\}$ whereas $B \times A = \{ (2,1),(2,3),(2,5),(3,1),(3,3),(3,5)\}$ so since $A \times B \neq B \times A$ so cartesian product is not a commutative set operation.
E.g.: If two sets A and B are such that their cartesian product is $A \times B = \{ (3,2),(3,4),(5,2),(5,4)\}$, find the sets A and B.
Solution: Using the definition of cartesian product of two sets, we know that set A contains as elements all the first components and set B contains as elements all the second components. So, we get $A = \{ 3,5\}$ and $B = \{ 2,4\}$.
E.g.: A and B are two sets given in such a way that $A \times B$ contains 6 elements. If three elements of $A \times B$ are $(1,3),(2,5),(3,3)$, find its remaining elements.
Solution: We can first observe that $6 = 3 \times 2 = 2 \times 3$ so that A can contain 2 or 3 elements; B can contain 3 or 2 elements. Using definition of cartesian product of two sets, we get that $A= \{ 1,2,3\}$ and $\{ 3,5\}$ and so we have found the sets A and B completely.
E.g.: Express the set $\{ (x,y) : x^{2}+y^{2}=25, x, y \in \mathbb{W}\}$ as a set of ordered pairs.
Solution: We have $x^{2}+y^{2}=25$ and so
$x=0, y=5 \Longrightarrow x^{2}+y^{2}=0+25=25$
$x=3, y=4 \Longrightarrow x^{2}+y^{2}=9+16=25$
$x=4, y=3 \Longrightarrow x^{2}+y^{2}=16+9=25$
$x=5, y=0 \Longrightarrow x^{2}+y^{2}=25+0=25$
Hence, the given set is $\{ (0,5),(3,4),(4,3),(5,0)\}$
E.g.: Let $A = \{ 1,2,3\}$ and $B = \{ 2,4,6\}$. Show that $R = \{ (1,2),(1,4),(3,2),(3,4)\}$ is a relation from A to B. Find the domain, co-domain and range.
Solution: Here, $A \times B = \{ (1,2),(1,4),(1,6),(2,2),(2,4),(2,6),(3,2),(3,4),(3,6)\}$. Clearly, $R \subseteq A \times B$. So R is a relation from A to B. The domain of R is the set of first components of R (which belong to set A, by definition of cartesian product and ordered pair) and the codomain is set B. So, Domain (R) = $\{ 1,3\}$ and co-domain of R is set B itself; and Range of R is $\{ 2,4\}$.
E.g.: Let $A = \{ 1,2,3,4,5\}$ and $B = \{ 1,4,5\}$. Let R be a relation from A to B such that $(x,y) \in R$ if $x. List all the elements of R. Find the domain, codomain and range of R. (as homework quiz, draw its arrow diagram);
Solution: Let $A = \{ 1,2,3,4,5\}$ and $B = \{ 1,4,5\}$. So, we get R as $(1,4),(1,5),(2,4),(2,5),(3,4),(3,5),(4,5)$. $domain(R) = \{ 1,2,3,4\}$, $codomain(R) = B$, and $range(R) = \{ 4,5\}$.
E.g. Let $A = \{ 1,2,3,4,5,6\}$. Define a binary relation on A such that $R = \{ (x,y) : y=x+1\}$. Find the domain, codomain and range of R.
Solution: By definition, $R \subseteq A \times A$. Here, we get $R = \{ (1,2),(2,3),(3,4),(4,5),(5,6)\}$. So we get $domain (R) = \{ 1,2,3,4,5\}$, $codomain(R) =A$, $range(R) = \{ 2,3,4,5,6\}$
Tutorial problems:
1. If $(x-1,y+4)=(1,2)$, find the values of x and y.
2. If $(x + \frac{1}{3}, \frac{y}{2}-1)=(\frac{1}{2} , \frac{3}{2} )$
3. If $A=\{ a,b,c\}$ and $B = \{ x,y\}$. Find out the following: $A \times A$, $B \times B$, $A \times B$ and $B \times A$.
4. If $P = \{ 1,2,3\}$ and $Q = \{ 4\}$, find the sets $P \times P$, $Q \times Q$, $P \times Q$, and $Q \times P$.
5. Let $A=\{ 1,2,3,4\}$ and $\{ 4,5,6\}$ and $C = \{ 5,6\}$. Find $A \times (B \bigcap C)$, $A \times (B \bigcup C)$, $(A \times B) \bigcap (A \times C)$, $A \times (B \bigcup C)$, and $(A \times B) \bigcup (A \times C)$.
6. Express $\{ (x,y) : x^{2}+y^{2}=100 , x, y \in \mathbf{W}\}$ as a set of ordered pairs.
7. Write the domain and range of the following relations: (i) $\{ (a,b): a \in \mathbf{N}, a < 6, b=4\}$ (ii) $\{ (a,b): a,b \in \mathbf{N}, a+b=12\}$ (iii) $\{ (2,4),(2,5),(2,6),(2,7)\}$
8. Let $A=\{ 6,8\}$ and $B=\{ 1,3,5\}$. Let $R = \{ (a,b): a \in A, b \in B, a+b \hspace{0.1in} is \hspace{0.1in} an \hspace{0.1in} even \hspace{0.1in} number\}$. Show that R is an empty relation from A to B.
9. Write the following relations in the Roster form and hence, find the domain and range: (i) $R_{1}= \{ (a,a^{2}) : a \hspace{0.1in} is \hspace{0.1in} prime \hspace{0.1in} less \hspace{0.1in} than \hspace{0.1in} 15\}$ (ii) $R_{2} = \{ (a, \frac{1}{a}) : 0 < a \leq 5, a \in N\}$
10. Write the following relations as sets of ordered pairs: (i) $\{ (x,y) : y=3x, x \in \{1,2,3 \}, y \in \{ 3,6,9,12\}\}$ (ii) $\{ (x,y) : y>x+1, x=1,2, y=2,4,6\}$ (iii) $\{ (x,y) : x+y =3, x, y \in \{ 0,1,2,3\}\}$
More later,
Nalin Pithwa
### Set Theory, Relations, Functions Preliminaries: I
In these days of conflict between ancient and modern studies there must surely be something to be said of a study which did not begin with Pythagoras and will not end with Einstein. — G H Hardy (On Set Theory)
In every day life, we generally talk about group or collection of objects. Surely, you must have used the words such as team, bouquet, bunch, flock, family for collection of different objects.
It is very important to determine whether a given object belongs to a given collection or not. Consider the following conditions:
i) Successful persons in your city.
ii) Happy people in your town.
iii) Clever students in your class.
iv) Days in a week.
v) First five natural numbers.
Perhaps, you have already studied in earlier grade(s) —- can you state which of the above mentioned collections are sets? Why? Check whether your answers are as follows:
First three collections are not examples of sets but last two collections represent sets. This is because in first three collections, we are not sure of the objects. The terms ‘successful persons’, ‘happy people’, ‘clever students’ are all relative terms. Here, the objects are not well-defined. In the last two collections, we can determine the objects clearly (meaning, uniquely, or without ambiguity). Thus, we can say that the objects are well-defined.
So what can be the definition of a set ? Here it goes:
A collection of well-defined objects is called a set. (If we continue to “think deep” about this definition, we are led to the famous paradox, which Bertrand Russell had discovered: Let C be a collection of all sets such which are not elements of themselves. If C is allowed to be a set, a contradiction arises when one inquires whether or not C is an element of itself. Now plainly, there is something suspicious about the idea of a set being an element of itself, and we shall take this as evidence that the qualification “well-defined” needs to be taken seriously. Bertrand Russell re-stated this famous paradox in a very interesting way: In the town of Seville lives a barber who shaves everyone who does not shave himself. Does the barber shave himself?…)
The objects in a set are called elements or members of that set.
We denote sets by capital letters : A, B, C etc. The elements of a set are represented by small letters : a, b, c, d, e, f ….etc. If x is an element of a set A, we write $x \in A$. And, we read it as “x belongs to A.” If x is not an element of a set A, we write $x \not\in A$, and read as ‘x does not belong to A.’e.g., 1 is a “whole” number but not a “natural” number.
Hence, $0 \in W$, where W is the set of whole numbers and $0 \not\in N$, where N is a set of natural numbers.
There are two methods of representing a set:
a) Roster or Tabular Method or List Method (b) Set-Builder or Ruler Method
a) Roster or Tabular or List Method:
Let A be the set of all prime numbers less than 20. Can you enumerate all the elements of the set A? Are they as follows?
$A=\{ 2,3,5,7,11,15,17,19\}$
Can you describe the roster method? We can describe it as follows:
In the Roster method, we list all the elements of the set within braces $\{, \}$ and separate the elements by commas.
In the following examples, state the sets using Roster method:
i) B is the set of all days in a week
ii) C is the set of all consonants in English alphabets.
iii) D is the set of first ten natural numbers.
2) Set-Builder Method:
Let P be the set of first five multiples of 10. Using Roster Method, you must have written the set as follows:
$P = \{ 10, 20, 30, 40, 50\}$
Question: What is the common property possessed by all the elements of the set P?
Answer: All the elements are multiples of 10.
Question: How many such elements are in the set?
Answer: There are 5 elements in the set.
Thus, the set P can be described using this common property. In such a case, we say that set-builder method is used to describe the set. So, to summarize:
In the set-builder method, we describe the elements of the set by specifying the property which determines the elements of the set uniquely.
Thus, we can write : $P = \{ x: x =10n, n \in N, n \leq 5\}$
In the following examples, state the sets using set-builder method:
i) Y is the set of all months of a year
ii) M is the set of all natural numbers
iii) B is the set of perfect squares of natural numbers.
Also, if elements of a set are repeated, they are written once only; while listing the elements of a set, the order in which the elements are listed is immaterial. (but this situation changes when we consider sets from the view-point of permutations and combinations. Just be alert in set-theoretic questions.)
Subset: A set A is said to be a subset of a set B if each element of set A is an element of set B. Symbolically, $A \subseteq B$.
Superset: If $A \subset B$, then B is called the superset of set A. Symbolically: $B \supset A$
Proper Subset: A non empty set A is said to be a proper subset of the set B, if and only if all elements of set A are in set B, and at least one element of B is not in A. That is, if $A \subseteq B$, but $A \neq B$ then A is called a proper subset of B and we write $A \subset B$.
Note: the notations of subset and proper subset differ from author to author, text to text or mathematician to mathematician. These notations are not universal conventions in math.
Intervals:
1. Open Interval : given $a < b$, $a, b \in R$, we say $a is an open interval in $\Re^{1}$.
2. Closed Interval : given $a \leq x \leq b = [a,b]$
3. Half-open, half-closed: $a , or $a \leq x
4. The set of all real numbers greater than or equal to a : $x \geq a =[a, \infty)$
5. The set of all real numbers less than or equal to a is $(-\infty, a] = x \leq a$
Types of Sets:
1. Empty Set: A set containing no element is called the empty set or the null set and is denoted by the symbol $\phi$ or $\{ \}$ or void set. e.g., $A= \{ x: x \in N, 1
2. Singleton Set: A set containing only one element is called a singleton set. Example : (i) Let A be a set of all integers which are neither positive nor negative. Then, $A = \{ 0\}$ and example (ii) Let B be a set of capital of India. Then $B= \{ Delhi\}$
We will define the following sets later (after we giving a working definition of a function): finite set, countable set, infinite set, uncountable set.
3. Equal sets: Two sets are said to be equal if they contain the same elements, that is, if $A \subseteq B$ and $B \subseteq A$. For example: Let X be the set of letters in the word ‘ABBA’ and Y be the set of letters in the word ‘BABA’. Then, $X= \{ A,B\}$ and $Y= \{ B,A\}$. Thus, the sets $X=Y$ are equal sets and we denote it by $X=Y$.
How to prove that two sets are equal?
Let us say we are given the task to prove that $A=B$, where A and B are non-empty sets. The following are the steps of the proof : (i) TPT: $A \subset B$, that is, choose any arbitrary element $x \in A$ and show that also $x \in B$ holds true. (ii) TPT: $B \subset A$, that is, choose any arbitrary element $y \in B$, and show that also $y \in A$. (Note: after we learn types of functions, we will see that a fundamental way to prove two sets (finite) are equal is to show/find a bijection between the two sets).
PS: Note that two sets are equal if and only if they contain the same number of elements, and the same elements. (irrespective of order of elements; once again, the order condition is changed for permutation sets; just be alert what type of set theoretic question you are dealing with and if order is important in that set. At least, for our introduction here, order of elements of a set is not important).
PS: Digress: How to prove that in general, $x=y$? The standard way is similar to above approach: (i) TPT: $x < y$ (ii) TPT: $y < x$. Both (i) and (ii) together imply that $x=y$.
4. Equivalent sets: Two finite sets A and B are said to be equivalent if $n(A)=n(B)$. Equal sets are always equivalent but equivalent sets need not be equal. For example, let $A= \{ 1,2,3 \}$ and $B = \{ 4,5,6\}$. Then, $n(A) = n(B)$, so A and B are equivalent. Clearly, $A \neq B$. Thus, A and B are equivalent but not equal.
5. Universal Set: If in a particular discussion all sets under consideration are subsets of a set, say U, then U is called the universal set for that discussion. You know that the set of natural numbers the set of integers are subsets of set of real numbers R. Thus, for this discussion is a universal set. In general, universal set is denoted by or X.
6. Venn Diagram: The pictorial representation of a set is called Venn diagram. Generally, a closed geometrical figures are used to represent the set, like a circle, triangle or a rectangle which are known as Venn diagrams and are named after the English logician John Venn.
In Venn diagram the elements of the sets are shown in their respective figures.
Now, we have these “abstract toys or abstract building-blocks”, how can we get new such “abstract buildings” using these “abstract building blocks”. What I mean is that we know that if we are a set of numbers like 1,2,3, …, we know how to get “new numbers” out of these by “adding”, subtracting”, “multiplying” or “dividing” the given “building blocks like 1, 2…”. So, also what we want to do now is “operations on sets” so that we create new, more interesting or perhaps, more “useful” sets out of given sets. We define the following operations on sets:
1. Complement of a set: If A is a subset of the universal set U then the set of all elements in U which are not in A is called the complement of the set A and is denoted by $A^{'}$ or $A^{c}$ or $\overline{A}$ Some properties of complements: (i) ${A^{'}}^{'}=A$ (ii) $\phi^{'}=U$, where U is universal set (iii) $U^{'}= \phi$
2. Union of Sets: If A and B are two sets then union of set A and set B is the set of all elements which are in set A or set B or both set A and set B. (this is the INCLUSIVE OR in digital logic) and the symbol is : \$latex A \bigcup B
3. Intersection of sets: If A and B are two sets, then the intersection of set A and set B is the set of all elements which are both in A and B. The symbol is $A \bigcap B$.
4. Disjoint Sets: Let there be two sets A and B such that $A \bigcap B=\phi$. We say that the sets A and B are disjoint, meaning that they do not have any elements in common. It is possible that there are more than two sets $A_{1}, A_{2}, \ldots A_{n}$ such that when we take any two distinct sets $A_{i}$ and $A_{j}$ (so that $i \neq j$, then $A_{i}\bigcap A_{j}= \phi$. We call such sets pairwise mutually disjoint. Also, in case if such a collection of sets also has the property that $\bigcup_{i=1}^{i=n}A_{i}=U$, where U is the Universal Set in the given context, We then say that this collection of sets forms a partition of the Universal Set.
5. Difference of Sets: Let us say that given a universal set U and two other sets A and B, $B-A$ denotes the set of elements in B which are not in A; if you notice, this is almost same as $A^{'}=U-A$.
6. Symmetric Difference of Sets: Suppose again that we are two given sets A and B, and a Universal Set U, by symmetric difference of A and B, we mean $(A-B)\bigcup (B-A)$. The symbol is $A \triangle B.$ Try to visualize this (and describe it) using a Venn Diagram. You will like it very much. Remark : The designation “symmetric difference” for the set $A \triangle B$ is not too apt, since $A \triangle B$ has much in common with the sum $A \bigcup B$. In fact, in $A \bigcup B$ the statements “x belongs to A” and “x belongs to B” are joined by the conjunction “or” used in the “either …or …or both…” sense, while in $A \triangle B$ the same two statements are joined by “or” used in the ordinary “either…or….” sense (as in “to be or not to be”). In other words, x belongs to $A \bigcup B$ if and only if x belongs to either A or B or both, while x belongs to $A \triangle B$ if and only if x belongs to either A or B but not both. The set $A \triangle B$ can be regarded as a kind of a “modulo-two-sum” of the sets A and B, that is, a sum of the sets A and B in which elements are dropped if they are counted twice (once in A and once in B).
Let us now present some (easily provable/verifiable) properties of sets:
1. $A \bigcup B = B \bigcup A$ (union of sets is commutative)
2. $(A \bigcup B) \bigcup C = A \bigcup (B \bigcup C)$ (union of sets is associative)
3. $A \bigcup \phi=A$
4. $A \bigcup A = A$
5. $A \bigcup A^{'}=U$ where U is universal set
6. If $A \subseteq B$, then $A \bigcup B=B$
7. $U \bigcup A=U$
8. $A \subseteq (A \bigcup B)$ and also $B \subseteq (A \bigcup B)$
Similarly, some easily verifiable properties of set intersection are:
1. $A \bigcap B = B \bigcap A$ (set intersection is commutative)
2. $(A \bigcap B) \bigcap C = A \bigcap (B \bigcap C)$ (set intersection is associative)
3. $A \bigcap \phi = \phi \bigcap A= \phi$ (this matches intuition: there is nothing common in between a non empty set and an empty set :-))
4. $A \bigcap A =A$ (Idempotent law): this definition carries over to square matrices: if a square matrix is such that $A^{2}=A$, then A is called an Idempotent matrix.
5. $A \bigcap A^{'}=\phi$ (this matches intuition: there is nothing in common between a set and another set which does not contain any element of it (the former set))
6. If $A \subseteq B$, then $A \bigcap B =A$
7. $U \bigcap A=A$, where U is universal set
8. $(A \bigcap B) \subseteq A$ and $(A \bigcap B) \subseteq B$
9. i: $A \bigcap (B \bigcap )C = (A \bigcap B)\bigcup (A \bigcap C)$ (intersection distributes over union) ; (9ii) $A \bigcup (B \bigcap C)=(A \bigcup B) \bigcap (A \bigcup C)$ (union distributes over intersection). These are the two famous distributive laws.
The famous De Morgan’s Laws for two sets are as follows: (it can be easily verified by Venn Diagram):
For any two sets A and B, the following holds:
i) $(A \bigcup B)^{'}=A^{'}\bigcap B^{'}$. In words, it can be captured beautifully: the complement of union is intersection of complements.
ii) $(A \bigcap B)^{'}=A^{'} \bigcup B^{'}$. In words, it can be captured beautifully: the complement of intersection is union of complements.
Cardinality of a set: (Finite Set) : (Again, we will define the term ‘finite set’ rigorously later) The cardinality of a set is the number of distinct elements contained in a finite set A and we will denote it as $n(A)$.
Inclusion Exclusion Principle:
For two sets A and B, given a universal set U: $n(A \bigcup B) = n(A) + n(B) - n(A \bigcap B)$.
For three sets A, B and C, given a universal set U: $n(A \bigcup B \bigcup C)=n(A) + n(B) + n(C) -n(A \bigcap B) -n(B \bigcap C) -n(C \bigcup A) + n(A \bigcap B \bigcap C)$.
Homework Quiz: Verify the above using Venn Diagrams.
Power Set of a Set:
Let us consider a set A (given a Universal Set U). Then, the power set of A is the set consisting of all possible subsets of set A. (Note that an empty is also a subset of A and that set A is a subset of A itself). It can be easily seen (using basic definition of combinations) that if $n(A)=p$, then $n(power set A) = 2^{p}$. Symbol: $P(A)$.
Homework Tutorial I:
1. Describe the following sets in Roster form: (i) $\{ x: x \hspace{0.1in} is \hspace{0.1in} a \hspace{0.1in} letter \hspace{0.1in} of \hspace{0.1in} the \hspace{0.1in} word \hspace{0.1in} PULCHRITUDE\}$ (II) $\{ x: x \hspace{0.1in } is \hspace{0.1in} an \hspace{0.1in} integer \hspace{0.1in} with \hspace{0.1in} \frac{-1}{2} < x < \frac{1}{2} \}$ (iii) $\{x: x=2n, n \in N\}$
2. Describe the following sets in Set Builder form: (i) $\{ 0\}$ (ii) $\{ 0, \pm 1, \pm 2, \pm 3\}$ (iii) $\{ \}$
3. If $A= \{ x: 6x^{2}+x-15=0\}$ and $B= \{ x: 2x^{2}-5x-3=0\}$, and $x: 2x^{2}-x-3=0$, then find (i) $A \bigcup B \bigcup C$ (ii) $A \bigcap B \bigcap C$
4. If A, B, C are the sets of the letters in the words, ‘college’, ‘marriage’, and ‘luggage’ respectively, then verify that $\{ A-(B \bigcup C)\}= \{ (A-B) \bigcap (A-C)\}$
5. If $A= \{ 1,2,3,4\}$, $B= \{ 3,4,5, 6\}$, $C= \{ 4,5,6,7,8\}$ and universal set $X= \{ 1,2,3,4,5,6,7,8,9,10\}$, then verify the following:
5i) $A\bigcup (B \bigcap C) = (A\bigcup B) \bigcap (A \bigcup C)$
5ii) $A \bigcap (B \bigcup C)= (A \bigcap B) \bigcup (A \bigcap C)$
5iii) $A= (A \bigcap B)\bigcup (A \bigcap B^{'})$
5iv) $B=(A \bigcap B)\bigcup (A^{'} \bigcap B)$
5v) $n(A \bigcup B)= n(A)+n(B)-n(A \bigcap B)$
6. If A and B are subsets of the universal set is X, $n(X)=50$, $n(A)=35$, $n(B)=20$, $n(A^{'} \bigcap B^{'})=5$, find (i) $n(A \bigcup B)$ (ii) $n(A \bigcap B)$ (iii) $n(A^{'} \bigcap B)$ (iv) $n(A \bigcap B^{'})$
7. In a class of 200 students who appeared certain examinations, 35 students failed in MHTCET, 40 in AIEEE, and 40 in IITJEE entrance, 20 failed in MHTCET and AIEEE, 17 in AIEEE and IITJEE entrance, 15 in MHTCET and IITJEE entrance exam and 5 failed in all three examinations. Find how many students (a) did not flunk in any examination (b) failed in AIEEE or IITJEE entrance.
8. From amongst 2000 literate and illiterate individuals of a town, 70 percent read Marathi newspaper, 50 percent read English newspapers, and 32.5 percent read both Marathi and English newspapers. Find the number of individuals who read
8i) at least one of the newspapers
8ii) neither Marathi and English newspaper
8iii) only one of the newspapers
9) In a hostel, 25 students take tea, 20 students take coffee, 15 students take milk, 10 students take both tea and coffee, 8 students take both milk and coffee. None of them take the tea and milk both and everyone takes at least one beverage, find the number of students in the hostel.
10) There are 260 persons with a skin disorder. If 150 had been exposed to chemical A, 74 to chemical B, and 36 to both chemicals A and B, find the number of persons exposed to (a) Chemical A but not Chemical B (b) Chemical B but not Chemical A (c) Chemical A or Chemical B.
11) If $A = \{ 1,2,3\}$ write down the power set of A.
12) Write the following intervals in Set Builder Form: (a) $(-3,0)$ (b) $[6,12]$ (c) $(6,12]$ (d) $[-23,5)$
13) Using Venn Diagrams, represent (a) $(A \bigcup B)^{'}$ (b) $A^{'} \bigcup B^{'}$ (c) $A^{'} \bigcap B$ (d) $A \bigcap B^{'}$
Regards,
Nalin Pithwa.
### References for IITJEE Foundation Mathematics and Pre-RMO (Homi Bhabha Foundation/TIFR)
1. Algebra for Beginners (with Numerous Examples): Isaac Todhunter (classic text): Amazon India link: https://www.amazon.in/Algebra-Beginners-Isaac-Todhunter/dp/1357345259/ref=sr_1_2?s=books&ie=UTF8&qid=1547448200&sr=1-2&keywords=algebra+for+beginners+todhunter
2. Algebra for Beginners (including easy graphs): Metric Edition: Hall and Knight Amazon India link: https://www.amazon.in/s/ref=nb_sb_noss?url=search-alias%3Dstripbooks&field-keywords=algebra+for+beginners+hall+and+knight
3. Elementary Algebra for School: Metric Edition: https://www.amazon.in/Elementary-Algebra-School-H-Hall/dp/8185386854/ref=sr_1_5?s=books&ie=UTF8&qid=1547448497&sr=1-5&keywords=elementary+algebra+for+schools
4. Higher Algebra: Hall and Knight: Amazon India link: https://www.amazon.in/Higher-Algebra-Knight-ORIGINAL-MASPTERPIECE/dp/9385966677/ref=sr_1_6?s=books&ie=UTF8&qid=1547448392&sr=1-6&keywords=algebra+for+beginners+hall+and+knight
5. Plane Trigonometry: Part I: S L Loney: https://www.amazon.in/Plane-Trigonometry-Part-1-S-L-Loney/dp/938592348X/ref=sr_1_16?s=books&ie=UTF8&qid=1547448802&sr=1-16&keywords=plane+trigonometry+part+1+by+s.l.+loney
The above references are a must. Best time to start is from standard VII or standard VIII.
-Nalin Pithwa.
### Pre RMO Practice question: 2018: How long does it take for a news to go viral in a city? And, a cyclist vs horseman
Problem 1:
Some one arrives in a city with very interesting news and within 10 minutes tells it to two others. Each of these tells the news within 10 minutes to two others(who have not heard it yet), and so on. How long will it take before everyone in the city has heard the news if the city has three million inhabitants?
Problem 2:
A cyclist and a horseman have a race in a stadium. The course is five laps long. They spend the same time on the first lap. The cyclist travels each succeeding lap 1.1 times more slowly than he does the preceding one. On each lap the horseman spends d minutes more than he spent on the preceding lap. They each arrive at the finish line at the same time. Which of them spends the greater amount of time on the fifth lap and how much greater is this amount of time?
I hope you enjoy “mathematizing” every where you see…
Good luck for the Pre RMO in Aug 2018!
Nalin Pithwa.
### How to solve equations: Dr. Vicky Neale: useful for Pre-RMO or even RMO training
Dr. Neale simply beautifully nudges, gently encourages mathematics olympiad students to learn to think further on their own…
### A nice dose of practice problems for IITJEE Foundation math and PreRMO
It is said that “practice makes man perfect”.
Problem 1:
Six boxes are numbered 1 through 6. How many ways are there to put 20 identical balls into these boxes so that none of them is empty?
Problem 2:
How many ways are there to distribute n identical balls in m numbered boxes so that none of the boxes is empty?
Problem 3:
Six boxes are numbered 1 through 6. How many ways are there to distribute 20 identical balls between the boxes (this time some of the boxes can be empty)?
Finish this triad of problems now!
Nalin Pithwa.
### IITJEE Foundation Math and PRMO (preRMO) practice: another random collection of questions
Problem 1: Find the value of $\frac{x+2a}{2b--x} + \frac{x-2a}{2a+x} + \frac{4ab}{x^{2}-4b^{2}}$ when $x=\frac{ab}{a+b}$
Problem 2: Reduce the following fraction to its lowest terms:
$(\frac{1}{x} + \frac{1}{y} + \frac{1}{z}) \div (\frac{x+y+z}{x^{2}+y^{2}+z^{2}-xy-yz-zx} - \frac{1}{x+y+z})+1$
Problem 3: Simplify: $\sqrt[4]{97-56\sqrt{3}}$
Problem 4: If $a+b+c+d=2s$, prove that $4(ab+cd)^{2}-(a^{2}+b^{2}-c^{2}-d^{2})^{2}=16(s-a)(s-b)(s-c)(s-d)$
Problem 5: If a, b, c are in HP, show that $(\frac{3}{a} + \frac{3}{b} - \frac{2}{c})(\frac{3}{c} + \frac{3}{b} - \frac{2}{a})+\frac{9}{b^{2}}=\frac{25}{ac}$.
May u discover the joy of Math! 🙂 🙂 🙂
Nalin Pithwa.
### Pre-RMO (PRMO) Practice Problems
Pre-RMO days are back again. Here is a list of some of my random thoughts:
Problem 1:
There are five different teacups, three saucers, and four teaspoons in the “Tea Party” store. How many ways are there to buy two items with different names?
Problem 2:
We call a natural number “odd-looking” if all of its digits are odd. How many four-digit odd-looking numbers are there?
Problem 3:
We toss a coin three times. How many different sequences of heads and tails can we obtain?
Problem 4:
Each box in a 2 x 2 table can be coloured black or white. How many different colourings of the table are there?
Problem 5:
How many ways are there to fill in a Special Sport Lotto card? In this lotto, you must predict the results of 13 hockey games, indicating either a victory for one of two teams, or a draw.
Problem 6:
The Hermetian alphabet consists of only three letters: A, B and C. A word in this language is an arbitrary sequence of no more than four letters. How many words does the Hermetian language contain?
Problem 7:
A captain and a deputy captain must be elected in a soccer team with 11 players. How many ways are there to do this?
Problem 8:
How many ways are there to sew one three-coloured flag with three horizontal strips of equal height if we have pieces of fabric of six colours? We can distinguish the top of the flag from the bottom.
Problem 9:
How many ways are there to put one white and one black rook on a chessboard so that they do not attack each other?
Problem 10:
How many ways are there to put one white and one black king on a chessboard so that they do not attack each other?
I will post the answers in a couple of days.
Nalin Pithwa.
### Three in a row !!!
If my first were a 4,
And, my second were a 3,
What I am would be double,
The number you’d see.
For I’m only three digits,
Just three in a row,
So what must I be?
Don’t say you don’t know!
Cheers,
Nalin Pithwa. | 2019-09-22 12:42:00 | {"extraction_info": {"found_math": true, "script_math_tex": 0, "script_math_asciimath": 0, "math_annotations": 0, "math_alttext": 0, "mathml": 0, "mathjax_tag": 0, "mathjax_inline_tex": 0, "mathjax_display_tex": 0, "mathjax_asciimath": 0, "img_math": 362, "codecogs_latex": 0, "wp_latex": 0, "mimetex.cgi": 0, "/images/math/codecogs": 0, "mathtex.cgi": 0, "katex": 0, "math-container": 0, "wp-katex-eq": 0, "align": 0, "equation": 0, "x-ck12": 0, "texerror": 0, "math_score": 0.9647656083106995, "perplexity": 602.2883204159482}, "config": {"markdown_headings": true, "markdown_code": true, "boilerplate_config": {"ratio_threshold": 0.18, "absolute_threshold": 10, "end_threshold": 15, "enable": true}, "remove_buttons": true, "remove_image_figures": true, "remove_link_clusters": true, "table_config": {"min_rows": 2, "min_cols": 3, "format": "plain"}, "remove_chinese": true, "remove_edit_buttons": true, "extract_latex": true}, "warc_path": "s3://commoncrawl/crawl-data/CC-MAIN-2019-39/segments/1568514575513.97/warc/CC-MAIN-20190922114839-20190922140839-00541.warc.gz"} |
http://math.stackexchange.com/questions/222974/probability-of-getting-2-aces-2-kings-and-1-queen-in-a-five-card-poker-hand-pa | # Probability of getting 2 Aces, 2 Kings and 1 Queen in a five card poker hand (Part II)
So I reworked my formula in method 1 after getting help with my original question - Probability of getting 2 Aces, 2 Kings and 1 Queen in a five card poker hand. But I am still getting results that differ...although they are much much closer than before, but I must still be making a mistake somewhere in method 1. Anyone know what it is?
Method 1
$P(2A \cap 2K \cap 1Q) = P(Q|2A \cap 2K)P(2A|2K)P(2K)$
$$= \frac{1}{12}\frac{{4 \choose 2}{46 \choose 1}}{50 \choose 3}\frac{{4 \choose 2}{48 \choose 3}}{52 \choose 5}$$
$$= \frac{(6)(17296)(6)(46)}{(2598960)(19600)(12)}$$
$$= 4.685642 * 10^{-5}$$
Method 2
$$\frac{{4 \choose 2} {4 \choose 2}{4 \choose 1}}{52 \choose 5} = \frac{3}{54145}$$
$$5.540678 * 10^{-5}$$
-
Please make an effort to make the question self-contained and provide a link to your earlier question. – Sasha Oct 28 '12 at 19:56
I think we would rather ahve you edit your initial question by adding your new progress. This avoids having loss of answer and keeps track of progress – Jean-Sébastien Oct 28 '12 at 19:56
But there already answers to my original question so those answers would not make sense now that I am using a new formula for method 1. – sonicboom Oct 28 '12 at 20:03
Conditional probability arguments can be delicate. Given that there are exactly two Kings, what's the $46$ doing? That allows the possibility of more Kings. – André Nicolas Oct 28 '12 at 20:26
The $46$ is because have already taken two kings from the pack leaving us with 50. And now we have chosen 2 aces and we have to pick the other 1 card from the 50 remaining cards less the 4 aces? – sonicboom Oct 28 '12 at 20:42
show 1 more comment
$$\frac{1}{11}\frac{{4 \choose 2}{44 \choose 1}}{48 \choose 3}\frac{{4 \choose 2}{48 \choose 3}}{52 \choose 5}$$
If you wrote this as $$\frac{{4 \choose 2}{48 \choose 3}}{52 \choose 5}\frac{{4 \choose 2}{44 \choose 1}}{48 \choose 3}\frac{{4 \choose 1}{40 \choose 0}}{44 \choose 1}$$ it might be more obvious why they are the same. | 2014-03-07 11:01:44 | {"extraction_info": {"found_math": true, "script_math_tex": 0, "script_math_asciimath": 0, "math_annotations": 0, "math_alttext": 0, "mathml": 0, "mathjax_tag": 0, "mathjax_inline_tex": 1, "mathjax_display_tex": 1, "mathjax_asciimath": 0, "img_math": 0, "codecogs_latex": 0, "wp_latex": 0, "mimetex.cgi": 0, "/images/math/codecogs": 0, "mathtex.cgi": 0, "katex": 0, "math-container": 0, "wp-katex-eq": 0, "align": 0, "equation": 0, "x-ck12": 0, "texerror": 0, "math_score": 0.7363124489784241, "perplexity": 334.5089065648005}, "config": {"markdown_headings": true, "markdown_code": true, "boilerplate_config": {"ratio_threshold": 0.18, "absolute_threshold": 10, "end_threshold": 15, "enable": true}, "remove_buttons": true, "remove_image_figures": true, "remove_link_clusters": true, "table_config": {"min_rows": 2, "min_cols": 3, "format": "plain"}, "remove_chinese": true, "remove_edit_buttons": true, "extract_latex": true}, "warc_path": "s3://commoncrawl/crawl-data/CC-MAIN-2014-10/segments/1393999642170/warc/CC-MAIN-20140305060722-00084-ip-10-183-142-35.ec2.internal.warc.gz"} |
https://www.stat.math.ethz.ch/pipermail/r-help/2008-June/166104.html | # [R] Sweave: controlling pointsize (pdf)
Lauri Nikkinen lauri.nikkinen at iki.fi
Fri Jun 27 13:37:49 CEST 2008
Yes, I think so too. I already tried with
options(SweaveHooks=list(fig=function() pdf(pointsize=10)))
but as you said it tries to open pdf device and Sweaving fails...
Best
Lauri
2008/6/27, Duncan Murdoch <murdoch at stats.uwo.ca>:
> On 27/06/2008 7:12 AM, Lauri Nikkinen wrote:
> > pdf.options() seems to be a new function (from 2.7.0), so I quess I'll
> > have to upgrade or write my own hook function for Sweave. Thanks.
> >
>
> I'd recommend upgrading. I think it would be difficult to do this with a
> hook function: you'd basically need to close the pdf file that Sweave
> opened, and reopen it with new args --- but I don't think it's easy for you
> to determine the filename that Sweave would have used. You probably need to
> look at sys.frame(-2)$chunkprefix or something equally ugly. > > Duncan Murdoch > > > > > > Best > > Lauri > > > > 2008/6/27, Duncan Murdoch <murdoch at stats.uwo.ca>: > > > > > On 27/06/2008 6:23 AM, Lauri Nikkinen wrote: > > > > > > > I'm working with Windows XP and R 2.6.0 > > > > > > > > > > > > > R.Version() > > > > > > > > > > > > > >$platform
> > > > [1] "i386-pc-mingw32"
> > > >
> > > > -Lauri
> > > >
> > > > 2008/6/27, Lauri Nikkinen <lauri.nikkinen at iki.fi>:
> > > >
> > > >
> > > > > Hello,
> > > > >
> > > > > Is there a way to control pointsize of pdf:s produced by Sweave? I
> > > > > would like to have the same pointsize from (not a working example)
> > > > >
> > > > >
> > > >
> > > You could use a pdf.options() call in an early chunk in the file, and it
> > > will apply to subsequent chunks.
> > >
> > > For some other cases you might want code to be executed before every
> figure;
> > > that could be put in a hook function (as described in ?Sweave, and in
> the
> > > Sweave manual).
> > >
> > > Duncan Murdoch
> > >
> > >
> > > >
> > > > > pdf(file="C:/temp/example.pdf", width=7, height=7, bg="white",
> > > > >
> > > >
> > > pointsize=10)
> > >
> > > >
> > > > > plot(1:10)
> > > > > etc..
> > > > > dev.off()
> > > > >
> > > > > as
> > > > >
> > > > > \documentclass[a4paper]{article}
> > > > > \usepackage[latin1]{inputenc}
> > > > > \usepackage[finnish]{babel}
> > > > > \usepackage[T1]{fontenc}
> > > > >
> > > > >
> > > >
> > >
> \usepackage{C:/progra\string~1/R/R-26\string~1.0/share/texmf/Sweave}
> > >
> > > >
> > > > > <<fig=TRUE, width=7, height=7>>=
> > > > > plot(1:10)
> > > > > etc..
> > > > > @
> > > > >
> > > > > \end{document}
> > > > >
> > > > > Regards
> > > > > Lauri
> > > > >
> > > > >
> > > > >
> > > > ______________________________________________
> > > > R-help at r-project.org mailing list
> > > > https://stat.ethz.ch/mailman/listinfo/r-help
> > > >
> > > http://www.R-project.org/posting-guide.html
> > >
> > > > and provide commented, minimal, self-contained, reproducible code.
> > > >
> > > >
> > >
> > >
> >
> > ______________________________________________
> > R-help at r-project.org mailing list
> > https://stat.ethz.ch/mailman/listinfo/r-help | 2022-05-27 16:55:29 | {"extraction_info": {"found_math": true, "script_math_tex": 0, "script_math_asciimath": 0, "math_annotations": 0, "math_alttext": 0, "mathml": 0, "mathjax_tag": 0, "mathjax_inline_tex": 1, "mathjax_display_tex": 0, "mathjax_asciimath": 1, "img_math": 0, "codecogs_latex": 0, "wp_latex": 0, "mimetex.cgi": 0, "/images/math/codecogs": 0, "mathtex.cgi": 0, "katex": 0, "math-container": 0, "wp-katex-eq": 0, "align": 0, "equation": 0, "x-ck12": 0, "texerror": 0, "math_score": 0.8736045956611633, "perplexity": 6206.012528144832}, "config": {"markdown_headings": true, "markdown_code": true, "boilerplate_config": {"ratio_threshold": 0.18, "absolute_threshold": 10, "end_threshold": 15, "enable": true}, "remove_buttons": true, "remove_image_figures": true, "remove_link_clusters": true, "table_config": {"min_rows": 2, "min_cols": 3, "format": "plain"}, "remove_chinese": true, "remove_edit_buttons": true, "extract_latex": true}, "warc_path": "s3://commoncrawl/crawl-data/CC-MAIN-2022-21/segments/1652662658761.95/warc/CC-MAIN-20220527142854-20220527172854-00640.warc.gz"} |

Keiran Paster*, Marco Dos Santos*, Zhangir Azerbayev, Jimmy Ba
OpenWebMath is a dataset containing the majority of the high-quality, mathematical text from the internet. It is filtered and extracted from over 200B HTML files on Common Crawl down to a set of 6.3 million documents containing a total of 14.7B tokens. OpenWebMath is intended for use in pretraining and finetuning large language models.
You can download the dataset using Hugging Face:
from datasets import load_dataset
ds = load_dataset("open-web-math/open-web-math")
The dataset is structured as follows:
{
  "text": ...,  # document text.
  "url": ...,  # document url.
  "date": ...,  # date the page was crawled.
  "metadata": ...,  # JSON containing information from the extraction process.
}
OpenWebMath contains documents from over 130k different domains, including data from forums, educational pages, and blogs. The dataset contains documents covering mathematics, physics, statistics, computer science, and more. The following table shows the most common domains in OpenWebMath by character count.
| Domain | # Characters | % Characters |
|---|---|---|
| stackexchange.com | 4,655,132,784 | 9.55% |
| nature.com | 1,529,935,838 | 3.14% |
| wordpress.com | 1,294,166,938 | 2.66% |
| physicsforums.com | 1,160,137,919 | 2.38% |
| github.io | 725,689,722 | 1.49% |
| zbmath.org | 620,019,503 | 1.27% |
| wikipedia.org | 618,024,754 | 1.27% |
| groundai.com | 545,214,990 | 1.12% |
| blogspot.com | 520,392,333 | 1.07% |
| mathoverflow.net | 499,102,560 | 1.02% |
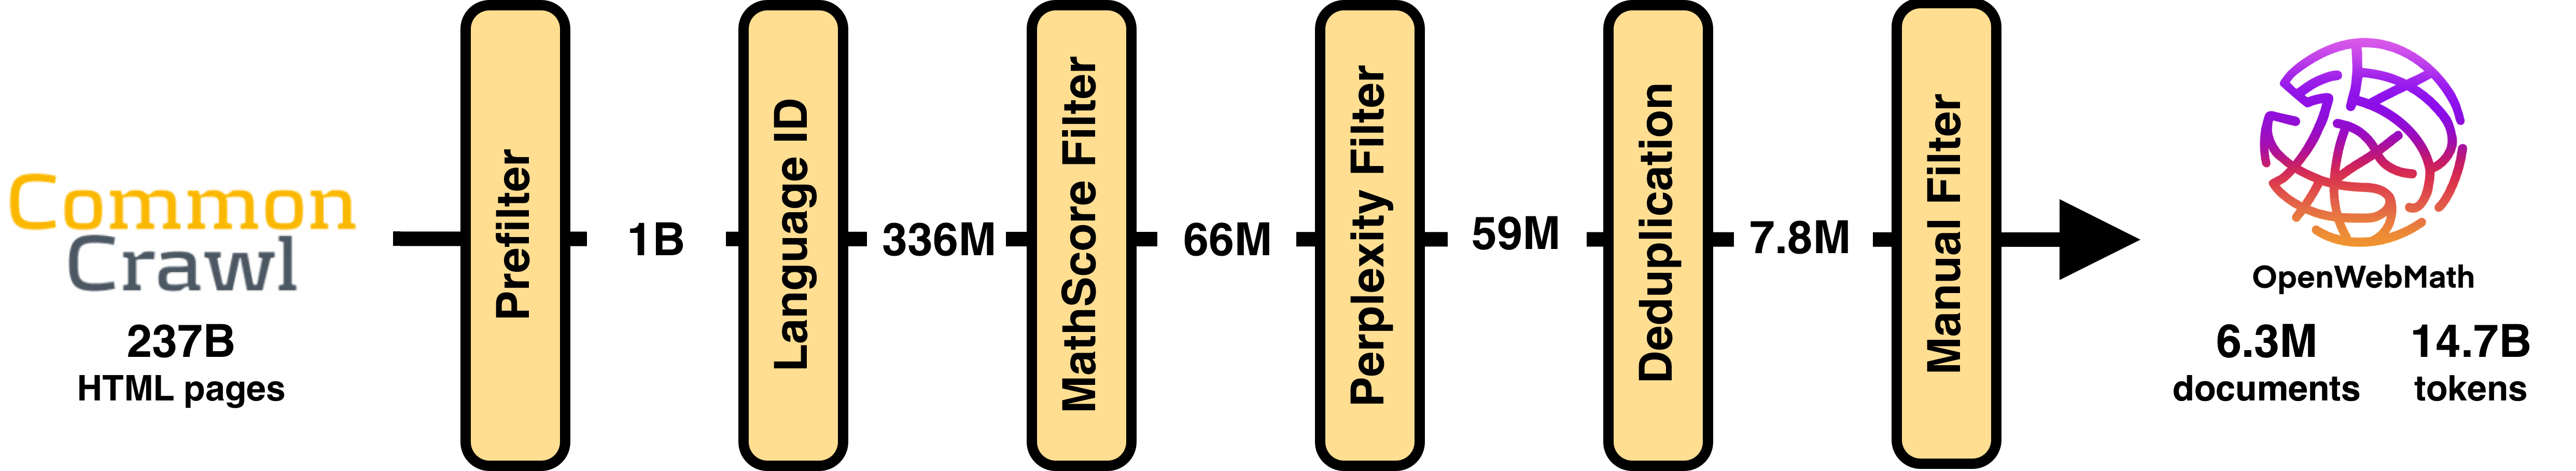
OpenWebMath builds on the massive Common Crawl dataset, which contains over 200B HTML documents. We filtered the data to only include documents that are: (1) in English, (2) contain mathematical content, and (3) are of high quality. We also put a strong emphasis on extracting LaTeX content from the HTML documents as well as reducing boilerplate in comparison to other web datasets.
The OpenWebMath pipeline consists of five steps:
For a detailed discussion on the processing pipeline, please refer to our paper.
OpenWebMath is made available under an ODC-By 1.0 license; users should also abide by the CommonCrawl ToU: https://commoncrawl.org/terms-of-use/. We do not alter the license of any of the underlying data.
@misc{paster2023openwebmath,
      title={OpenWebMath: An Open Dataset of High-Quality Mathematical Web Text},
      author={Keiran Paster and Marco Dos Santos and Zhangir Azerbayev and Jimmy Ba},
      year={2023},
      eprint={2310.06786},
      archivePrefix={arXiv},
      primaryClass={cs.AI}
}


