Datasets:

Production Press Sensor Data (P2S)
Dataset Summary
In this data set we provide sensor recordings of a part production process which contains a speed-based decoy which needs to be overcome. The production of parts in multiple progressive forming stages using stamping, deep drawing and bending operations with progressive dies is generally one of the most economically significant manufacturing processes in the sheet metal working industry and enables the production of complex parts on short process routes with consistent quality. This dataset contains sensor recordings of that process. The recording of the internal forces are provided as time series and based on these the task is to detect whether a run of the press resulted in a normal or faulty metal part. The sensor data has been recorded with different production speeds. The run speed does not affect whether the result in normal or faulty, but it changes the sensor recordings. The speed of a run can be a confounding factor, distracting models from the relevant data charateristics.
In addition to the sensor data, this dataset contains annotations on which parts of the sensor data are mostly influenced by different run speeds, i.e. which parts potentially confound a model. These annotations can be used to evaluate whether a model uses the confounders, and even to revise them.
Dataset Structure
The data was generated in 12 different experiments, over 6 different speeds, with either normal or faulty outcomes. Each sample includes: the sensor data (4096 steps), a binary annotation mask (4096 steps), the run speed and the label (normal/defect).
| Experiment | Outcome | Speed | Samples |
|---|---|---|---|
| 1 | Normal | 80 | 193 |
| 2 | Normal | 100 | 193 |
| 3 | Normal | 150 | 189 |
| 4 | Normal | 175 | 198 |
| 5 | Normal | 200 | 194 |
| 6 | Normal | 225 | 188 |
| 7 | Defect | 80 | 149 |
| 8 | Defect | 100 | 193 |
| 9 | Defect | 150 | 188 |
| 10 | Defect | 175 | 196 |
| 11 | Defect | 200 | 193 |
| 12 | Defect | 225 | 190 |
| Total | 2264 |
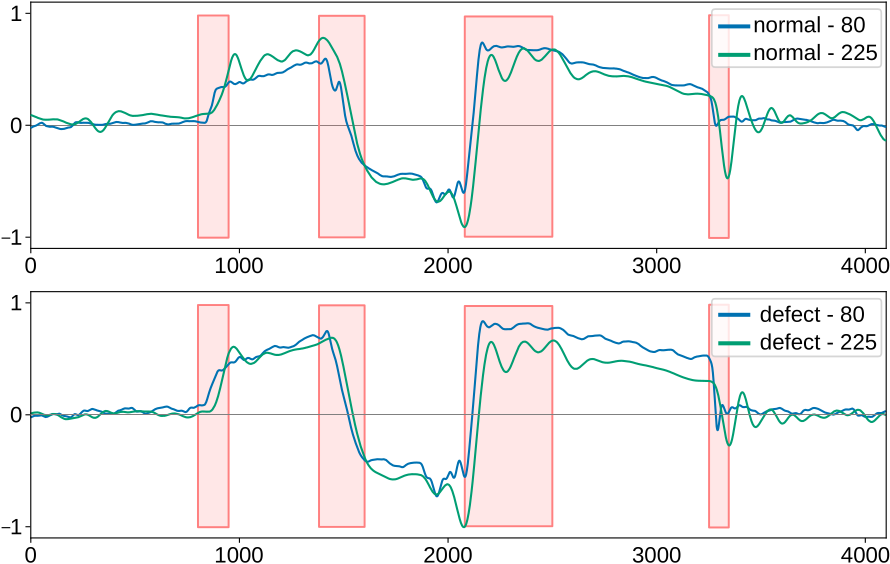
The following plot shows four example data points from the dataset including annotations.
Experiments of different speeds alter the time series by a lot, while the difference between normal and defect runs are more subtle.
Data Splits
The dataset has two variants, each with a train and test split. In the normal variant both normal and defect experiments of the same speed are in training and test. This should ensure that a model learns to ignore the effects of speed in the sensor recordings. In the decoy settings on the other hand, there are experiments with normal and defect outcomes of different speeds in the training data. In this case, the run speed represents a spurious correlation in the data. Both splits in both variants have roughly the same amount of normal and defect samples.
| Variant | Split | Size | Experiments |
|---|---|---|---|
| Normal | Train | 1106 | 1, 3, 5, 7, 9, 11 |
| Normal | Test | 1158 | 2, 4, 6, 8, 10, 12 |
| Decoy | Train | 1154 | 1, 2, 3, 10, 11, 12 |
| Decoy | Test | 1110 | 4, 5, 6, 7, 8, 9 |
Dataset Creation
Sensor Recordings
The sensor recodrings stem from a four-stage progressive die, used on a Bruderer BSTA 810-145 high-speed press with varying stroke speed. The strip material to be processed is fed into the progressive die by a BSV300 servo feed unit, while the tools are not engaged. The part to be produced remains permanently connected to the sheet strip throughout the entire production run. The stroke height of the tool is 63 mm and the material feed per stroke is 60 mm.
The process has four stages: a pilot punching stage, a round stamping stage, deep drawing and a cut-out stage. In the first stage, a 3 mm hole is punched in the metal strip. This hole is used by guide pins in the subsequent stages to position the metal strip. During the stroke movement, the pilot pin always engages in the pilot hole first, thus ensuring the positioning accuracy of the components. In the subsequent stage, a circular blank is cut into the sheet metal strip. This is necessary so that the part can be deep-drawn directly from the sheet metal strip. This is a round geometry that forms small arms in the subsequent deep-drawing step that hold the component on the metal strip. In the final stage, the component is then separated from the sheet metal strip and the process cycle is completed. The respective process steps are performed simultaneously so that each stage carries out its respective process with each stroke and therefore a part is produced with each stroke. Sensor recordings are provided for the deep drawing stage.
An indirect piezoelectric force sensor (Kistler 9240A) was used for data acquisition. The sensor is located directly above the punch and records not only the indirect process force but also the blank holder forces which are applied by spring assemblies between the upper mounting plate and the blank holder plate. The data is recorded at a sampling frequency of 25 kHz. The material used is DC04 with a width of 50 mm and a thickness of 0.5 mm. The voltage signals from the sensors are digitised using a ”CompactRIO” (NI cRIO 9047) with integrated NI 9215 measuring module (analogue voltage input ± 10 V). Data recording is started via an inductive proximity switch when the press ram passes below a defined stroke height during the stroke movement and is stopped again as it passes the inductive proximity switch during the return stroke move- ment. Due to the varying process speed caused by the stroke speeds that have been set, the recorded time series have a different number of data points. Further, there are slight variations in the length of the time series withing one experiment. For this reason, all time series are interpolated to a length of 4096 data points and we discard any time series that deviate considerably from the mean length of a run (i.e., threshold of 3). To simulate a defect, the spring hardness of the blank holder was manipulated in the test series that were marked as defect. The manipulated experiments result in the component bursting and tearing during production. In a real production environment, this would lead directly to the parts being rejected.
Annotations
For each sample, the dataset contains a binary annotation mask. With expert information, several intervals in the process have been identified, which are the most affected by the run speed. The annotation mask marks these intervals, and thus the part of the time series which are affected when the run speed presents a spurious correlation. However, the mask does not cover all time points which are affected by the speed, but only the most important intervals.
Personal and Sensitive Information
The dataset does not contain personal nor sensitive information.
Considerations for Using the Data
Social Impact of Dataset
The dataset has no social impact.
Known Limitations
While the annotations cover intervals of the time series which are the most affected by the run speed, they do not mark all of its influence. Overall, the run speed affects the time series in its total and it is difficult, if not impossible to completely locate and separate the effect of speed.
Citation Information
If you use the dataset, please consider citing the accompanying paper: @misc{kraus2024right, title={Right on Time: Revising Time Series Models by Constraining their Explanations}, author={Maurice Kraus and David Steinmann and Antonia Wüst and Andre Kokozinski and Kristian Kersting}, year={2024}, eprint={2402.12921}, archivePrefix={arXiv}, primaryClass={cs.LG} }
Contributions
Maurice Kraus, David Steinmann, Antonia Wüst, Andre Kokozinski, Kristian Kersting.
The data comes from the Priority Program (SPP) 2422 in the subproject “Optimization of active surface design of high-speed progressive tools using machine and deep learning algorithms“ funded by the German Research Foundation (DFG).
- Downloads last month
- 547