Problem Based Assignment 1: Develop and Evaluate Deep Neural Networks
b) Transformer Neural Network to perform emotion classification from texts on Kaggle dataset (you may use OpenAI models)
Answer the following questions:
1- Briefly describe the model development process. Evaluate the quality and limitations of the training dataset and accumulate a second validation dataset from open-source data on the internet
Please refer to the Jupyter Notebook file or Colab file to understand the details of developing the model.
Basically, the steps are data loading, model architecture definition, model training, and testing.
The model consists of:
- Base BERT (ignore character cases) [
bert-base-uncased] - A transformers model pre-trained on a large corpus of English data in a self-supervised fashion. - Pooling layer - it generates from a variable-sized sentence a fixed-sized sentence embedding.
- One dense (fully-connected) layer with tanh activation function
- Output dense (fully-connected) layer with softmax activation function - for classification
As for the training dataset, the count of training, validation, and testing data are 16000, 2000, and 2000 respectively.
Six classes are available i.e. sadness (0), joy (1), love (2), anger (3), fear (4), surprise (5).
This training number might not be sufficient considering the large English vocabulary and many combinations of expressions.
Human emotions are complicated and might not be perfectly represented with one of the six emotions.
A mixture of emotions is possible too when someone utters a sentence. For example,
one who says "It is unbelievable that my work receives such a huge compliment from you." could experience both joy and surprise at the same time.
Additionally, the data is imbalanced since there are more training data from the "joy" class (5362) followed by "sadness" (4666).
The model might be biased towards "joy" and "sadness" as it encounters both classes more during the training process.
URL for the second validation dataset: https://www.kaggle.com/datasets/shivamb/go-emotions-google-emotions-dataset
619 lines of data are extracted to be the validation dataset.
Since there are much more classes than the original dataset used to train the model, we ensure that only the data items from one of the six classes are extracted.
The purpose of this dataset is to test the robustness of our trained model in face of sentences not encountered before.
2- Evaluate the quality and performance of your model
To evaluate the performance of the trained model, firstly the occurrences of each class/emotion in the training data are shown.
The training data distribution can be used to explain the confusion matrix of test data prediction.
A confusion matrix is a summary of correct and incorrect predictions on a classification problem.
The count values of prediction and actual targets are broken down by each class.
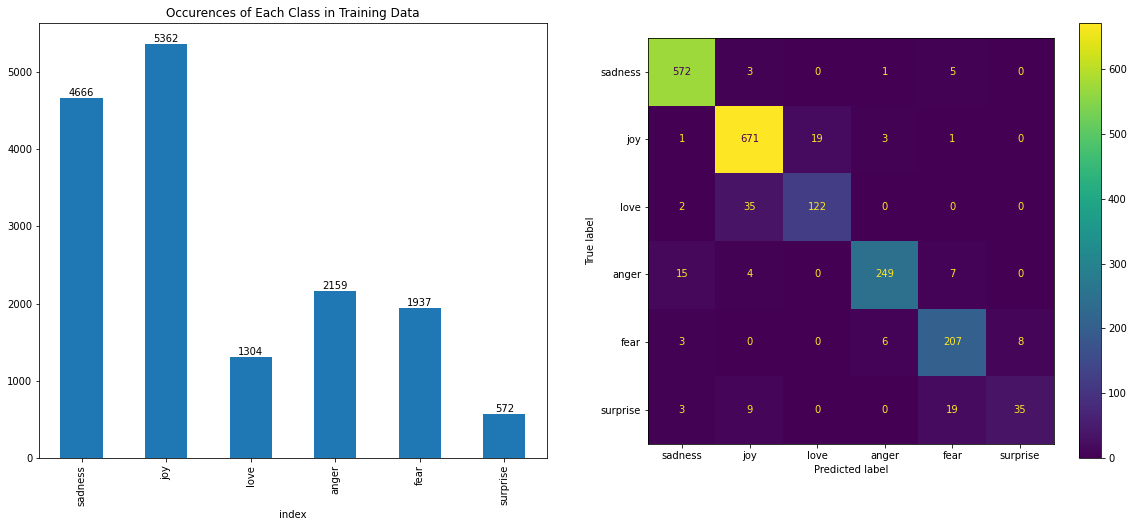
As we know, more training data enables the model to learn a wider range of scenarios that may be encountered in the real world. The model becomes more robust and better equipped to handle previously unseen data. A balanced and large number of training data can reduce sampling bias as well. Small training examples from certain class labels can suffer from sampling bias, where the training sample doesn't represent the true distribution of the population in the real world. The model tends to make mistakes on the inputs from the minority class.
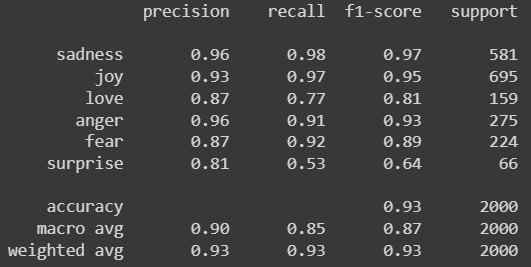
This explains why the recall is the lowest for surprise class (35/66 = 0.53) followed by love class (122/159 = 0.77).
The same goes for precision and f1-score. The model is only trained with 572 surprise examples and 1304 love examples.
On the other hands, the model performs fairly well in the rest of classes (sadness, joy, anger, fear) with all metric values greater than 85%.
For the detailed classification metrics of each class, please refer to the image below.
Note: Support is the number of actual occurrences of the class in the testing dataset.
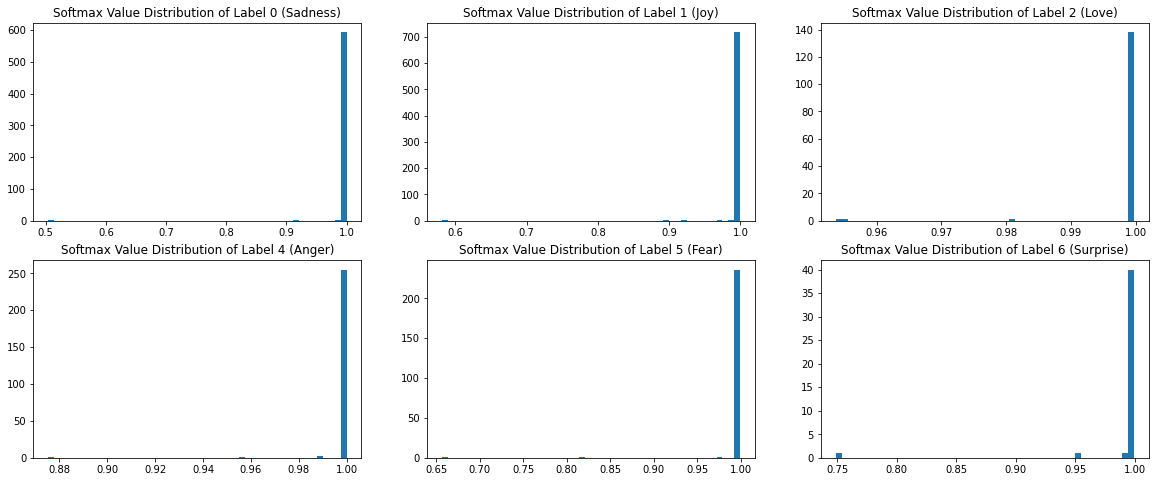
The histograms below show the distribution of probabilities for each class in the prediction results.
The softmax function maps the model output to a probability distribution over the classes, where the sum of the probabilities for all classes is equal to 1.
When the softmax probability of the correct class is close to 1, it means that the model is confident in its prediction of the correct class.
This is a desirable behavior because the model is making accurate emotion predictions with high confidence.
In general, based on the plots below, the model performs predictions with fairly high confidence since most probabilities are concentrated near 1.0.
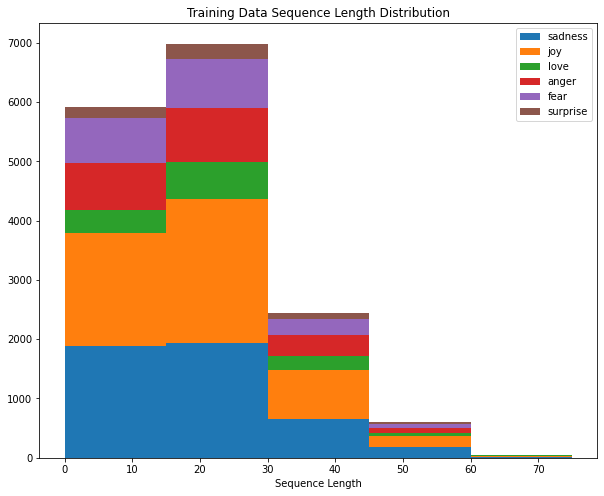
The plot below displays the sequence length distribution of the training dataset.
In short, most training examples have sequence length (token count per input) between 0 and 30.
BertTokenizer with bert-base-uncased pre-trained model is used to tokenize the sequences.
The plot below represents the sequence length distribution of the testing dataset.
Similarly, most testing examples have sequence length (token count per input) between 0 and 30.
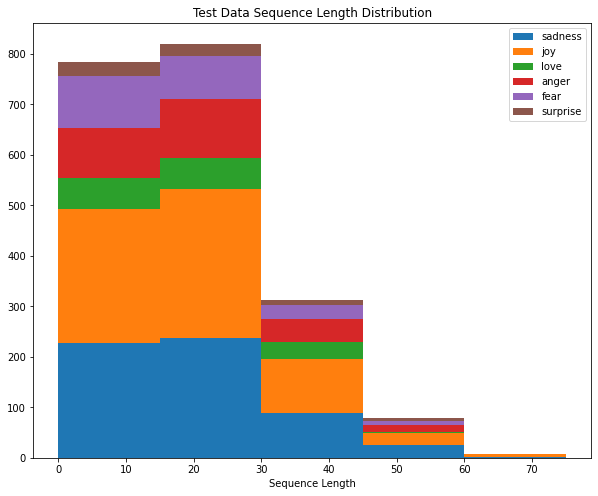
We divide the sequence length into 5 range groups (0-15, 15-30, 30-45, 45-60, 60-75) to understand the effect of sequence length factor on the model performance.
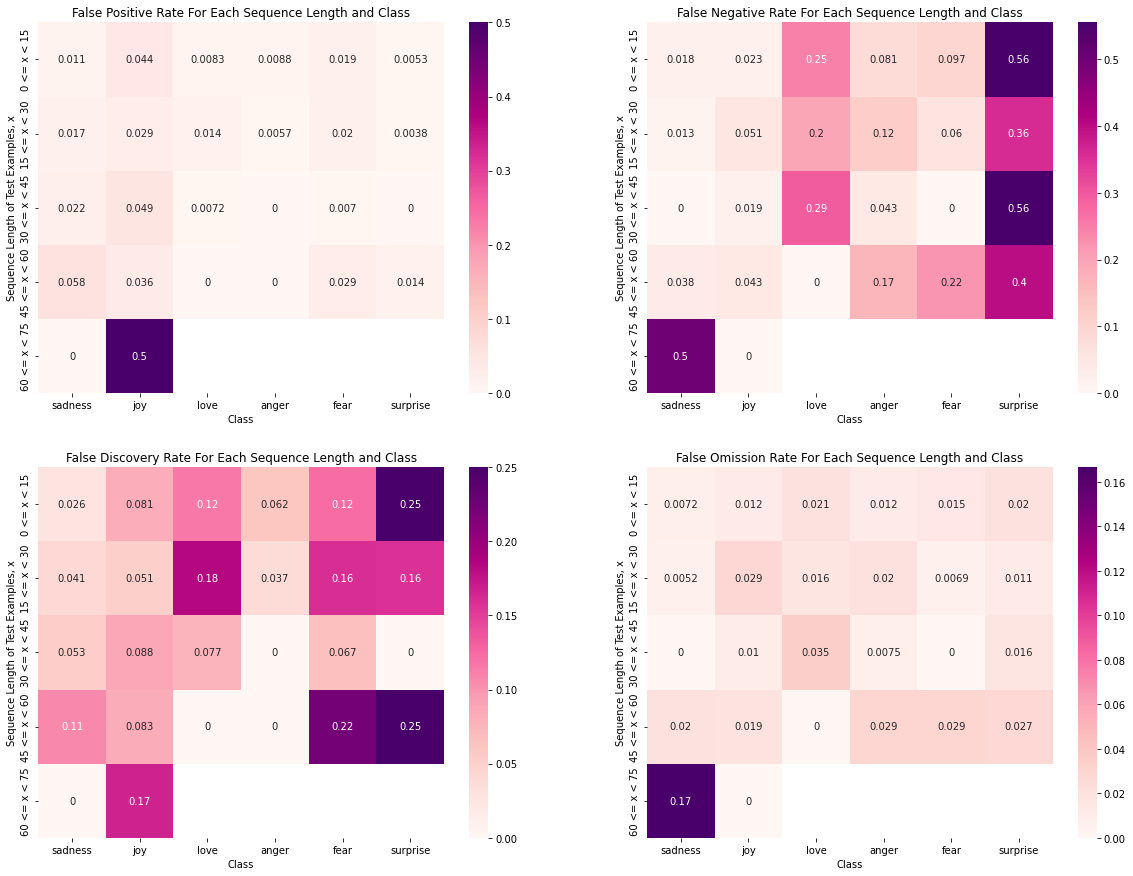
Then we calculate the following metrics for each emotion class and each sequence length group:
- False Positive Rate = FP / (FP + TN)
- False Negative Rate = FN / (FN + TP)
- False Discovery Rate = FP / (FP + TP)
- False Omission Rate = FN / (FN + TN)
The results are plotted using heatmaps as shown below:
In multiclass classification, positive examples refer to the inputs that belong to a specific class label
while negative examples are those that do not belong to that label.
For example, positive examples for joy are all the inputs with joy as target, while negative examples are inputs from sadness, fear, love, anger, and surprise.
False Positive Rate heatmap shows the proportion of negative samples that are incorrectly classified as positive.
The joy class with the length group between 60 and 75 is the worst (0.5) because we only have two test examples related to this group.
One of the examples is classified wrongly as joy. The outcome makes sense because the training data with
sequence length between 60 and 75 are the least. This explains why the model performs worst in this length group.
False Negative Rate heatmap displays the proportion of positive samples that are incorrectly classified as negative.
You should notice darker colors (0.56) in the cells of the surprise class, especially for sequence length ranges 0 - 15 and 30 - 45.
This means that many surprise examples are misclassified as non-surprise by the model. The issue can be explained using training data distribution.
Surprise class examples are the least represented in the training dataset. This makes the model more biased towards other classes when performing classification.
For the sadness class with sequence length (60 - 75), the situation is the same as False Positive Rate case where one of two related examples is classified wrongly.
False Discovery Rate heatmap depicts the proportion of positive predictions that are incorrectly classified.
The darker cells (0.25) belong to the surprise class with sequence length ranges (0 - 15) and (45 - 60).
The other two cells of surprise class are better with 0.16 and 0 respectively. The same goes for the fear class with the darkest cell (0.22) for (45 - 60) range group compared to other ranges.
This situation could be explained by the number of training examples available for the concerned sequence length ranges.
For surprise class, most training examples are (15 - 30) in terms of sequence length.
For fear class, most examples have sequence lengths of (0 - 15) and (15 - 30).
Limited training examples from certain groups could produce poor results when the model is evaluated with the data from these groups.
False Omission Rate (FOR) heatmap illustrates the proportion of negative predictions that are incorrectly classified.
Only sadness class with length (60 - 75) is slightly worse (0.17). The other sequence length groups and classes show acceptable results.
This is because the number of test examples classified as non-sadness are only 6 and one of them should be positive.
Even though only one mistake is made by the model, it contributes a lot to the final FOR since we only have 6 as the denominator (number of negative predictions).
The analysis of the performance difference between sequence length groups suggests that a balanced training dataset across all sequence length ranges and classes is important. Balanced dataset ensures model fairness where the same level of accuracy and performance across different groups of sequence lengths (and other factors) are achieved.
We also test the results of the trained model using the second validation data (external dataset) to evaluate the ability of the model
to generalize well to the unseen expression styles and structures as in real-world situations.
The model can't classify the emotions correctly as it has never been trained with the form and writing style of the validation data.
Most metrics don't even reach 60% (0.6). This seems to be that the model is effectively making random guesses:
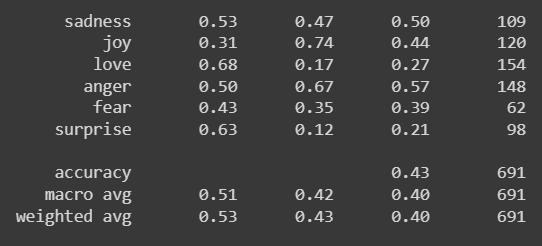
In summary, the model can only classify emotions in the text from similar domains and writing styles with a slight bias in certain less-represented emotions. The model doesn't generalize well with the text from other sources due to differences in writing styles and structures.
3- Based on the evaluations above, propose and justify at least 2 methods to improve the performance of your model
Method 1:
Increase the size of datasets.
Many findings have shown that the larger the size of the training data, the higher the accuracy of the model.
Large datasets are more likely to be representative of the population being studied.
The model can reach more generalizable and reliable conclusions when trained with a large amount of data.
In addition, a large dataset makes the effect of noises or errors less significant in the training process,
provided that the noise only accounts for ~1% of the overall dataset.
This leads to a more trustable, robust, and less-prone-to-overfitting model.
Method 2:
Ensure the training data has balanced classes.
Deep learning models always work best when the number of samples in each class is about equal. Class imbalance causes a high accuracy when predicting the majority class, but fails to capture the minority class. Typically, the minority class is more important. Hence, by ensuring the classes of samples are balanced, the accuracy can be maximized and the classification errors are reduced.
Method 3:
Increase the diversity and quality of the dataset.
Increasing the size of the dataset is not enough if most of the data use the same writing style and sentence structure. This will cause redundancy and can't improve the model performance. The use of poor-quality data (i.e., not accurate, consistent, or credible) can lead to severe degradation in the results. More variety of expression structures is important to make the model more general and applicable to different real-world situations. If the dataset is homogeneous, the model might only work well for a specific population, not for others.