image
imagewidth (px) 224
224
| irradiance
float32 -9.19
1k
|
|---|---|
-1.456198 |
|
-0.751933 |
|
-0.276336 |
|
425.044382 |
|
-0.466099 |
|
247.464485 |
|
75.02512 |
|
-0.531746 |
|
-0.309565 |
|
738.378667 |
|
717.390634 |
|
472.078095 |
|
12.140987 |
|
-0.475269 |
|
-0.830428 |
|
-0.118344 |
|
653.060438 |
|
810.724279 |
|
-0.67964 |
|
-0.70053 |
|
-0.603665 |
|
62.8236 |
|
489.251897 |
|
-0.58 |
|
-1.283409 |
|
758.793518 |
|
-1.018734 |
|
877.566782 |
|
-0.579095 |
|
0.517528 |
|
3.047081 |
|
-0.616296 |
|
-1.768569 |
|
107.743084 |
|
370.881284 |
|
216.200401 |
|
-1.396223 |
|
677.967234 |
|
429.760245 |
|
-0.307564 |
|
77.037127 |
|
252.970307 |
|
-1.256251 |
|
950.057068 |
|
-0.609776 |
|
417.097118 |
|
118.530995 |
|
0.228664 |
|
-0.821634 |
|
64.519788 |
|
648.556583 |
|
622.483886 |
|
160.765247 |
|
402.81399 |
|
833.203168 |
|
330.986943 |
|
136.819084 |
|
-0.922875 |
|
-0.326801 |
|
-0.643343 |
|
5.361533 |
|
599.555482 |
|
343.794495 |
|
-0.415895 |
|
249.876579 |
|
35.265176 |
|
895.82859 |
|
-0.773967 |
|
417.135863 |
|
19.039747 |
|
17.042205 |
|
-1.131002 |
|
145.073332 |
|
-0.619586 |
|
276.253639 |
|
408.995363 |
|
751.486595 |
|
-0.44135 |
|
683.817471 |
|
-0.556205 |
|
411.844799 |
|
157.11076 |
|
260.155846 |
|
123.281846 |
|
55.676284 |
|
577.153208 |
|
-0.238113 |
|
-2.41 |
|
979.80834 |
|
554.901899 |
|
-0.647665 |
|
23.353119 |
|
571.783565 |
|
66.061203 |
|
-0.398633 |
|
-0.33086 |
|
-1.006298 |
|
651.289926 |
|
273.136978 |
|
-0.133964 |
Estimating Solar Irradiance with Image Regression
- Homepage: Sage Continuum
- Author: Alex Shen, Northwestern University
- Mentors: Bhupendra Raut, Seongha Park
- Repository: GitHub Repository
Goal and Importance
Our goal was to create a model to estimate solar irradiance in the sky based on ground images taken from waggle nodes. This could help in the following ways:
- Solar energy generation: It could help in predicting energy generation more accurately resulting in improved efficiency and grid management
- Weather forecasting- Could assist meteorologists in predicting weather patterns using solar irradiance levels, and in analyzing current weather conditions
- Climate change: Would help with modeling climate change, could contribute to understanding and assist in mitigating global warming
- Smart Homes: Would be able to help smart homes manage energy more efficiently (control certain devices based on irradiance levels)
Data Preprocessing
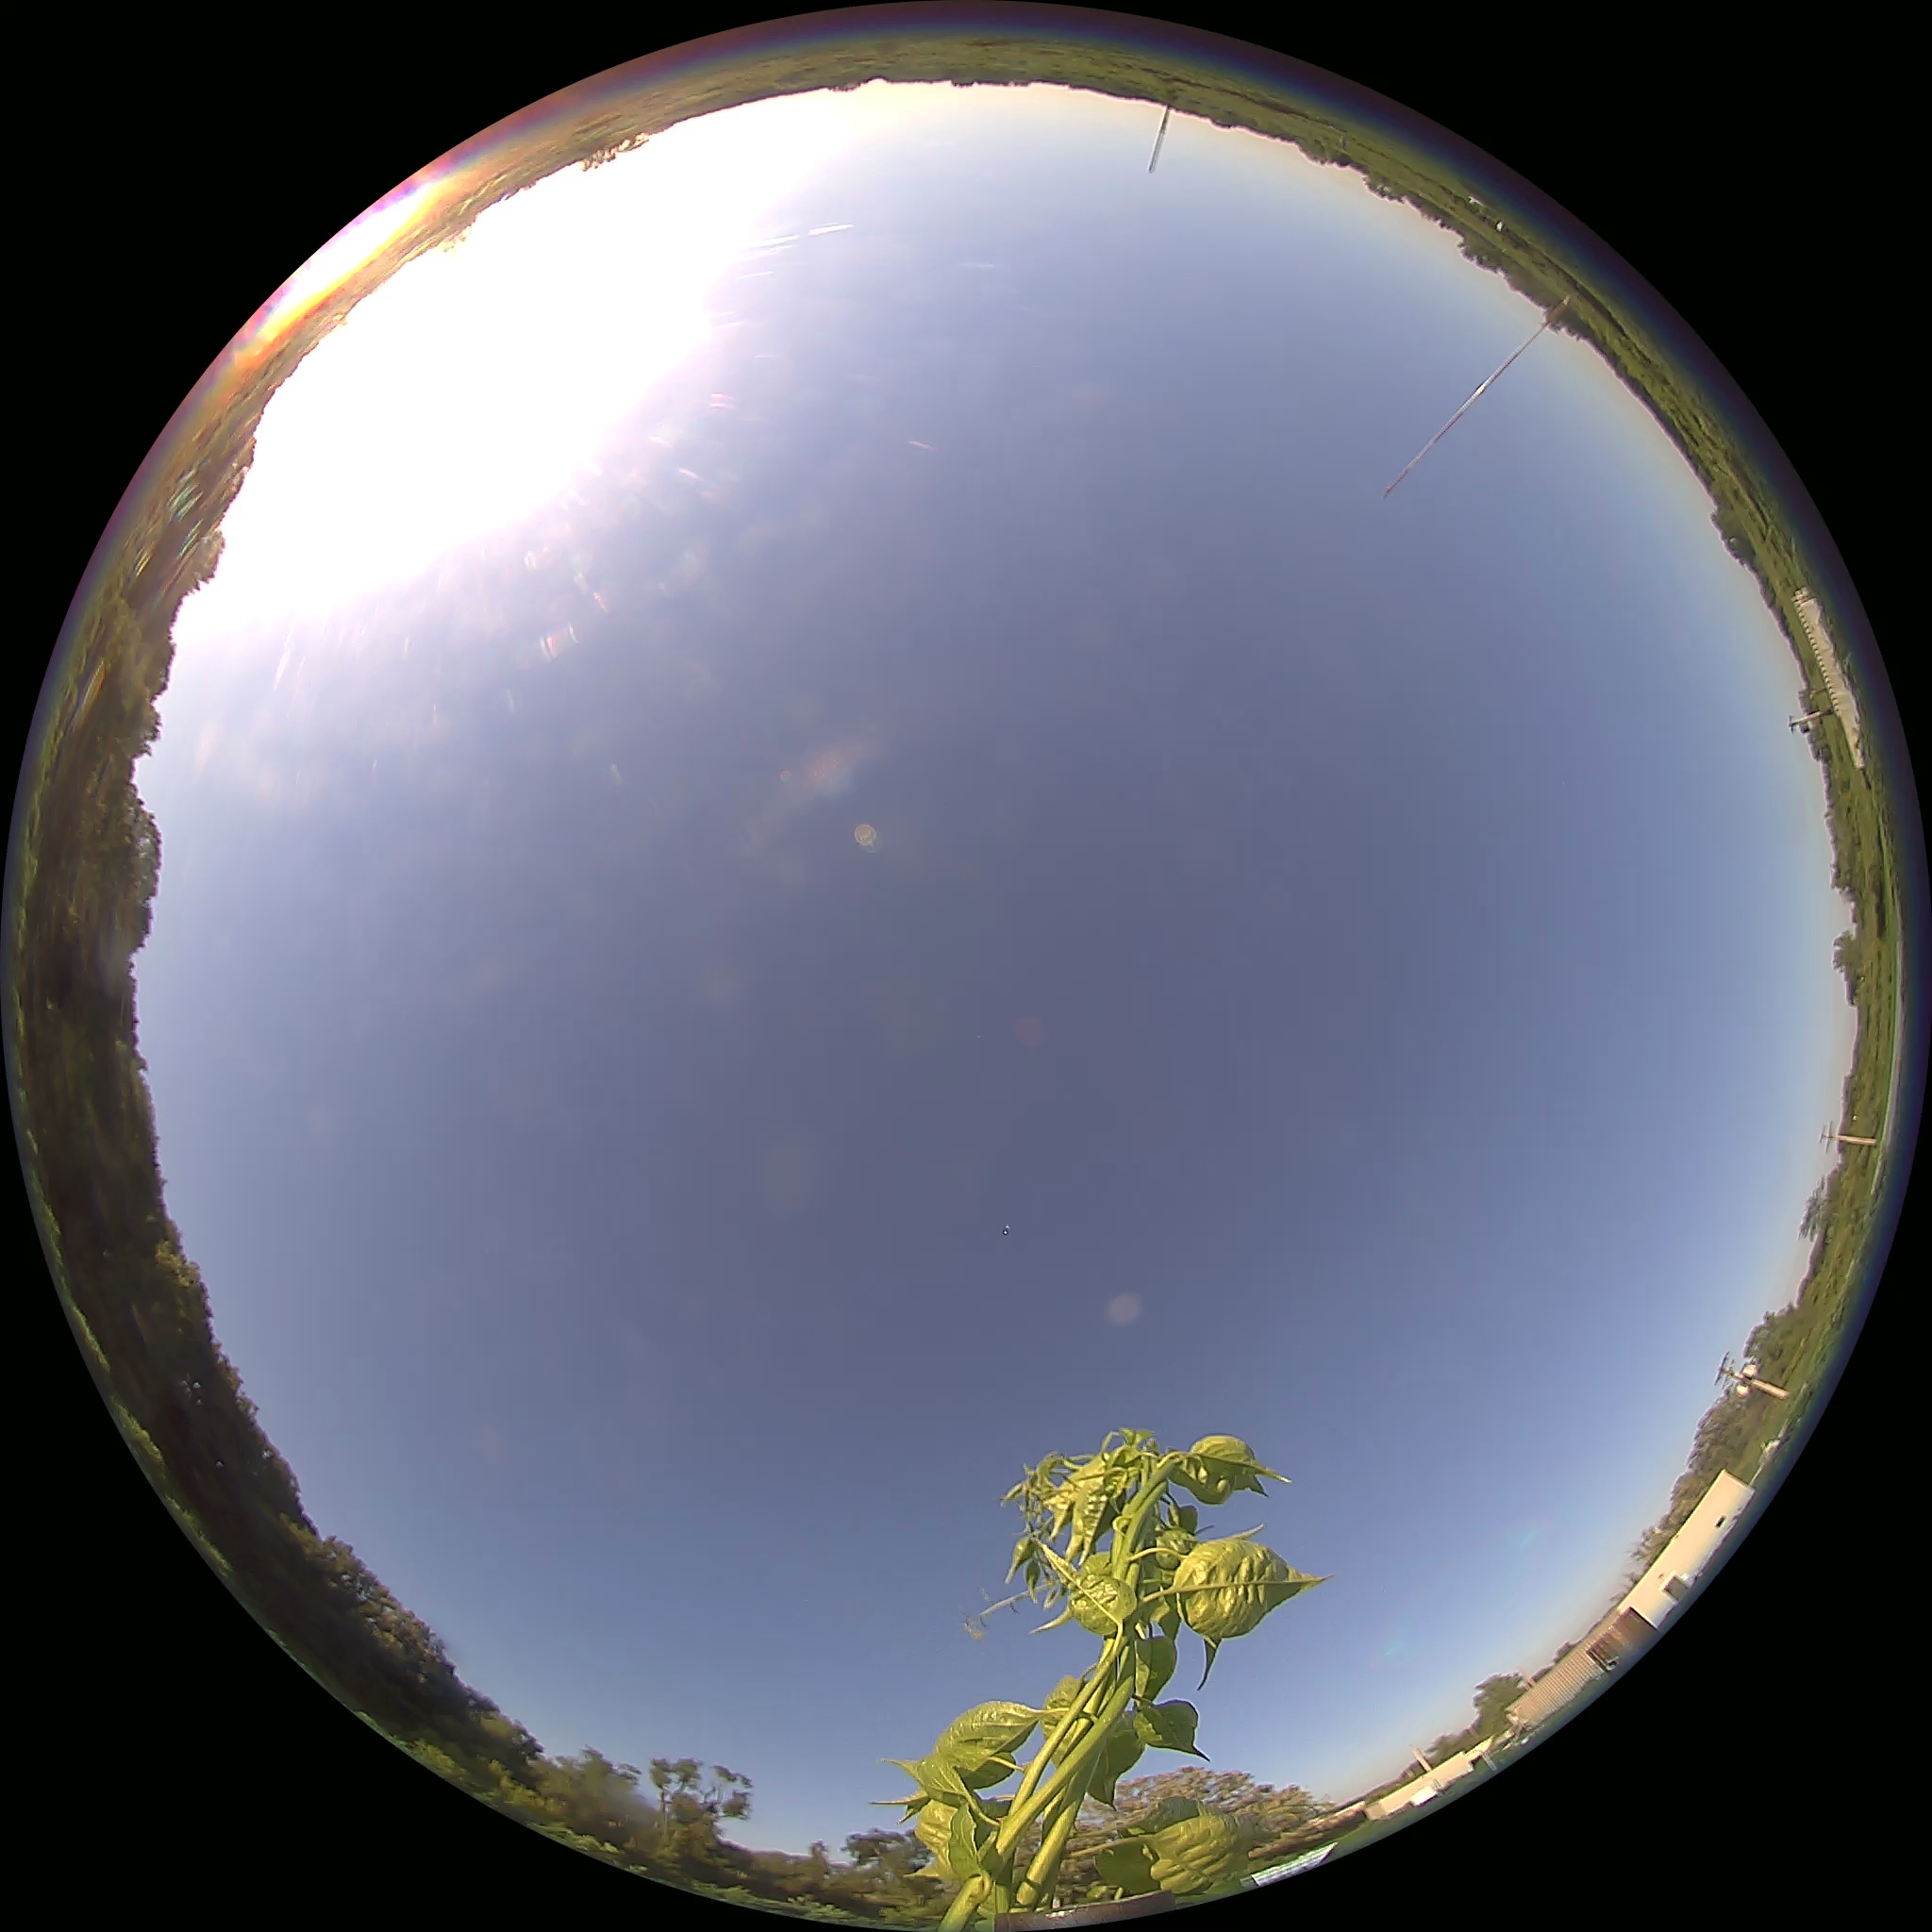
In the data preprocessing stage we created a csv file that stored all the images to their matching solar irradiance values. The images were taken from the Sage Waggle Node's top camera and the solar irradiance values were taken from the Argonne National Laboratory tower readings. We made sure to exclude night time photos since there is no sun and we exclusively used summer-time photos as we wanted to stick to a seasonal model that would be able to make estimates more consistently. Furthermore we also eventually downsized the images original 2000x2000 images to 500x500 images since the training was taking a bit too long when the images were larger.
 Example training image taken from waggle node W039, 2000x2000 pixels
Training and Model
In our training, before the image was transformed to a tensor, the image was resized down to 224x224 to stay consistent with the pre-trained models. The image was also randomly flipped with a 50% chance and rotated randomly between 0-359 degrees so the model would be able to generalize better. For our model we compared all of the pretrained ResNet models and the VGG-16 model. However we replaced the last fc layer so that the model would give us a continuous value as an estimate instead of a range. We found that the ResNet 50 model performed the best with the lowest mean absolute error of 82. All in all, I think that the error was small enough to justify creating the plugin. In the plugin the waggle node simply snaps an image of the sky using its top camera, and notes the solar irradiance that the model predicts and publishes it to the Beehive Repository.
Graphs
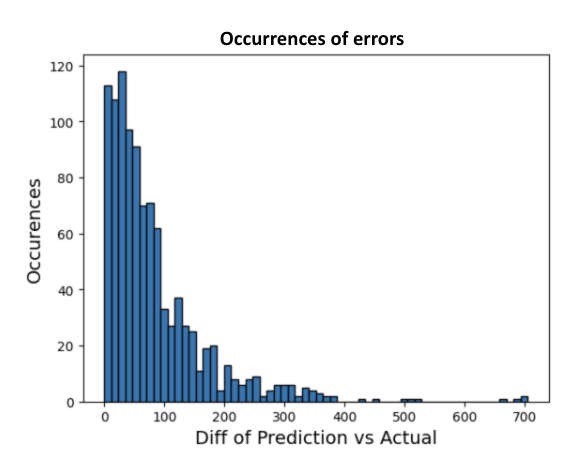
Graph showing the # of times that each margin of error appeared in our tesing images. For example, the model predicting 10 when the irradiance is 20 would result in an error of 10, raising the first bar of the bar graph 1 occurence higher
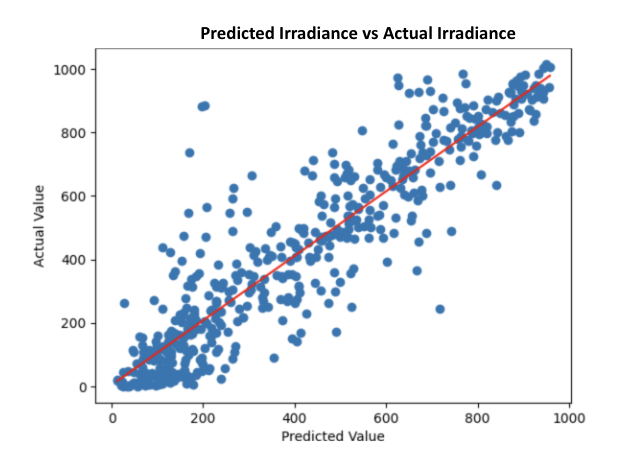
This graph plots the predicted irradiance of a test image against its actual irradiance value. The dots are centering mostly around the y=x line meaning the model is predicting accurately on average. Also since there are points both above and below the line the model is not biased towards either overestimating or underestimating also causing it to predict well on average
Future Directions
- Increase training data to decrease MAE
- Work around identifying through the thin cloud layers since it causes mistakes in the model by severely underestimating the irradiance value due to thin clouds covering the image
- Work on identifying correct irradiance values during sunsets and sunrises. The model occasionally overestimates irradiance when the sun is at its perimeter due to greater light exposure in the image
- Implement a feature to forecast solar irradiance levels based on the patterns of data gathered
- Downloads last month
- 5

