Dataset: Low-to-high-resolution weather forecasting using topography
The dataset is intended and structured for the problem of transforming/interpolating low-resolution weather forecasts into higher resolution using topography data.
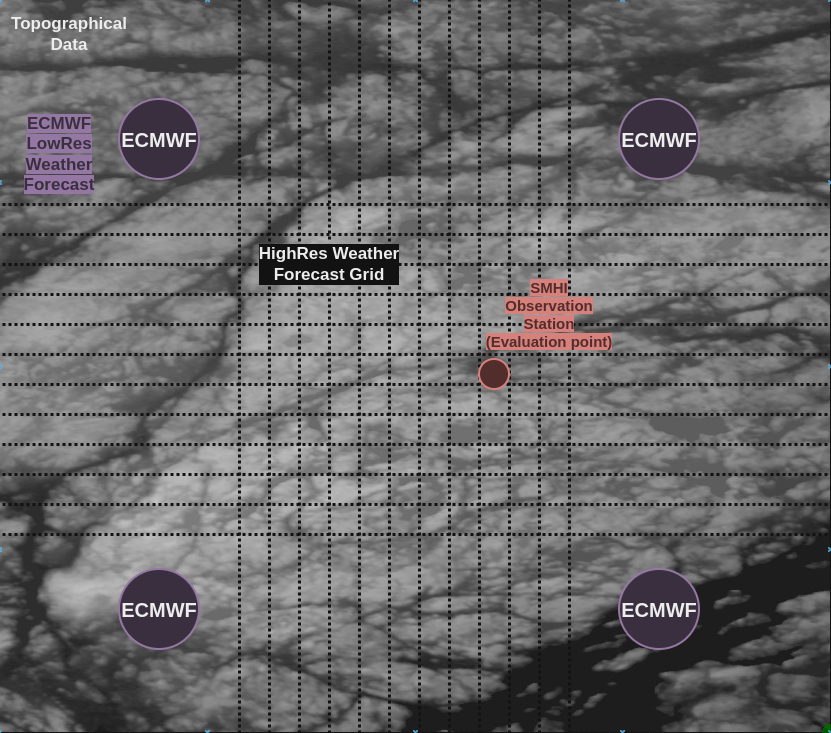
The dataset consists of 3 different types of data (as illustrated above):
- Historical weather observation data (SMHI)
- Historical weather observation data from selected SMHI observation stations (evaluation points)
- Historical low-resolution weather forecasts (ECMWF)
- For a given SMHI station: Historical, (relatively) low-resolution ECMWF weather forecasts from the 4 nearest ECMWF grid points
- Topography/elevation data (Copernicus DEM GLO-30):
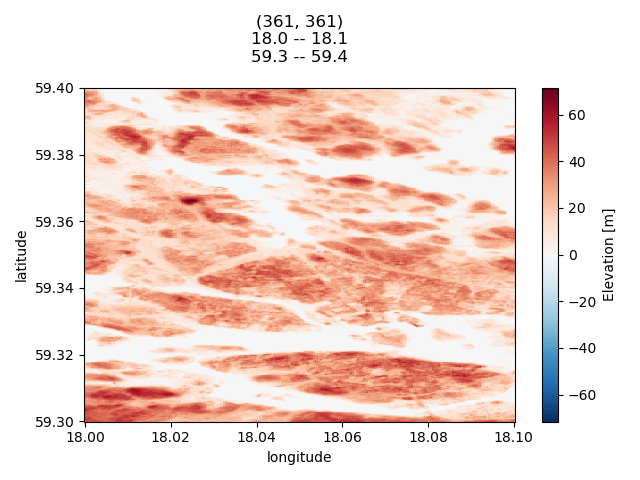
- Topography/elevation data around a given SMHI station, grid enclosed by the 4 ECMWF points
The dataset is meant to facilitate the following modeling pipeline:
- Weather forecasts for a set of 4 neighboring ECMWF points are combined with topography/elevation data and turned into higher resolution forecasts grid (corresponding to the resolution of the topography data)
- SMHI weather observation data is used as a sparse evaluation point of the produced higher-resolution forecasts
Data details & samples
SMHI weather observation data
SMHI weather observation data is structured in csv files, separately for each weather parameter and weather observation station. See the sample below:
Stationsnamn;Stationsnummer;Stationsnät;Mäthöjd (meter över marken)
Stockholm-Observatoriekullen;98210;SMHIs stationsnät;2.0

Parameternamn;Beskrivning;Enhet
Lufttemperatur;momentanvärde, 1 gång/tim;celsius

Tidsperiod (fr.o.m);Tidsperiod (t.o.m);Höjd (meter över havet);Latitud (decimalgrader);Longitud (decimalgrader)
1859-01-01 00:00:00;2024-02-01 07:20:11;43.133;59.3417;18.0549

Datum;Tid (UTC);Lufttemperatur;Kvalitet;;Tidsutsnitt:
2023-10-27;06:00:00;2.4;G
2023-10-27;18:00:00;3.0;G
2023-10-28;06:00:00;0.6;G
2023-10-28;18:00:00;1.9;G
2023-10-29;06:00:00;0.3;G
2023-10-29;18:00:00;3.2;G
2023-10-30;06:00:00;2.4;G
2023-10-30;18:00:00;4.3;G
2023-10-31;06:00:00;8.5;G
2023-10-31;18:00:00;4.6;G
2023-11-01;06:00:00;1.9;G
ECMWF historical weather forecasts
Historical ECMWF weather forecasts contain a number of forecasted weather variables at 4 nearest grid points around each SMHI observation station:
<xarray.Dataset>
Dimensions:                 (reference_time: 2983, valid_time: 54,
                             corner_index: 4, station_index: 275)
Coordinates:
  * reference_time          (reference_time) datetime64[ns] 2020-01-01 ... 20...
    latitude                (corner_index, station_index) float64 55.3 ... 68.7
    longitude               (corner_index, station_index) float64 ...
    point                   (corner_index, station_index) int64 ...
  * valid_time              (valid_time) int32 0 1 2 3 4 5 ... 48 49 50 51 52 53
  * station_index           (station_index) int64 0 1 2 3 4 ... 271 272 273 274
  * corner_index            (corner_index) <U3 'llc' 'lrc' 'ulc' 'urc'
    station_names           (station_index) <U29 ...
    station_ids             (station_index) int64 ...
Data variables:
    PressureReducedMSL      (reference_time, valid_time, corner_index, station_index) float32 ...
    RelativeHumidity        (reference_time, valid_time, corner_index, station_index) float32 ...
    SolarDownwardRadiation  (reference_time, valid_time, corner_index, station_index) float64 ...
    Temperature             (reference_time, valid_time, corner_index, station_index) float32 ...
    WindDirection:10        (reference_time, valid_time, corner_index, station_index) float32 ...
    WindSpeed:10            (reference_time, valid_time, corner_index, station_index) float32 ...
Topography data
The topography data is provided in the chunks cut around each of the SMHI stations. The corners of each chunk correspond to ECMWF forecast grid points.
Each chunk consists 361 x 361 points, spanning across 0.1° x 0.1°. (Some of the values across longitudes are NaN since apparently the Earth is not square [citation needed]).

