
The viewer is disabled because this dataset repo requires arbitrary Python code execution. Please consider
removing the
loading script
and relying on
automated data support
(you can use
convert_to_parquet
from the datasets library). If this is not possible, please
open a discussion
for direct help.
NuCLS Dataset
Overview
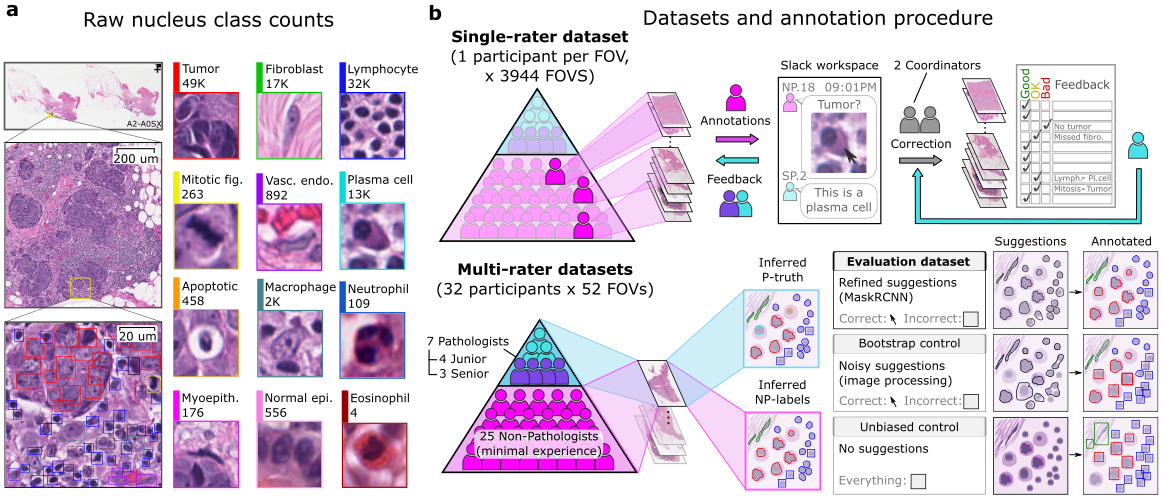
The comprehensive dataset comprises over 220,000 labeled nuclei from breast cancer images sourced from TCGA, making it one of the largest datasets for nucleus detection, classification, and segmentation in hematoxylin and eosin-stained digital slides of breast cancer. This extensive labeling effort is the result of a collaboration among pathologists, pathology residents, and medical students, who utilized the Digital Slide Archive for annotation. The dataset serves multiple purposes, including the development and validation of algorithms for nucleus detection, classification, and segmentation. It is also valuable for conducting interrater analysis research. The dataset encompasses annotations from both single-rater and multi-rater evaluations, with this specific collection containing approximately 59,500 labeled nuclei from the corrected single-rater subset.
This repository contains the necessary information about the dataset associated with the following papers:
Amgad, Mohamed, et al. "Structured Crowdsourcing Enables Convolutional Segmentation of Histology Images." Bioinformatics, vol. 35, no. 18, 2019, pp. 3461-3467, https://doi.org/10.1093/bioinformatics/btz083. Accessed 18 Mar. 2024.
Amgad, Mohamed, et al. "NuCLS: A Scalable Crowdsourcing Approach and Dataset for Nucleus Classification and Segmentation in Breast Cancer." GigaScience, vol. 11, 2022, https://doi.org/10.1093/gigascience/giac037. Accessed 18 Mar. 2024.
Accessing the Data
You can load the NuCLS dataset using the datasets library in Python. Depending on your needs, you can choose to load the full dataset or its smaller subset.
To load the full dataset:
from datasets import load_dataset
dataset = load_dataset("minhanhto09/NuCLS_dataset", name="default")
To see a smaller subset of the dataset:
from datasets import load_dataset
dataset = load_dataset("minhanhto09/NuCLS_dataset", name="debug")
Dataset Structure
Data Schema
The Corrected Single-Rater Dataset is a collection of 1,744 entries, each with an associated Field of View (FOV) image, mask image, visualization image, and a list of nuclei annotation coordinates, comprising 1,744 complete sets. In total, there are 59,485 nuclei annotations. Each image is rendered at a resolution of 0.2 microns-per-pixel, with all annotation coordinates provided in pixel units to correspond with this resolution.
A single dataset entry contains the following details:
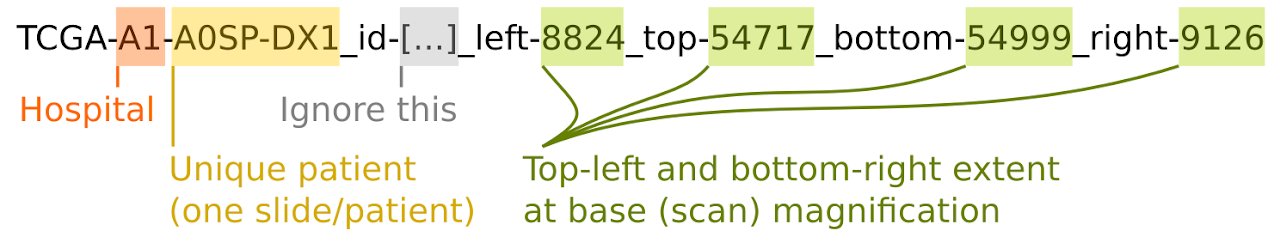
'file_name': A unique filename that encodes the most relevant information about each example and its associated data.
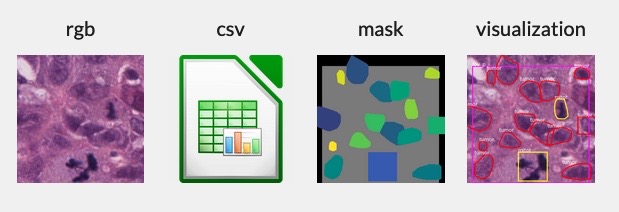
rgb_image: A high-resolution RGB image of breast cancer tissue.mask_image: A mask image with each nucleus labeled. Class labels are encoded in the first channel. The second and third channels are used to create a unique identifier for each nucleus. The field of view (gray area) is marked to delineate the annotated region.This file contains the nucleus label encoding, including a special 'fov' code encoding the intended annotation region.
visualization_image: A visualization image that overlays the RGB and mask images to assist in interpretability.annotation_coordinates: Each instance comprises a list of annotations for the nuclei, with each annotation encompassing:raw_classification: The base category of the nucleus, with 13 possible classes such as 'tumor' or 'lymphocyte'.main_classification: A higher-level category of the nucleus, with 7 classes including 'tumor_mitotic' and 'nonTILnonMQ_stromal'.super_classification: The broadest category label for the nucleus, with 4 options including 'sTIL' or 'nonTIL_stromal'.type: The form of annotation used, either 'rectangle' or 'polyline'.xmin,ymin,xmax,ymax: The bounding box coordinates indicating the extent of the nucleus.coords_x,coords_y: The specific boundary coordinates of the nucleus.
Data Split
The dataset is divided into six folds, each with its own training and testing set. This division is based on the source hospital to capture the variability in medical imaging practices and ensure that models trained on the dataset can generalize well across different institutions.
The dataset is divided into the following folds:
train_fold_1: 1,481 examplestest_fold_1: 263 examplestrain_fold_2: 1,239 examplestest_fold_2: 505 examplestrain_fold_3: 1,339 examplestest_fold_3: 405 examplestrain_fold_4: 1,450 examplestest_fold_4: 294 examplestrain_fold_5: 1,467 examplestest_fold_5: 277 examplestrain_fold_999: 21 examplestest_fold_999: 7 examples
Note that the debug configuration utilizes these particular folds train_fold_999 and test_fold_999 due to their smaller numbers of examples.
Usage Example
This dataset is suitable for various computer vision tasks, including image classification, detection, and segmentation. This document presents several exploratory data analysis (EDA) techniques, along with an illustrative example of an image detection task. In this example, I presented a model capable of predicting the bounding boxes and class labels for all nuclei within a single image with relatively good accuracy.
Below are the prediction results from a customized deep-learning model based on the YOLOv8 model.


Licensing
The dataset is licensed by a CC0 1.0 license.
Limitations
Currently, the dataset comprises exclusively the corrected single-rater data. Subsequent releases should expand to incorporate both the uncorrected single-rater and multi-rater datasets.
- Downloads last month
- 318