
title
stringlengths 5
75
| url
stringlengths 63
130
| date
timestamp[s] | contents
stringlengths 117
23.5k
|
|---|---|---|---|
Organization notifications default list | https://support.expel.io/hc/en-us/articles/10012579141523-Organization-notifications-default-list | 2022-09-30T20:48:39 | These organization notifications are provided by default:
1. When an incident is created.
2. When an incident is assigned to my org.
3. When an investigation is assigned to my org.
4. When a remediation action is assigned to my org.
5. When a verify action is assigned to my org.
6. When an investigative action is assigned to my org.
7. When a notify action is assigned to my org.
8. When an assembler has a health status change.
9. When a security device has a health status change.
For the list of default user notifications that are added for each new user,
see the User notifications default list. To learn more about what the
notifications mean, see the Notifications definitions guide.
|
GitLab (SaaS) Setup for Workbench | https://support.expel.io/hc/en-us/articles/10853659813395-GitLab-SaaS-Setup-for-Workbench | 2022-10-31T17:50:22 | This article explains how to connect GitLab to Expel Workbench.
#### In this article
* Before you start
* Step 1: Enable console access
* Step 2: Configure the technology in Workbench
## Before you start
You must have:
* A GitLab SaaS installation. Reach out to your engagement manager if you’re using the self-managed version.
* A user account with owner permissions on the top-level group.
## Step 1: Enable console access
Having read-only access to the interface of your technology allows Expel to
dig deeper during incident investigations. Our device health team uses this
access to investigate potential health issues with your tech.
### Note
Expel secures all login information our SOC analysts need about your devices
in a MFA password product. Access to this login information is protected using
our internal MFA processes. To learn more about the IP addresses all Expel
traffic comes from, go here.
1. Login to GitLab and navigate to a top-level group.
2. Copy the Group ID.
3. Open your Profile menu and select Preferences.
4. Click Access Tokens.
5. Generate a Personal Access Token with a 1-year expiry date and a read_api permission level.
## Step 2: Configure the technology in Workbench
Now that we have the correct access configured and noted the credentials, we
can integrate your tech with Workbench.
1. In a new browser tab, log into Workbench. The link opens the Add Security Device screen directly.
2. Fill in the fields like this:
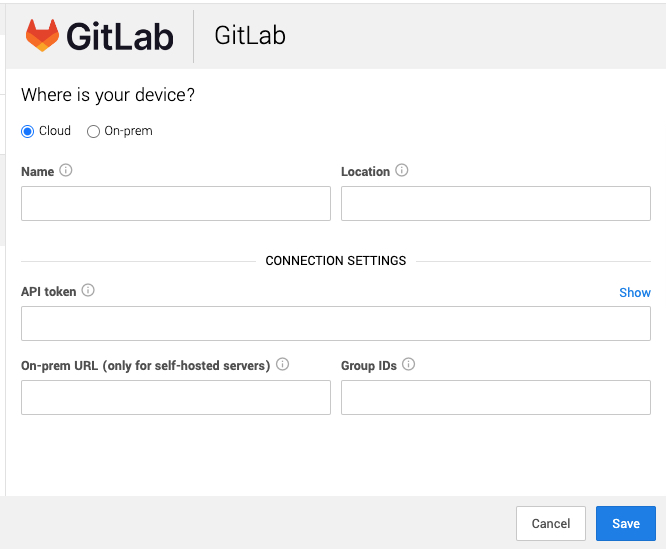
* Add a Name and Location that are meaningful to you.
* For API token, use the Personal Access Token created in Step 1.5.
* For On-prem URL, if the server is self-managed, use the GitLab server URL.
* For Group IDs, type the Group ID copied in Step 1.2.
You can see if the device is healthy on the Security Devices page. It may take
a few minutes to see the device listed as healthy.
To check if alerts are coming through, navigate to the Alerts Analysis page.
Scroll to the device you want to check and click View alerts. Switch to grid
view, then check the list for device alerts. It can take 36 to 72 hours for
alerts to appear after setup, as we tune your device.
### Tip
This article was accurate at the time of writing, but changes happen. If you
find the instructions are outdated, leave a description in the comment field
below and let us know!
|
Check Point via SIEM setup for Workbench | https://support.expel.io/hc/en-us/articles/11455980950035-Check-Point-via-SIEM-setup-for-Workbench | 2022-11-21T21:23:01 | This procedure helps you to connect your Check Point via SIEM to the Expel
Workbench. The procedure is to port in logs by creating a new Syslog source,
configuring that source in Workbench, then your Check Point via SIEM device in
Workbench.
### Note
Some steps in this procedure vary greatly depending upon the SIEM-based
technology you use.
#### In this article
* Step 1: Logging Check Point to a desired SIEM
* Step 2: Configure the SIEM in Workbench
* Step 3: Configure Check Point via SIEM in Workbench
## Step 1: Logging Check Point to a desired SIEM
Refer to your SIEM documentation or work with your SIEM representative to port
in Check Point logs. You can also refer to the following web references for
creating a new Syslog source:
* Sumo Logic
## Step 2: Configure the SIEM in Workbench
This link opens the Expel Knowledge Base section for connecting SIEM-based
technology to Workbench. Follow the applicable article to configure your SIEM-
based tech and confirm that Check Point logs are flowing through and
available.
## Step 3: Configure Check Point via SIEM in Workbench
Now that we have the correct access configured and noted the credentials, we
can integrate your tech with Workbench.
### Note
Expel secures all login information our SOC analysts need about your devices
in a MFA password product. Access to this login information is protected using
our internal MFA processes. To learn more about the IP addresses all Expel
traffic comes from, go here.
1. In a new browser tab, go to https://workbench.expel.io/settings/security-devices?setupIntegration=checkpoint.
---
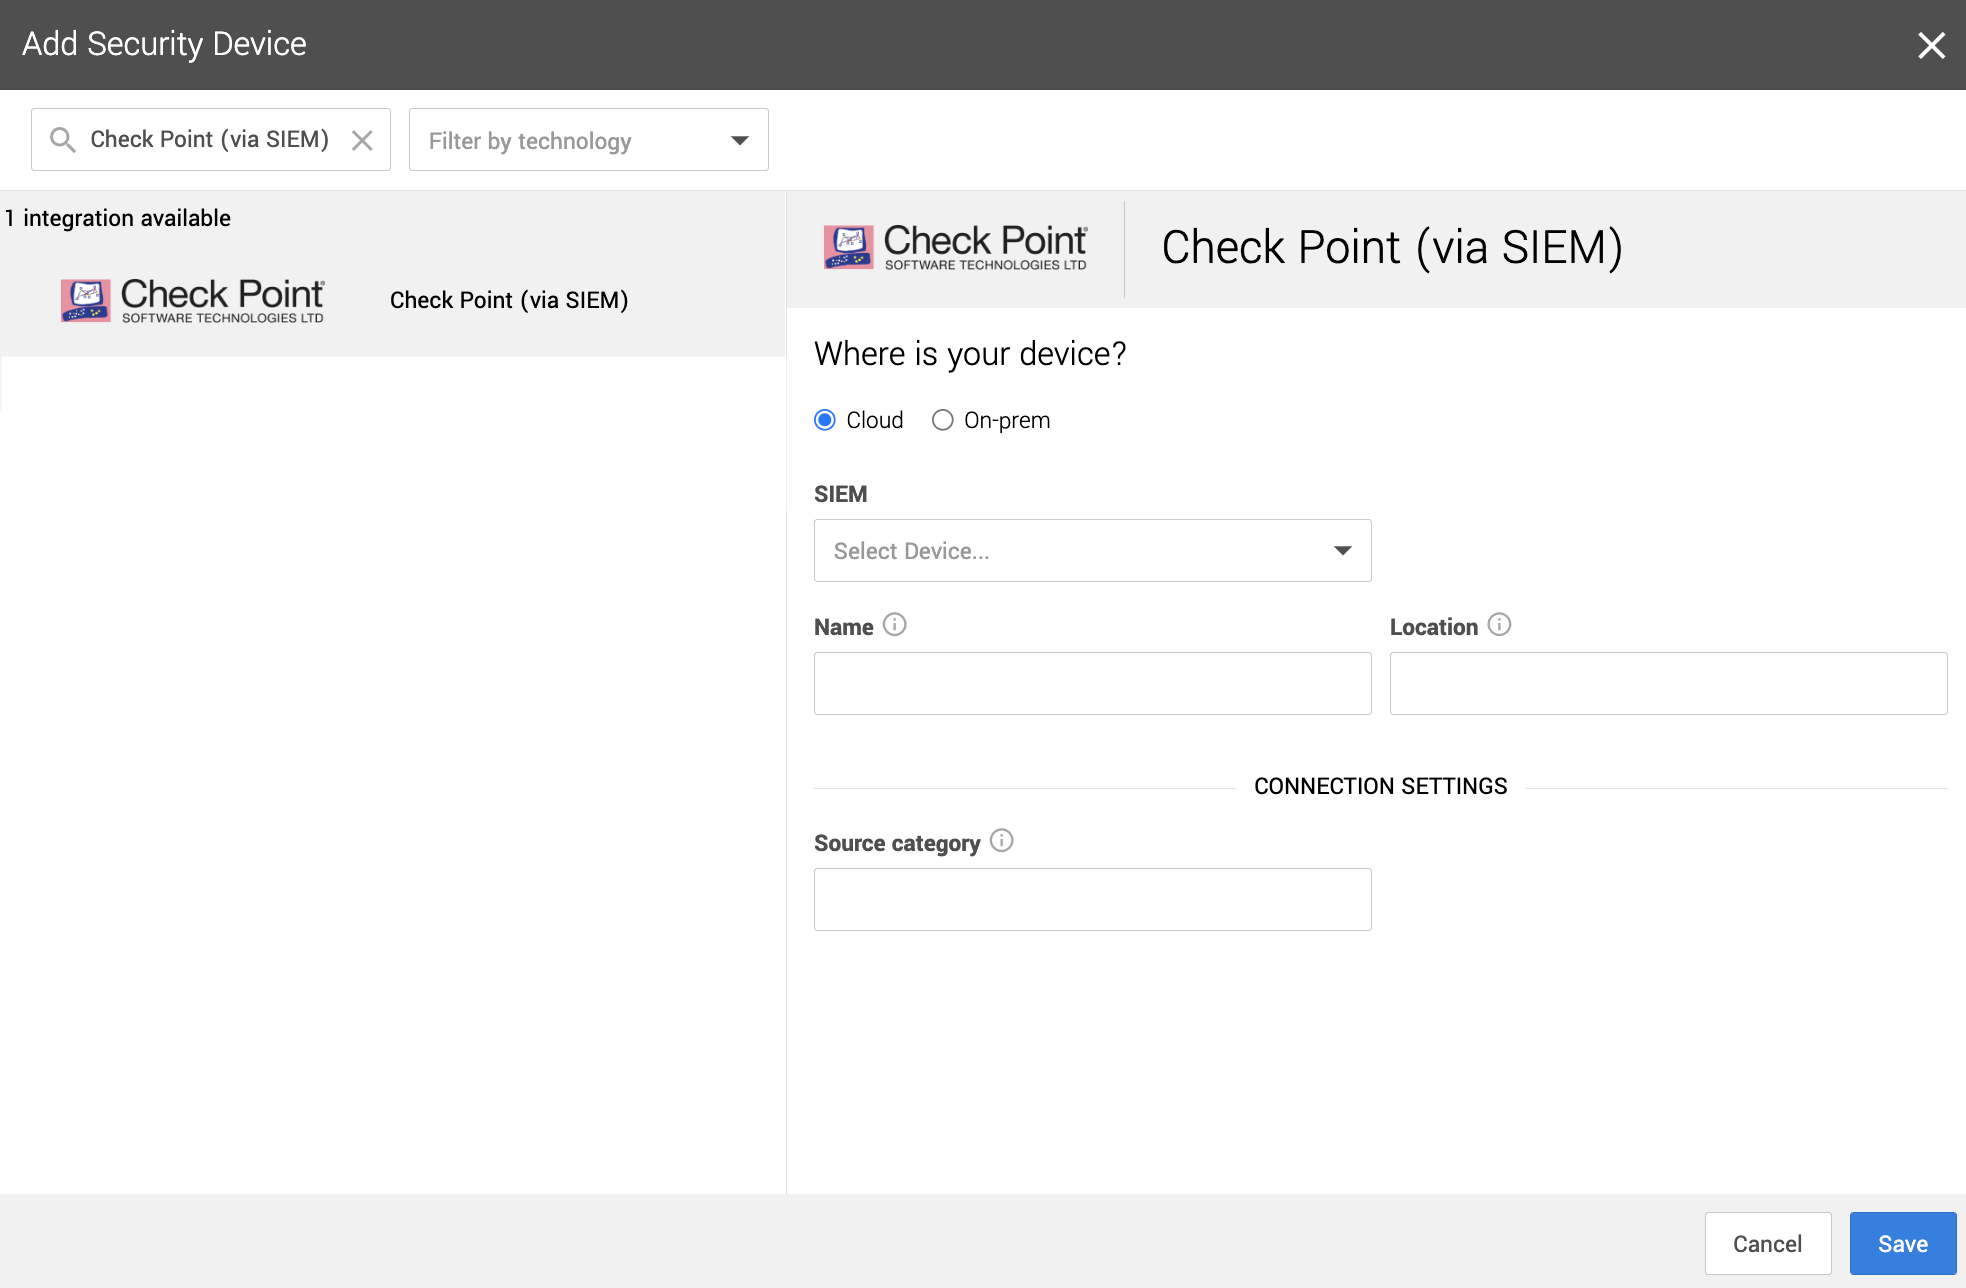
2. Fill in the device fields like this:
1. For SIEM select the SIEM that was onboarded in Step 2.
2. For Name type the host name of the Check Point device.
3. For Location type the geographic location of the device.
3. Fill in the Connection Settings fields based on the SIEM selected:
1. For Source category, type in the Sumo Logic source category for this device.
4. Click Save.
You can see if the device is healthy on the Security Devices page. It may take
a few minutes to see the device listed as healthy.
To check if alerts are coming through, navigate to the Alerts Analysis page.
Scroll to the device you want to check and click View alerts. Switch to grid
view, then check the list for device alerts. It can take 36 to 72 hours for
alerts to appear after setup, as we tune your device.
### Tip
This article was accurate at the time of writing, but changes happen. If you
find the instructions are outdated, leave a description in the comment field
below and let us know!
|
Cisco FirePower via SIEM setup for Workbench | https://support.expel.io/hc/en-us/articles/11455981103379-Cisco-FirePower-via-SIEM-setup-for-Workbench | 2022-11-21T21:23:03 | This procedure helps you to connect your Cisco FirePower via SIEM to the Expel
Workbench. The procedure is to port in logs by creating a new Syslog source,
configuring that source in Workbench, then configure your Cisco FirePower via
SIEM device in Workbench.
### Note
Some steps in this procedure vary greatly depending upon the SIEM-based
technology you use.
#### In this article
* Step 1: Logging Cisco FirePower to a desired SIEM
* Step 2: Configure the SIEM in Workbench
* Step 3: Configure Cisco FirePower via SIEM in Workbench
## Step 1: Logging Cisco FirePower to a desired SIEM
Refer to your SIEM documentation or work with your SIEM representative to port
in Cisco FirePower logs. You can also refer to the following web references
for creating a new Syslog source:
* Sumo Logic
* Splunk
* Microsoft Sentinel
## Step 2: Configure the SIEM in Workbench
This link opens the Expel Knowledge Base section for connecting SIEM-based
technology to Workbench. Follow the applicable article to configure your SIEM-
based tech and confirm that Cisco FirePower logs are flowing through and
available.
## Step 3: Configure Cisco FirePower via SIEM in Workbench
Now that we have the correct access configured and noted the credentials, we
can integrate your tech with Workbench.
### Note
Expel secures all login information our SOC analysts need about your devices
in a MFA password product. Access to this login information is protected using
our internal MFA processes. To learn more about the IP addresses all Expel
traffic comes from, go here.
1. In a new browser tab, go to https://workbench.expel.io/settings/security-devices?setupIntegration=cisco_firepower.
---
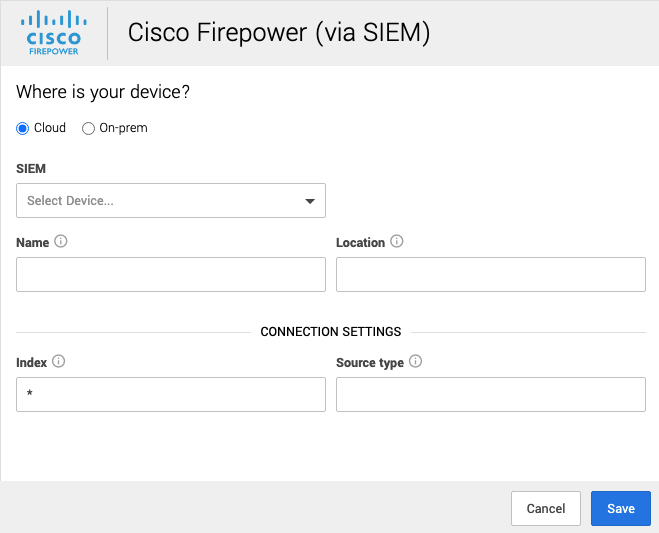
2. Fill in the device fields like this:
* For SIEM, select the SIEM that was onboarded in Step 2.
* For Name, type the host name of the Cisco FirePower device.
* For Location, type the geographic location of the device.
3. Fill in the Connection Settings fields based on the SIEM you selected:
* For Index, type in the SIEM index.
* For Source type, type the Splunk source type for this device.
4. Click Save.
You can see if the device is healthy on the Security Devices page. It may take
a few minutes to see the device listed as healthy.
To check if alerts are coming through, navigate to the Alerts Analysis page.
Scroll to the device you want to check and click View alerts. Switch to grid
view, then check the list for device alerts. It can take 36 to 72 hours for
alerts to appear after setup, as we tune your device.
### Tip
This article was accurate at the time of writing, but changes happen. If you
find the instructions are outdated, leave a description in the comment field
below and let us know!
|
Cisco Meraki via SIEM setup for Workbench | https://support.expel.io/hc/en-us/articles/11455981226003-Cisco-Meraki-via-SIEM-setup-for-Workbench | 2022-11-21T21:23:04 | This procedure helps you to connect your Cisco Meraki via SIEM to the Expel
Workbench. The procedure is to port in logs by creating a new Syslog source,
configuring that source in Workbench, then configure your Cisco Meraki via
SIEM device in Workbench.
### Note
Some steps in this procedure vary greatly depending upon the SIEM-based
technology you use.
#### In this article
* Step 1: Logging Cisco Meraki to a desired SIEM
* Step 2: Configure the SIEM in Workbench
* Step 3: Configure Cisco Meraki via SIEM in Workbench
## Step 1: Logging Cisco Meraki to a desired SIEM
Refer to your SIEM documentation or work with your SIEM representative to port
in Cisco Meraki logs. You can also refer to the following web references for
creating a new Syslog source:
* Sumo Logic
* Splunk
## Step 2: Configure the SIEM in Workbench
This link opens the Expel Knowledge Base section for connecting SIEM-based
technology to Workbench. Follow the applicable article to configure your SIEM-
based tech and confirm that Cisco Meraki logs are flowing through and
available.
## Step 3: Configure Cisco Meraki via SIEM in Workbench
Now that we have the correct access configured and noted the credentials, we
can integrate your tech with Workbench.
### Note
Expel secures all login information our SOC analysts need about your devices
in a MFA password product. Access to this login information is protected using
our internal MFA processes. To learn more about the IP addresses all Expel
traffic comes from, go here.
1. In a new browser tab, go to https://workbench.expel.io/settings/security-devices?setupIntegration=cisco_meraki.
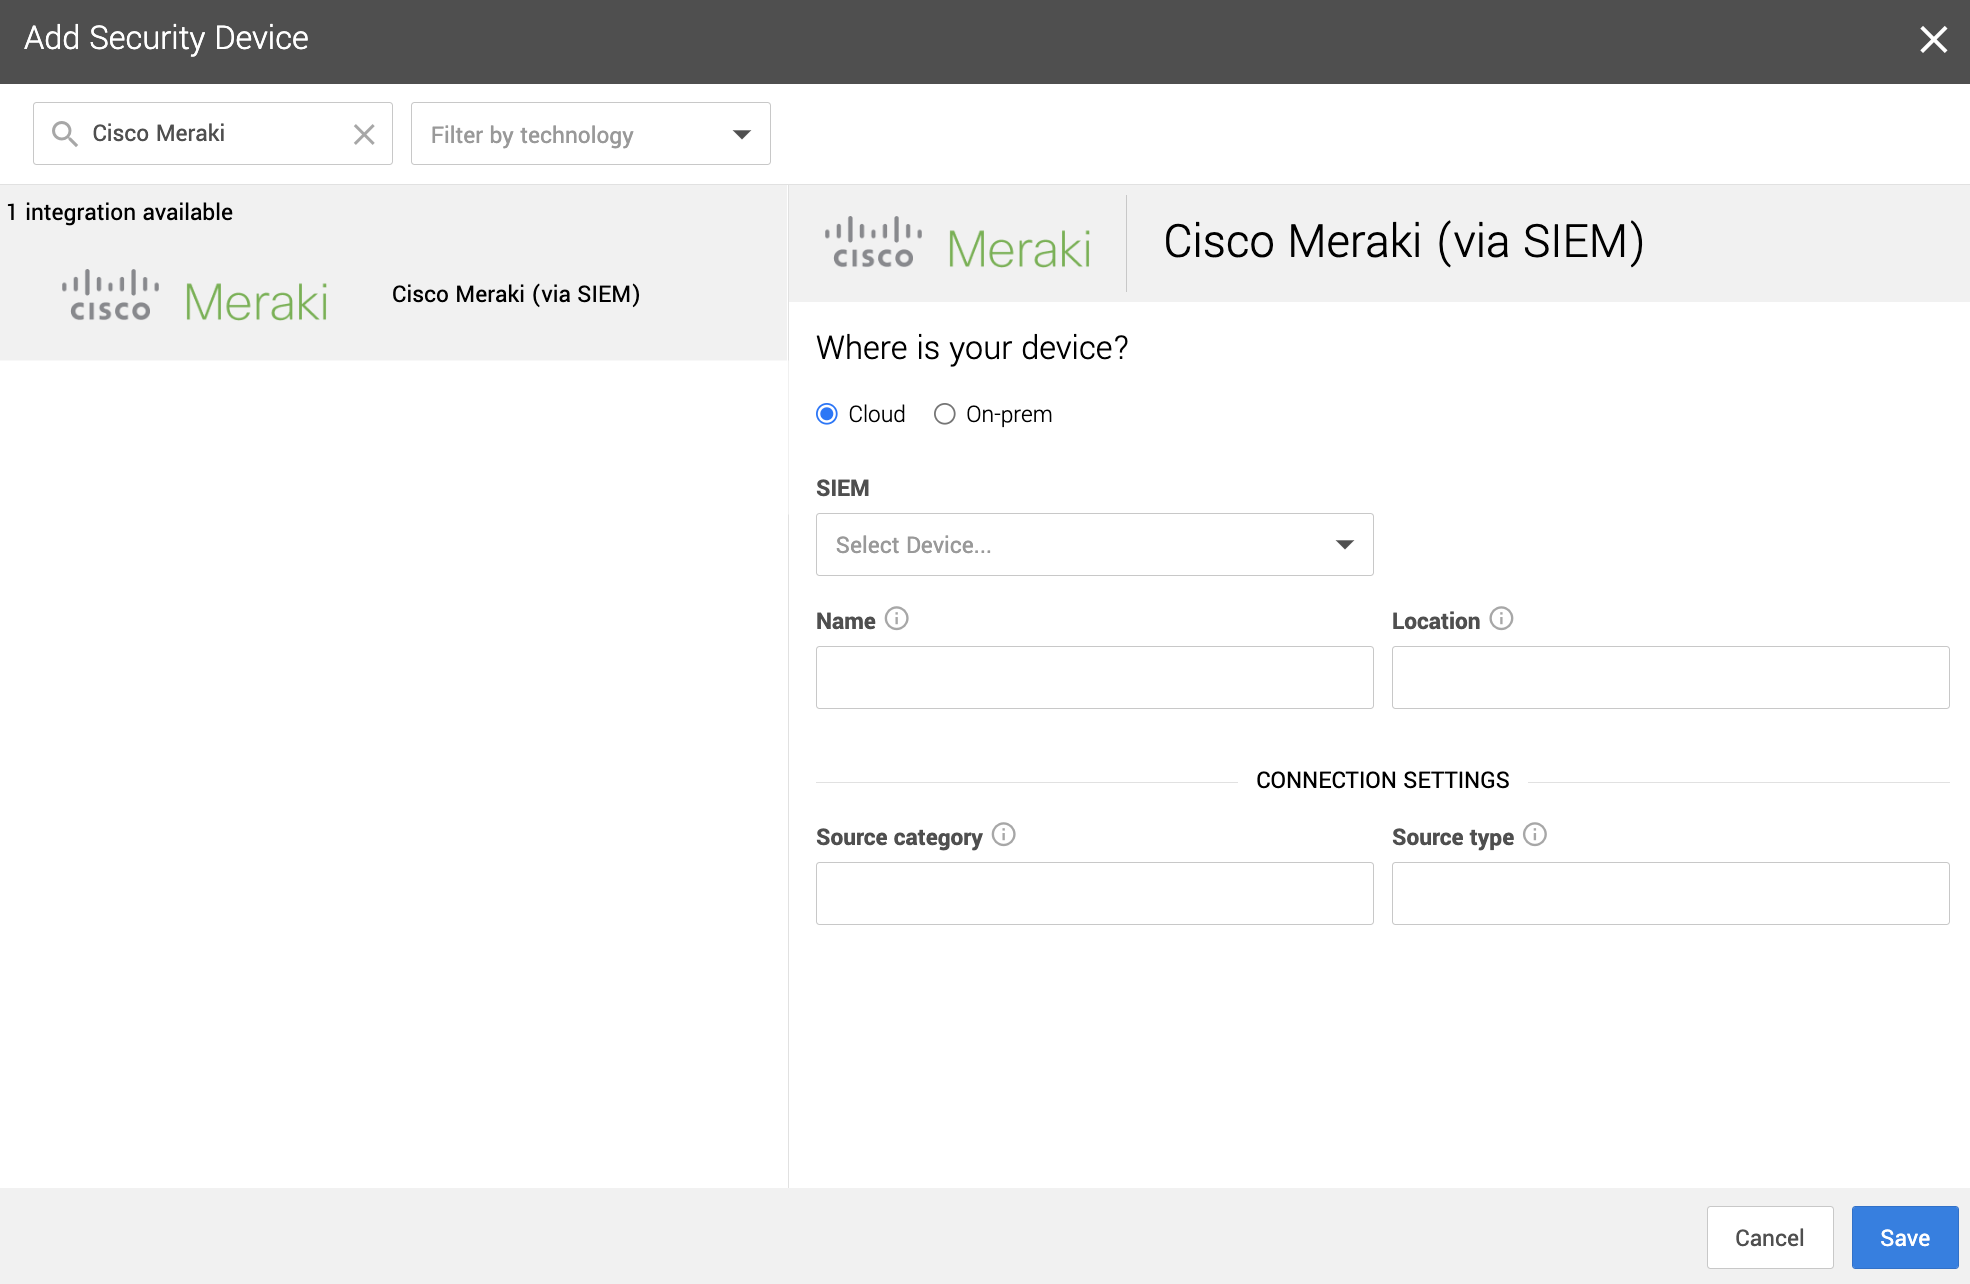
2. Fill in the device fields like this:
* For SIEM, select the SIEM that was onboarded in Step 2.
* For Name, type the host name of the Cisco Meraki device.
* For Location, type the geographic location of the device.
3. Fill in the Connection Settings fields based on the SIEM you selected:
* For Source category, type the Sumo Logic source category for this device.
* For Source type, type the Splunk source type for this device.
4. Click Save.
You can see if the device is healthy on the Security Devices page. It may take
a few minutes to see the device listed as healthy.
To check if alerts are coming through, navigate to the Alerts Analysis page.
Scroll to the device you want to check and click View alerts. Switch to grid
view, then check the list for device alerts. It can take 36 to 72 hours for
alerts to appear after setup, as we tune your device.
### Tip
This article was accurate at the time of writing, but changes happen. If you
find the instructions are outdated, leave a description in the comment field
below and let us know!
|
CyberArk via SIEM setup for Workbench | https://support.expel.io/hc/en-us/articles/11455981281299-CyberArk-via-SIEM-setup-for-Workbench | 2022-11-21T21:23:05 | This procedure helps you to connect your CyberArk via SIEM to the Expel
Workbench. The procedure is to port in logs by creating a new Syslog source,
configuring that source in Workbench, then configure your CyberArk via SIEM
device in Workbench.
### Note
Some steps in this procedure vary greatly depending upon the SIEM-based
technology you use.
#### In this article
* Step 1: Logging CyberArk to a desired SIEM
* Step 2: Configure the SIEM in Workbench
* Step 3: Configure CyberArk via SIEM in Workbench
## Step 1: Logging CyberArk to a desired SIEM
Refer to your SIEM documentation or work with your SIEM representative to port
in CyberArk logs. You can also refer to the following web references for
creating a new Syslog source:
* Splunk
## Step 2: Configure the SIEM in Workbench
This link opens the Expel Knowledge Base section for connecting SIEM-based
technology to Workbench. Follow the applicable article to configure your SIEM-
based tech and confirm that CyberArk logs are flowing through and available.
## Step 3: Configure CyberArk via SIEM in Workbench
Now that we have the correct access configured and noted the credentials, we
can integrate your tech with Workbench.
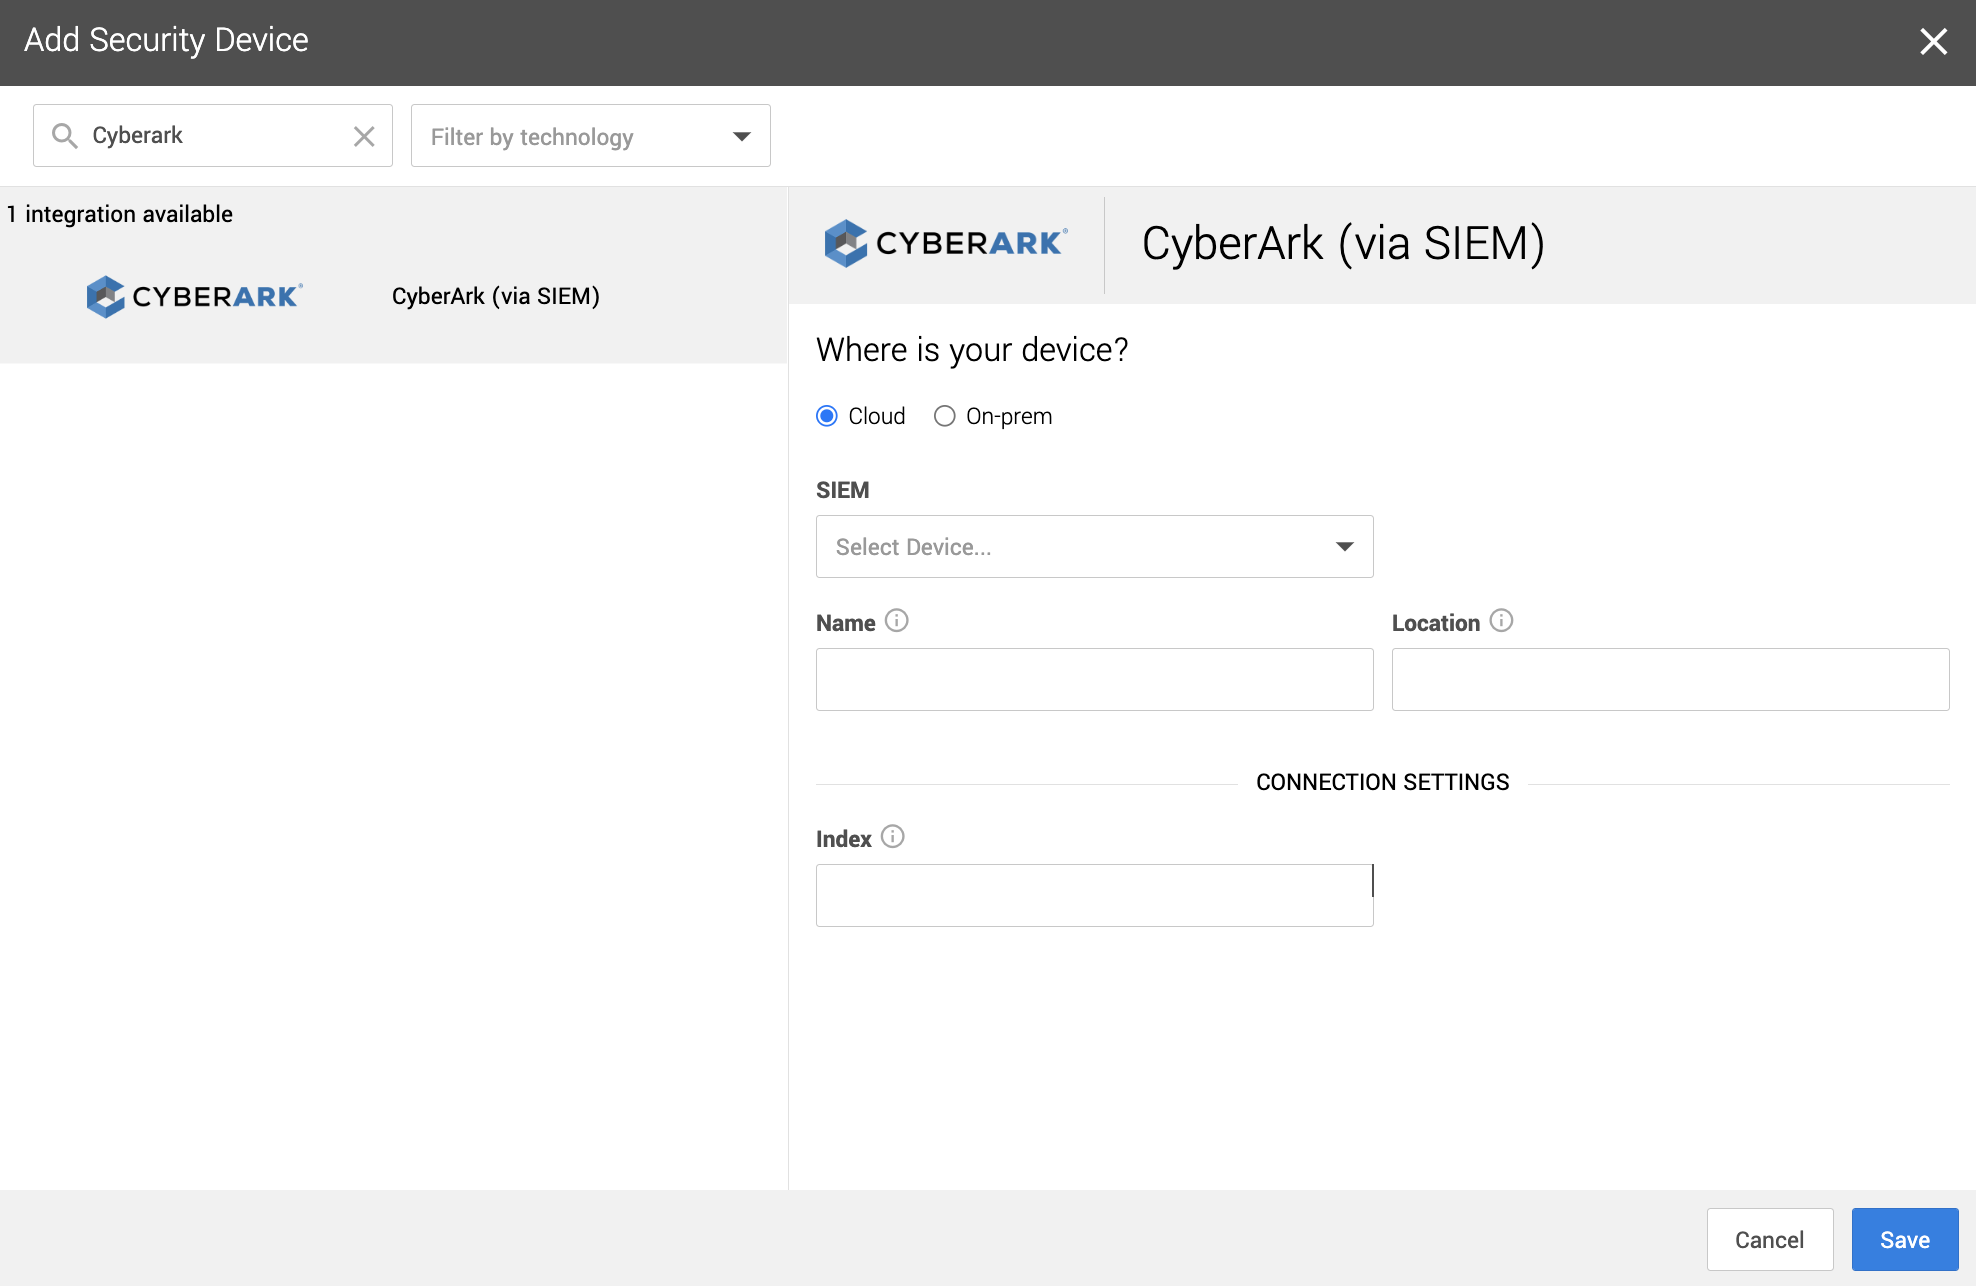
1. In a new browser tab, go to https://workbench.expel.io/settings/security-devices?setupIntegration=cyberark_siem.
---
2. Fill in the device fields like this:
* For SIEM, select the SIEM that was onboarded in Step 2.
* For Name, type the host name of the CyberArk device.
* For Location, type the geographic location of the device.
3. Fill in the Connection Settings field based on the Splunk SIEM selected:
* For Index, type in the Splunk index where the logs are located.
4. Click Save.
You can see if the device is healthy on the Security Devices page. It may take
a few minutes to see the device listed as healthy.
To check if alerts are coming through, navigate to the Alerts Analysis page.
Scroll to the device you want to check and click View alerts. Switch to grid
view, then check the list for device alerts. It can take 36 to 72 hours for
alerts to appear after setup, as we tune your device.
|
Palo Alto Networks via SIEM setup for Workbench | https://support.expel.io/hc/en-us/articles/11455981555603-Palo-Alto-Networks-via-SIEM-setup-for-Workbench | 2022-11-21T21:23:08 | This article helps you to connect your Palo Alto Networks via SIEM to the
Expel Workbench. The procedure is to port in logs by creating a new Syslog
source, configuring that source in Workbench, then configure your Palo Alto
Networks via SIEM device in Workbench.
### Note
Some steps in this procedure vary greatly depending upon the SIEM-based
technology you use.
#### In this article
* Step 1: Logging Palo Alto Networks to a desired SIEM
* Step 2: Configure the SIEM in Workbench
* Step 3: Configure Palo Alto Networks via SIEM in Workbench
## Step 1: Logging Palo Alto Networks to a desired SIEM
Refer to your SIEM documentation or work with your SIEM representative to port
in Palo Alto Networks logs. You can also refer to the following web references
for creating a new Syslog source:
* Sumo Logic
* Splunk
## Step 2: Configure the SIEM in Workbench
This link opens the Expel Knowledge Base section for connecting SIEM-based
technology to Workbench. Follow the applicable article to configure your SIEM-
based tech and confirm that Palo Alto Networks logs are flowing through and
available.
## Step 3: Configure Palo Alto Networks via SIEM in Workbench
Now that we have the correct access configured and noted the credentials, we
can integrate your tech with Workbench.
### Note
Expel secures all login information our SOC analysts need about your devices
in a MFA password product. Access to this login information is protected using
our internal MFA processes. To learn more about the IP addresses all Expel
traffic comes from, go here.
1. In a new browser tab, go to https://workbench.expel.io/settings/security-devices?setupIntegration=palo_alto_networks_siem.
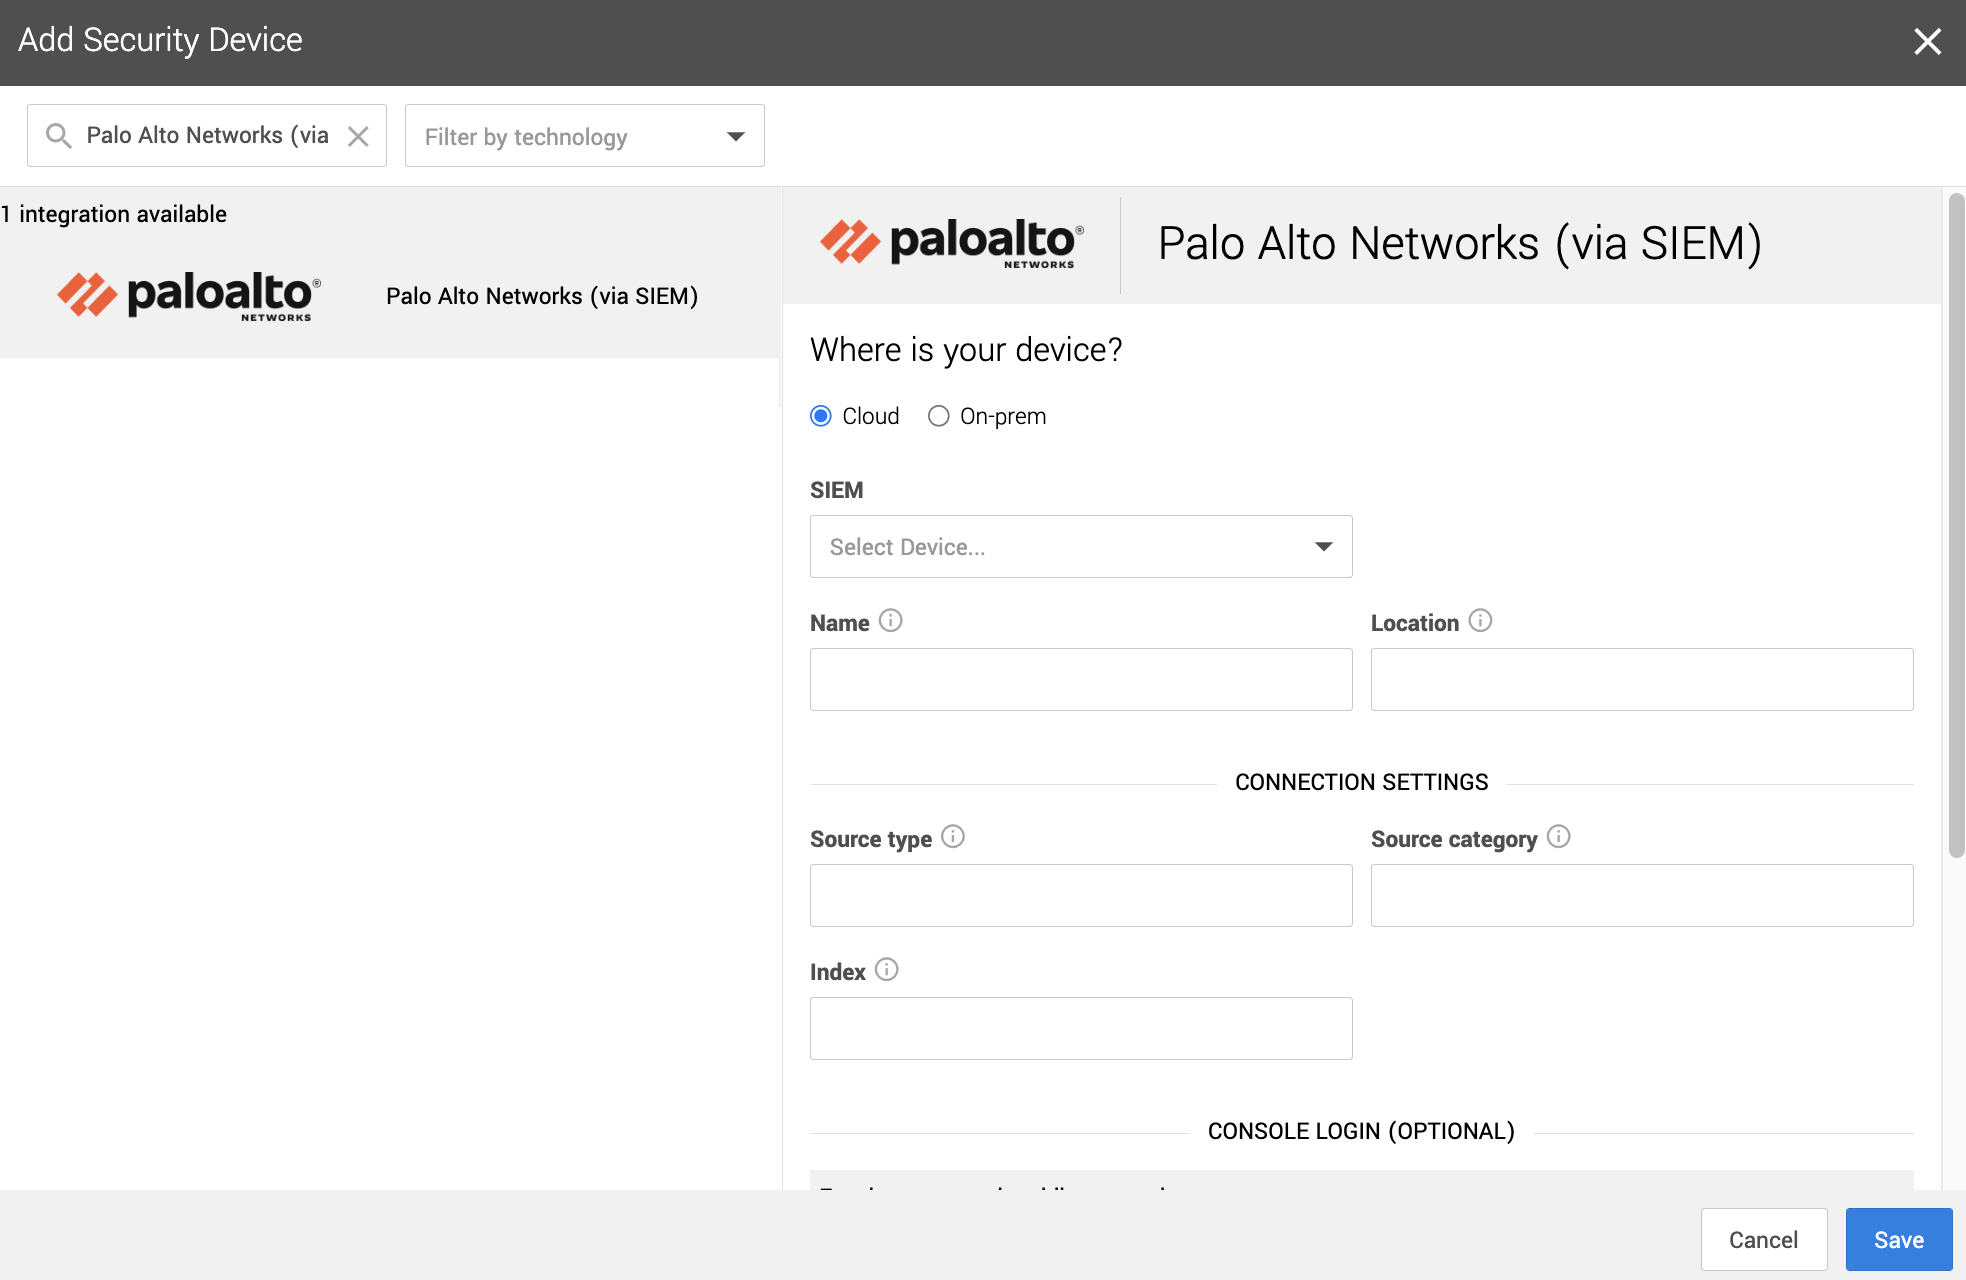
2. Fill in the device fields like this:
* For SIEM, select the SIEM that was onboarded in Step 2.
* For Name, type the host name of the Palo Alto Networks device.
* For Location, type the geographic location of the device.
3. Fill in the Connection Settings fields based on the SIEM you selected:
* For Source category, type the Sumo Logic source category for this device.
* For Source type, type the Splunk source type for this device.
* For Index, type in the Splunk index where the logs are located
4. Click Save.
You can see if the device is healthy on the Security Devices page. It may take
a few minutes to see the device listed as healthy.
To check if alerts are coming through, navigate to the Alerts Analysis page.
Scroll to the device you want to check and click View alerts. Switch to grid
view, then check the list for device alerts. It can take 36 to 72 hours for
alerts to appear after setup, as we tune your device.
### Tip
This article was accurate at the time of writing, but changes happen. If you
find the instructions are outdated, leave a description in the comment field
below and let us know!
|
Cisco ASA via SIEM setup for Workbench | https://support.expel.io/hc/en-us/articles/11455992258323-Cisco-ASA-via-SIEM-setup-for-Workbench | 2022-11-21T21:23:02 | This procedure helps you to connect your Cisco ASA via SIEM to the Expel
Workbench. The procedure is to port in logs by creating a new Syslog source,
configuring that source in Workbench, then your Cisco ASA through SIEM device
in Workbench.
### Note
Some steps in this procedure vary greatly depending upon the SIEM-based
technology you use.
#### In this article
* Step 1: Logging Cisco ASA to a desired SIEM
* Step 2: Configure the SIEM in Workbench
* Step 3: Configure Cisco ASA via SIEM in Workbench
## Step 1: Logging Cisco ASA to a desired SIEM
Refer to your SIEM documentation or work with your SIEM representative to port
in Cisco ASA logs. You can also refer to the following web references for
creating a new Syslog source:
* Sumo Logic
* Splunk
## Step 2: Configure the SIEM in Workbench
This link opens the Expel Knowledge Base section for connecting SIEM-based
technology to Workbench. Follow the applicable article to configure your SIEM-
based tech and confirm that Cisco ASA logs are flowing through and available.
## Step 3: Configure Cisco ASA via SIEM in Workbench
Now that we have the correct access configured and noted the credentials, we
can integrate your tech with Workbench.
### Note
Expel secures all login information our SOC analysts need about your devices
in a MFA password product. Access to this login information is protected using
our internal MFA processes. To learn more about the IP addresses all Expel
traffic comes from, go here.
1. In a new browser tab, go to https://workbench.expel.io/settings/security-devices?setupIntegration=cisco_asa.
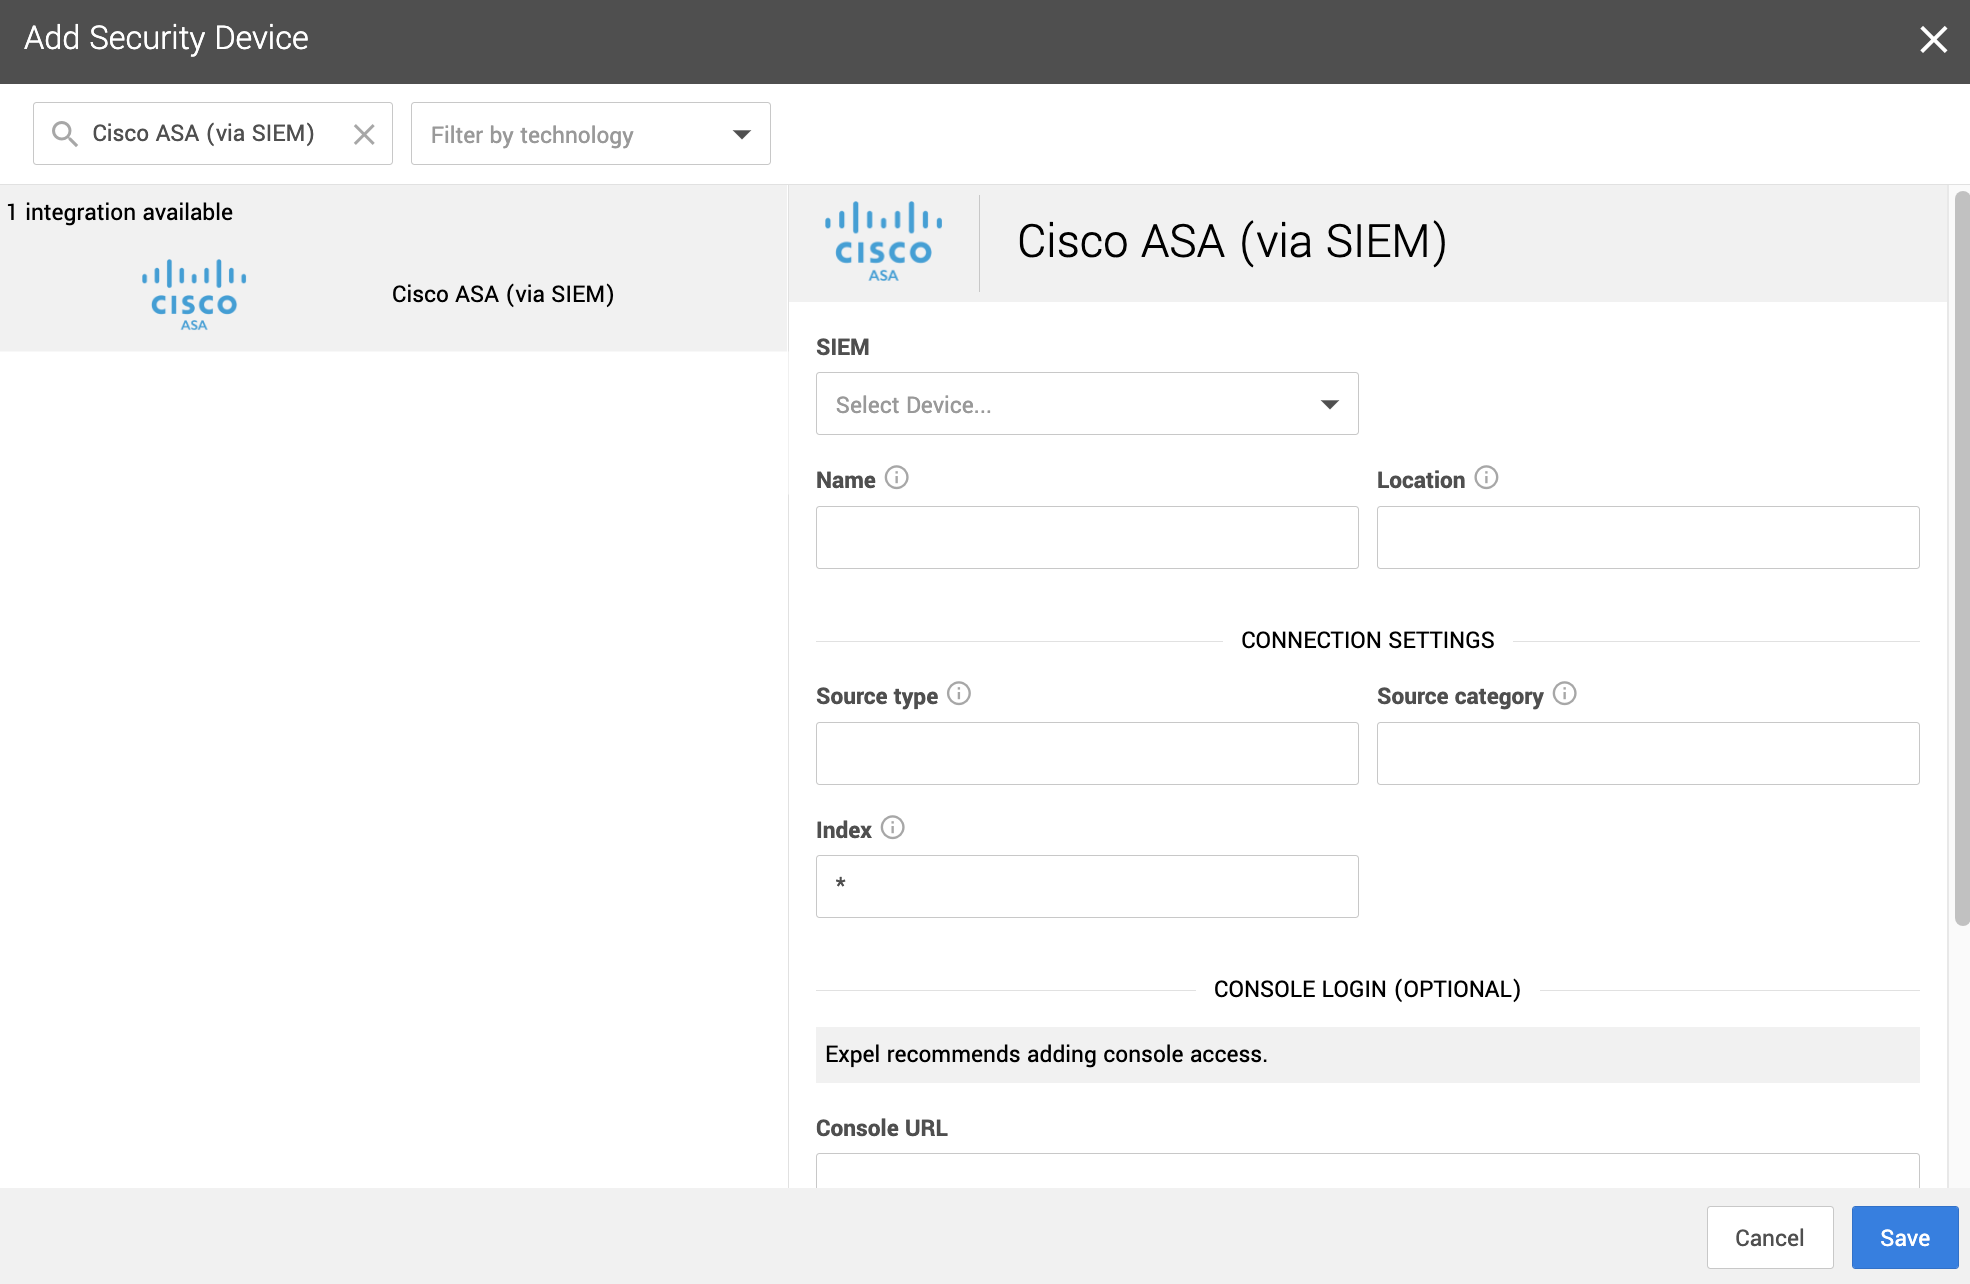
2. Fill in the device fields like this:
* For SIEM, select the SIEM that was onboarded in Step 2.
* For Name, type the host name of the Cisco ASA device.
* For Location, type the geographic location of the device.
3. Fill in the Connection Settings fields based on the SIEM you selected:
* For Source type, type the Splunk source type for this device.
* For Source category, type the Sumo Logic source category for this device.
* For Index, type in the Splunk index where the logs are located. By default this is filled in with a wildcard (*).
4. Click Save.
You can see if the device is healthy on the Security Devices page. It may take
a few minutes to see the device listed as healthy.
To check if alerts are coming through, navigate to the Alerts Analysis page.
Scroll to the device you want to check and click View alerts. Switch to grid
view, then check the list for device alerts. It can take 36 to 72 hours for
alerts to appear after setup, as we tune your device.
### Tip
This article was accurate at the time of writing, but changes happen. If you
find the instructions are outdated, leave a description in the comment field
below and let us know!
|
CylancePROTECT via SIEM setup for Workbench | https://support.expel.io/hc/en-us/articles/11455992575379-CylancePROTECT-via-SIEM-setup-for-Workbench | 2022-11-21T21:23:06 | This procedure helps you to connect your CylancePROTECT via SIEM to the Expel
Workbench. The procedure is to port in logs by creating a new Syslog source,
configuring that source in Workbench, then configure your CylancePROTECT
device in Workbench.
### Note
Some steps in this procedure vary greatly depending upon the SIEM-based
technology you use.
#### In this article
* Step 1: Logging CylancePROTECT to a desired SIEM
* Step 2: Configure the SIEM in Workbench
* Step 3: Configure CylancePROTECT via SIEM in Workbench
## Step 1: Logging CylancePROTECT to a desired SIEM
Refer to your SIEM documentation or work with your SIEM representative to port
in CylancePROTECT logs. You can also refer to the following web references for
creating a new Syslog source:
* Sumo Logic
## Step 2: Configure the SIEM in Workbench
This link opens the Expel Knowledge Base section for connecting SIEM-based
technology to Workbench. Follow the applicable article to configure your SIEM-
based tech and confirm that CylancePROTECT logs are flowing through and
available.
## Step 3: Configure CylancePROTECT via SIEM in Workbench
Now that we have the correct access configured and noted the credentials, we
can integrate your tech with Workbench.
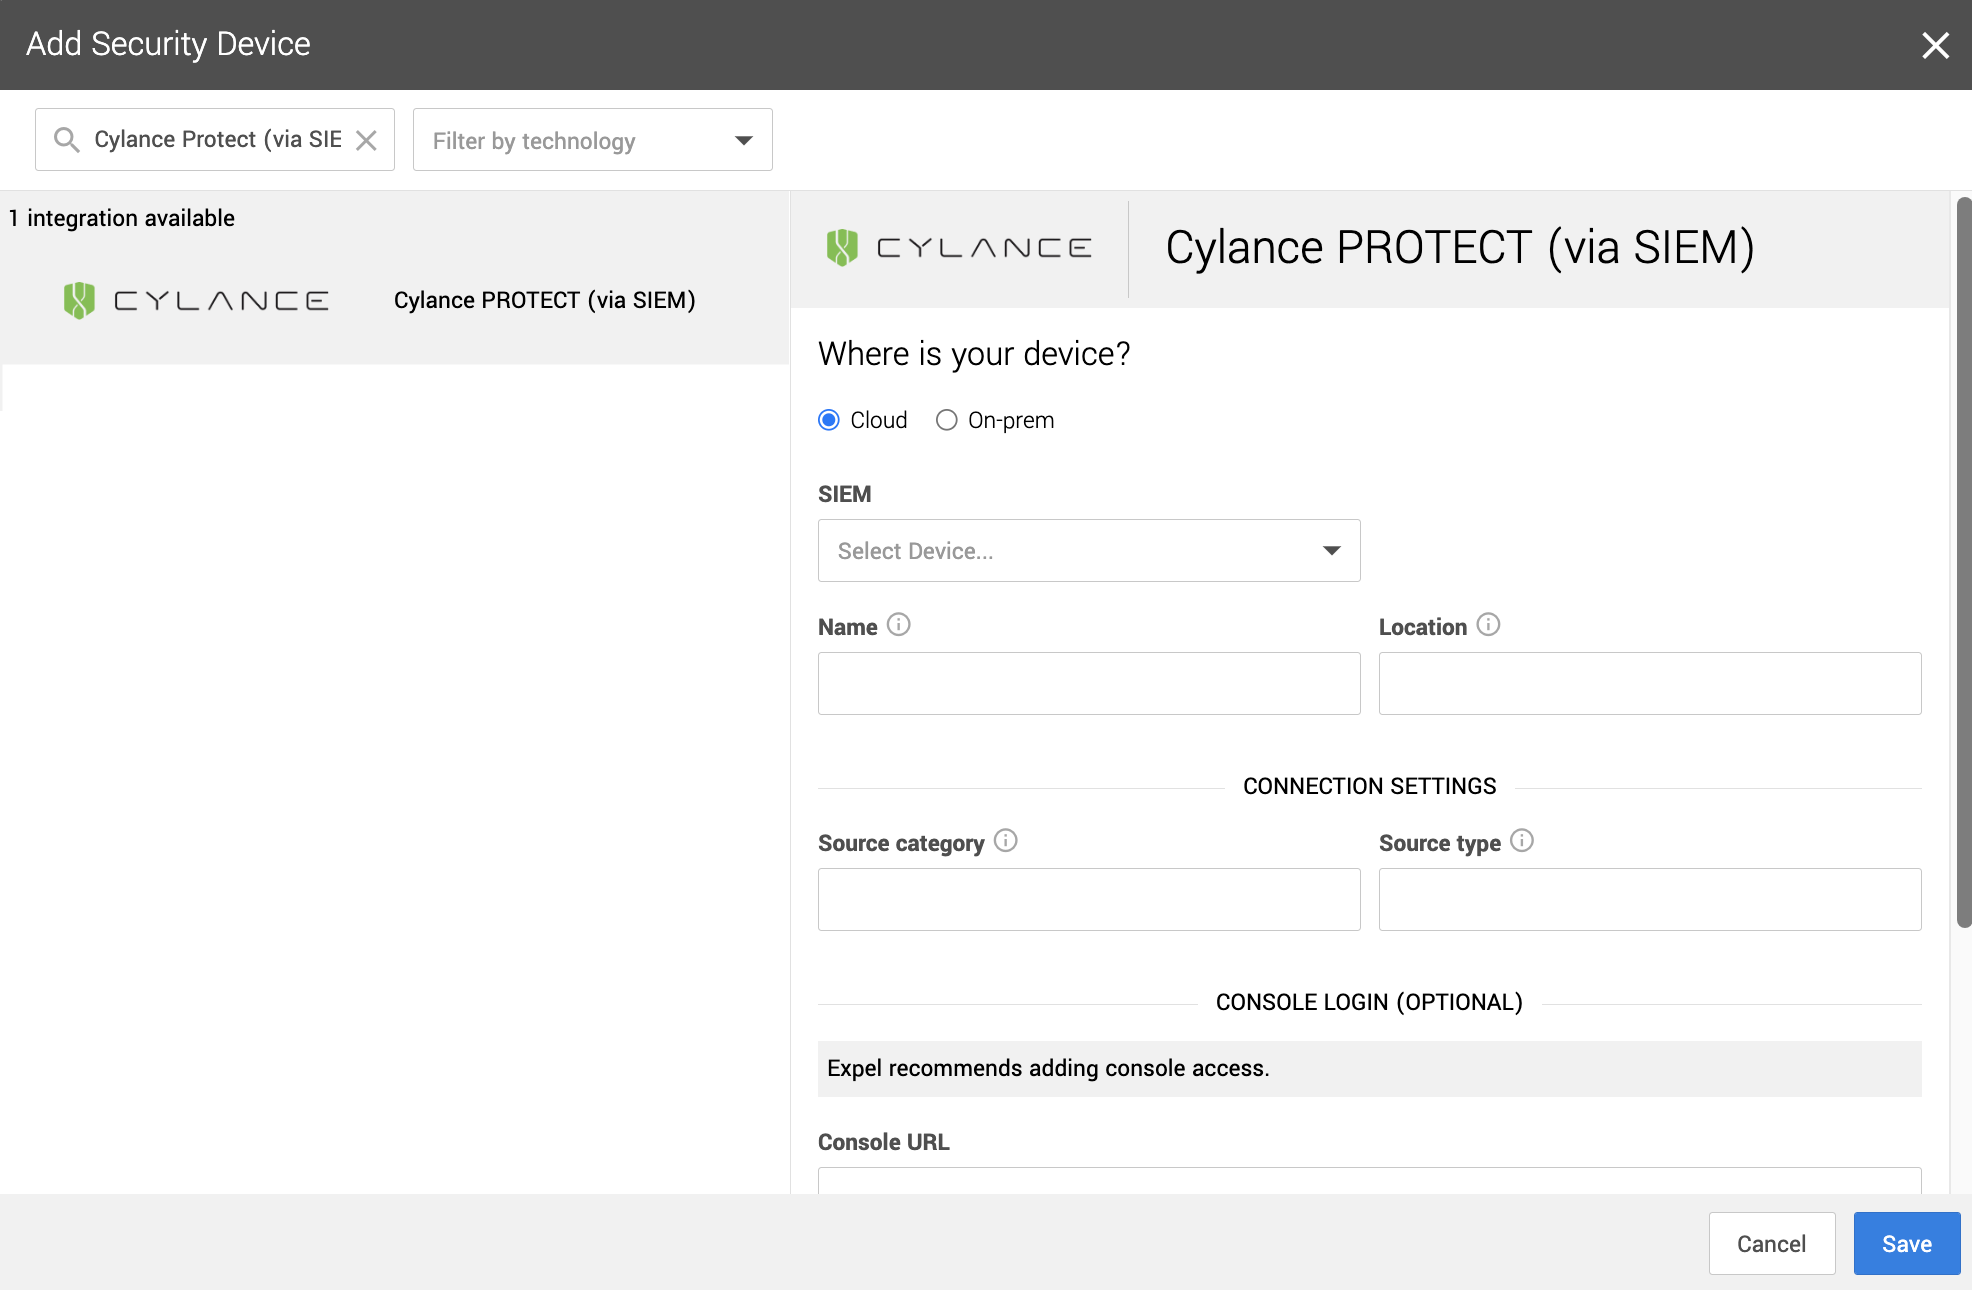
1. In a new browser tab, go to https://workbench.expel.io/settings/security-devices?setupIntegration=cylance.
---
2. Fill in the device fields like this:
* SIEM, select the SIEM that was onboarded in Step 2.
* For Name, type the host name of the CylancePROTECT device.
* For Location, type the geographic location of the device
3. Fill in the Connection Settings field based on the Sumo Logic SIEM you selected:
* For Source category, type the Sumo Logic source category for this device.
4. Click Save.
You can see if the device is healthy on the Security Devices page. It may take
a few minutes to see the device listed as healthy.
To check if alerts are coming through, navigate to the Alerts Analysis page.
Scroll to the device you want to check and click View alerts. Switch to grid
view, then check the list for device alerts. It can take 36 to 72 hours for
alerts to appear after setup, as we tune your device.
### Tip
This article was accurate at the time of writing, but changes happen. If you
find the instructions are outdated, leave a description in the comment field
below and let us know!
|
Forcepoint via SIEM setup for Workbench | https://support.expel.io/hc/en-us/articles/11455992644371-Forcepoint-via-SIEM-setup-for-Workbench | 2022-11-21T21:23:07 | This article helps you to connect your Forcepoint via SIEM to the Expel
Workbench. The procedure is to port in logs by creating a new Syslog source,
configuring that source in Workbench, then configure your Forcepoint via SIEM
device in Workbench.
### Note
Some steps in this procedure vary greatly depending upon the SIEM-based
technology you use.
#### In this article
* Step 1: Logging Forcepoint to a desired SIEM
* Step 2: Configure the SIEM in Workbench
* Step 3: Configure Forcepoint in Workbench
## Step 1: Logging Forcepoint to a desired SIEM
Refer to your SIEM documentation or work with your SIEM representative to port
in Forcepoint Web Filter logs. You can also refer to the following web
references for creating a new Syslog source:
* Exabeam Fusion SIEM
## Step 2: Configure the SIEM in Workbench
This link opens the Expel Knowledge Base section for connecting SIEM-based
technology to Workbench. Follow the applicable article to configure your SIEM-
based tech and confirm that Forcepoint logs are flowing through and available.
## Step 3: Configure Forcepoint in Workbench
Now that we have the correct access configured and noted the credentials, we
can integrate your tech with Workbench.
### Note
Expel secures all login information our SOC analysts need about your devices
in a MFA password product. Access to this login information is protected using
our internal MFA processes. To learn more about the IP addresses all Expel
traffic comes from, go here.
1. In a new browser tab, go to https://workbench.expel.io/settings/security-devices?setupIntegration=forcepoint_siem.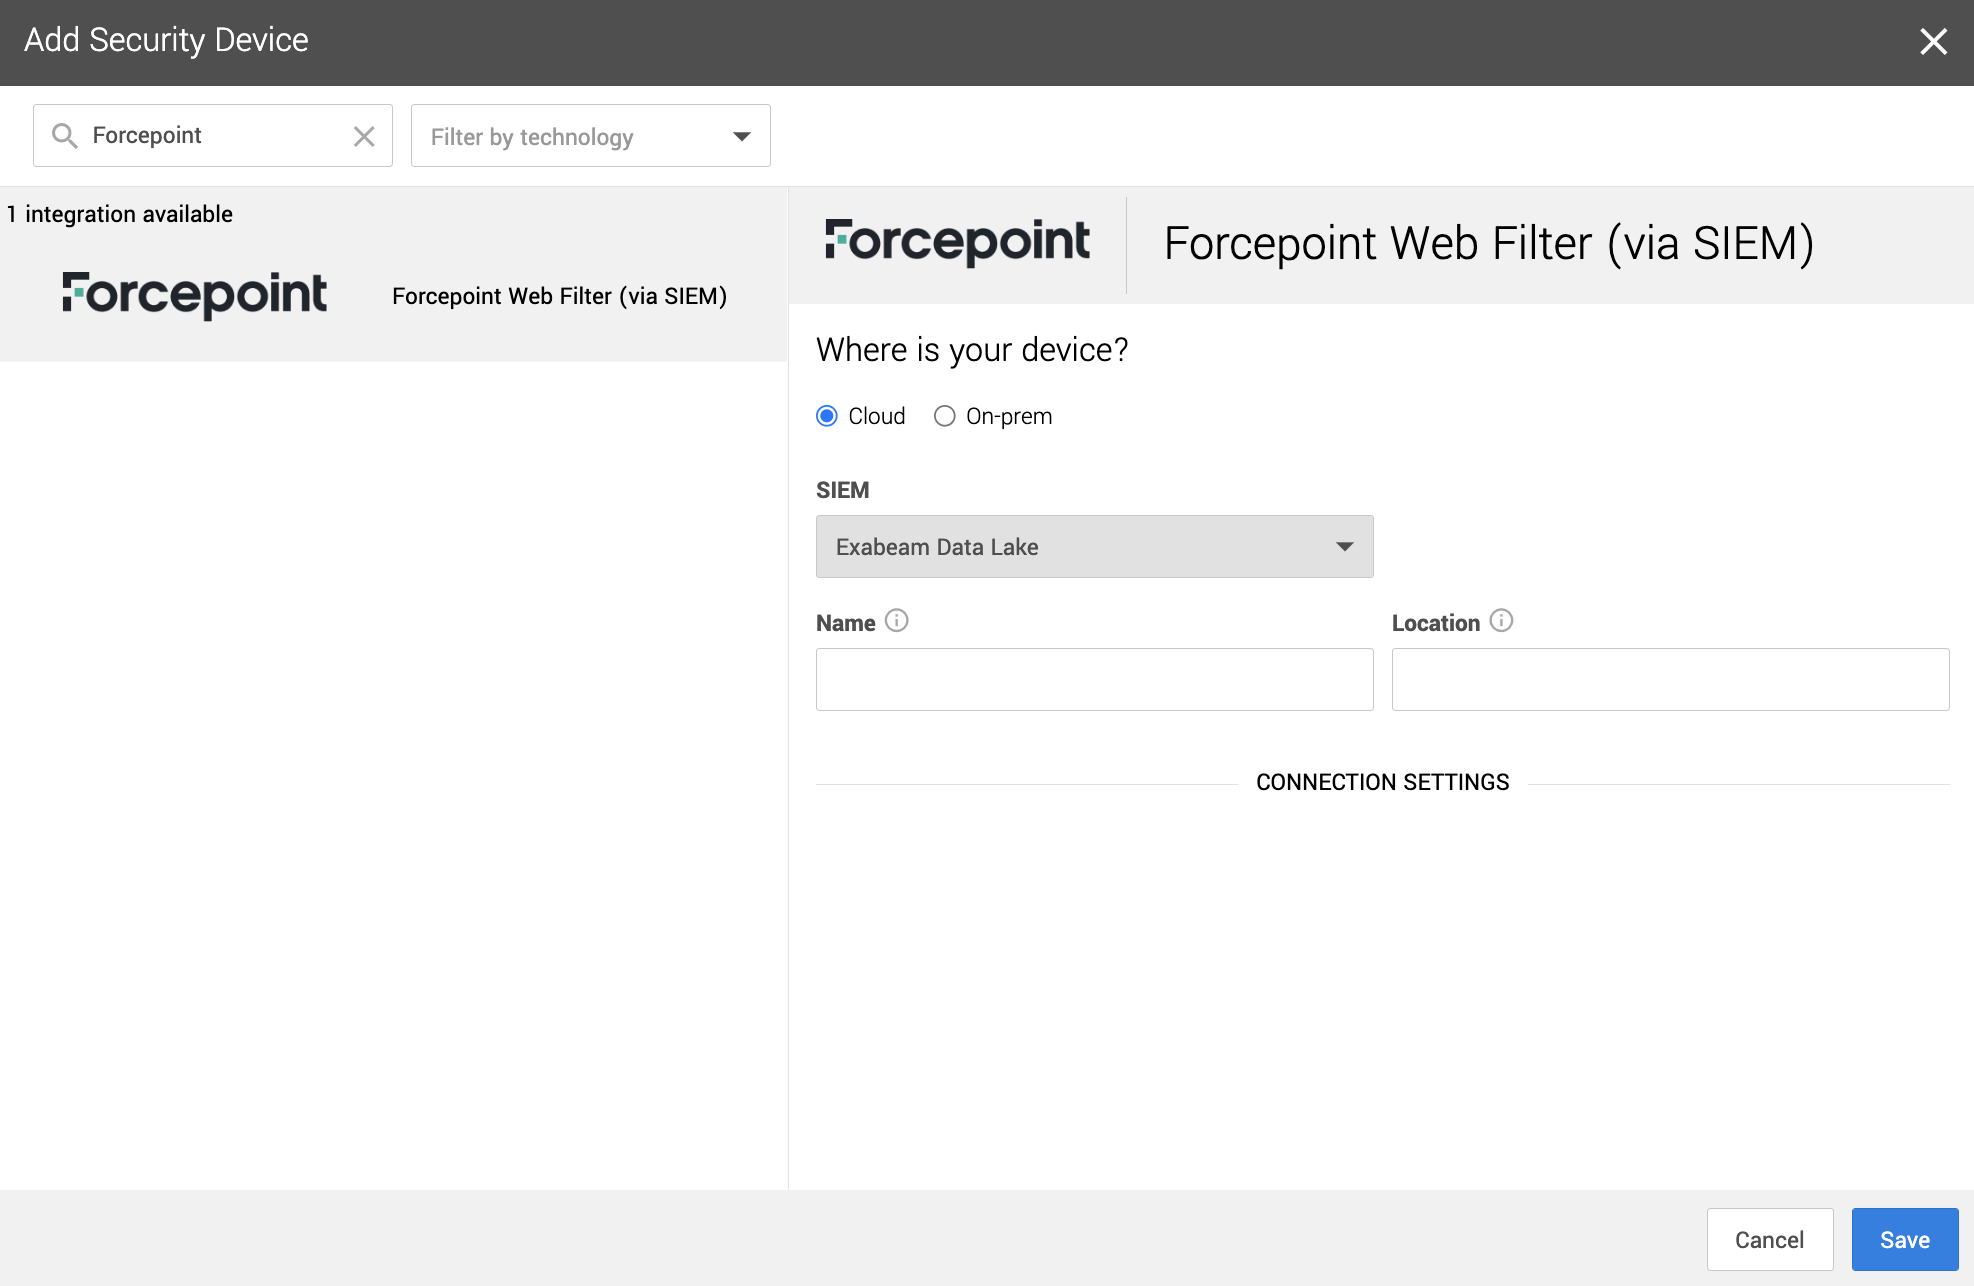
2. Fill in the device fields like this:
* For SIEM, select the SIEM that was onboarded in Step 2.
* For Name, type the host name of the Forcepoint device.
* For Location, type the geographic location of the device.
3. Click Save.
You can see if the device is healthy on the Security Devices page. It may take
a few minutes to see the device listed as healthy.
To check if alerts are coming through, navigate to the Alerts Analysis page.
Scroll to the device you want to check and click View alerts. Switch to grid
view, then check the list for device alerts. It can take 36 to 72 hours for
alerts to appear after setup, as we tune your device.
### Tip
This article was accurate at the time of writing, but changes happen. If you
find the instructions are outdated, leave a description in the comment field
below and let us know!
|
Proofpoint via SIEM setup for Workbench | https://support.expel.io/hc/en-us/articles/11455992832403-Proofpoint-via-SIEM-setup-for-Workbench | 2022-11-21T21:23:08 | This article helps you to connect your Proofpoint via SIEM to the Expel
Workbench. The procedure is to port in logs by creating a new Syslog source,
configuring that source in Workbench, then configure your Proofpoint via SIEM
device in Workbench.
### Note
Some steps in this procedure vary greatly depending upon the SIEM-based
technology you use.
#### In this article
* Step 1: Logging Proofpoint to a desired SIEM
* Step 2: Configure the SIEM in Workbench
* Step 3: Configure Proofpoint via SIEM in Workbench
## Step 1: Logging Proofpoint to a desired SIEM
Refer to your SIEM documentation or work with your SIEM representative to port
in Proofpoint logs. You can also refer to the following web references for
creating a new Syslog source:
* Sumo Logic
## Step 2: Configure the SIEM in Workbench
This link opens the Expel Knowledge Base section for connecting SIEM-based
technology to Workbench. Follow the applicable article to configure your SIEM-
based tech and confirm that Proofpoint logs are flowing through and available.
## Step 3: Configure Proofpoint via SIEM in Workbench
Now that we have the correct access configured and noted the credentials, we
can integrate your tech with Workbench.
### Note
Expel secures all login information our SOC analysts need about your devices
in a MFA password product. Access to this login information is protected using
our internal MFA processes. To learn more about the IP addresses all Expel
traffic comes from, go here.
1. In a new browser tab, go to https://workbench.expel.io/settings/security-devices?setupIntegration=observeit_siem.
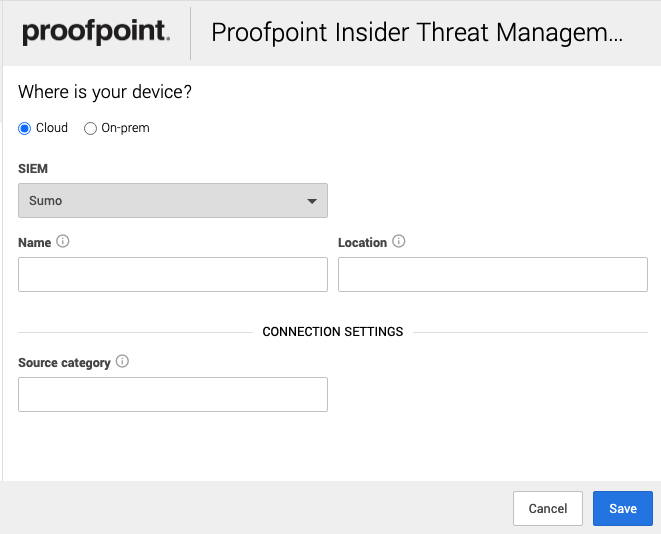
2. Fill in the device fields like this:
* For SIEM, select the SIEM that was onboarded in Step 2.
* For Name, type the host name of the Proofpoint device.
* For Location, type the geographic location of the device.
3. Fill in the Connection Settings fields based on the Sumo Logic SIEM you selected:
* For Source category, type the Sumo Logic source category for this device.
4. Click Save.
You can see if the device is healthy on the Security Devices page. It may take
a few minutes to see the device listed as healthy.
To check if alerts are coming through, navigate to the Alerts Analysis page.
Scroll to the device you want to check and click View alerts. Switch to grid
view, then check the list for device alerts. It can take 36 to 72 hours for
alerts to appear after setup, as we tune your device.
### Tip
This article was accurate at the time of writing, but changes happen. If you
find the instructions are outdated, leave a description in the comment field
below and let us know!
|
Symantec Endpoint Protection via SIEM setup for Workbench | https://support.expel.io/hc/en-us/articles/11455992924563-Symantec-Endpoint-Protection-via-SIEM-setup-for-Workbench | 2022-11-21T21:23:09 | This procedure helps you to connect your Symantec Endpoint Protection via SIEM
to the Expel Workbench. The procedure is to port in logs by creating a new
Syslog source, configuring that source in Workbench, then configure your
Symantec Endpoint Protection via SIEM device in Workbench.
### Note
Some steps in this procedure vary greatly depending upon the SIEM-based
technology you use.
#### In this article
* Step 1: Logging Symantec Endpoint Protection to a desired SIEM
* Step 2: Configure the SIEM in Workbench
* Step 3: Configure Symantec Endpoint Protection in Workbench
## Step 1: Logging Symantec Endpoint Protection to a desired SIEM
Refer to your SIEM documentation or work with your SIEM representative to port
in Symantec Endpoint Protection logs. You can also refer to the following web
references for creating a new Syslog source:
* Sumo Logic
* Splunk
* Exabeam Fusion SIEM
## Step 2: Configure the SIEM in Workbench
This link opens the Expel Knowledge Base section for connecting SIEM-based
technology to Workbench. Follow the applicable article to configure your SIEM-
based tech and confirm that Symantec Endpoint Protection logs are flowing
through and available.
#### Step 3: Configure Symantec Endpoint Protection in Workbench
Now that we have the correct access configured and noted the credentials, we
can integrate your tech with Workbench.
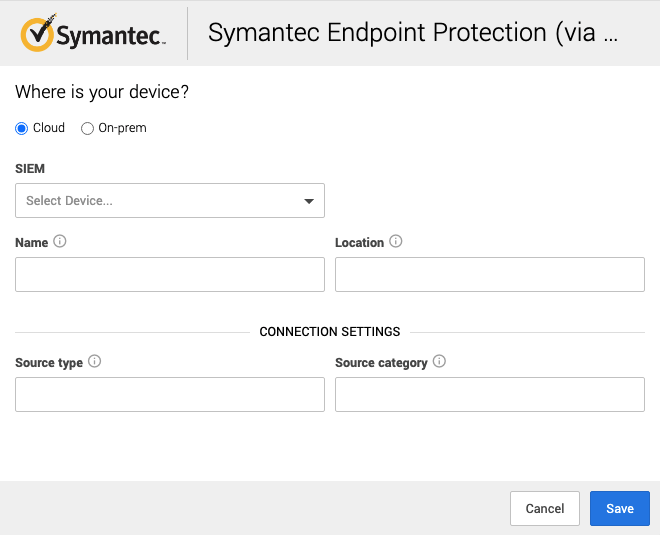
1. In a new browser tab, go to https://workbench.expel.io/settings/security-devices?setupIntegration=symantec_endpoint_protection.
---
2. Fill in the device fields like this:
1. For SIEM, select the SIEM that was onboarded in Step 2.
2. For Name, type the host name of the Symantec Endpoint Protection device.
3. For Location, type the geographic location of the device.
3. Fill in the Connection Settings fields based on the SIEM you selected:
1. For Source category, type the Sumo Logic source category for this device.
2. For Source type, type the Splunk source type for this device.
4. Click Save.
You can see if the device is healthy on the Security Devices page. It may take
a few minutes to see the device listed as healthy.
To check if alerts are coming through, navigate to the Alerts Analysis page.
Scroll to the device you want to check and click View alerts. Switch to grid
view, then check the list for device alerts. It can take 36 to 72 hours for
alerts to appear after setup, as we tune your device.
### Tip
This article was accurate at the time of writing, but changes happen. If you
find the instructions are outdated, leave a description in the comment field
below and let us know!
|
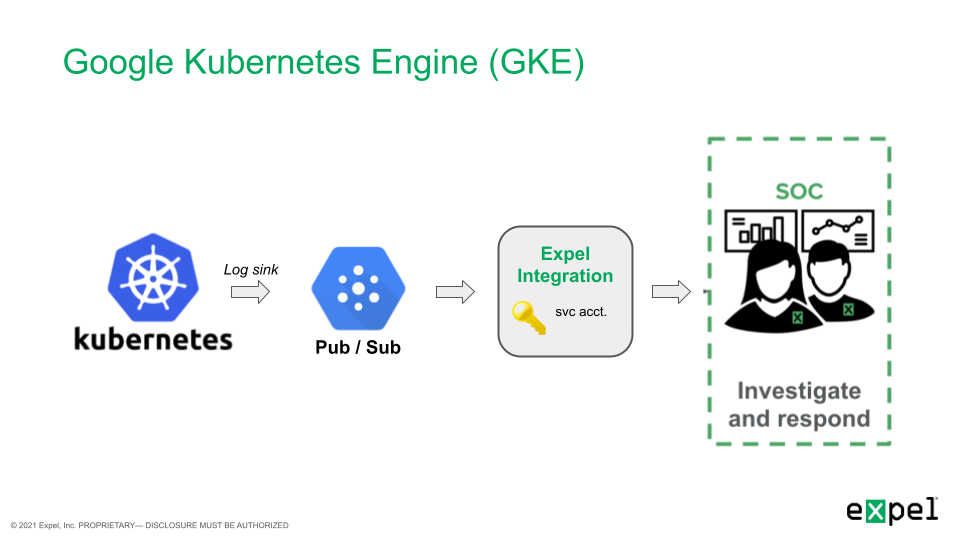
Google Kubernetes Engine (GKE) setup for Workbench | https://support.expel.io/hc/en-us/articles/11742313688595-Google-Kubernetes-Engine-GKE-setup-for-Workbench | 2022-12-01T15:04:58 | The Expel Google Kubernetes Engine (GKE) offering consumes audit logs from the
GCP platform through a log sink and pub/sub. This visibility allows Workbench
to identify activity of interest in GKE, investigate, and notify organizations
if action is recommended.
#### In this article
* Onboarding with terraform
* Manual onboarding instructions
* Before you start
* Enable control plane logging for GKE clusters
* Enable Cloud Resource Manager API for monitored projects
* Enable data access auditing for GKE
* Send GKE logs to a pub/sub topic
* Step 1: Create a new pub/sub queue
* Step 2: Create a log sink to route logs to pub/sub
* If you are onboarding a specific project
* Create IAM Role for required permissions
* Create GCP service account for Workbench
* Download GCP service account key
* Onboarding to Expel Workbench
## Onboarding with terraform
Expel maintains a terraform module to help organizations easily onboard GKE
with Expel. Contact your engagement manager with any questions about this
onboarding method. Otherwise, follow the manual instructions below.
## Manual onboarding instructions
Complete the steps below for each GCP project to be monitored by Workbench.
## Before you start
To complete this procedure you need:
* Administrative access to the GCP environment.
* User privileges to create a service account, IAM role, log sink, a pub/sub topic, and a pub/sub subscription.
## Enable control plane logging for GKE clusters
At a minimum, Workbench requires logging of the Kubernetes control plane audit
events for each cluster. This provides visibility into activity affecting
resources in the cluster (the “who”, “what”, and “when” we need to detect and
respond). By default, GKE clusters are configured to send Kubernetes audit
events to Cloud Logging, so no additional configuration is required for
clusters.
#### Enable Cloud Resource Manager API for monitored projects
For Expel to discover GKE clusters in the environment, the Cloud Resource
Manager API needs to be enabled in monitored projects. To enable the Cloud
Resource Manager API, navigate to APIs & Services library in the Google Cloud
console.
From the library, select Cloud Resources Manager, and enable this API for all
monitored projects.
## Enable data access auditing for GKE
Google Kubernetes Engine (GKE) separates the Kubernetes control plane logs
into 2 log types in Cloud Logging: Admin Activity and Data Access logs. In
general, write operations (like get, update, or delete) are captured in the
Admin Activity log while read operations (like get or list) are captured in
the optional Data Access logs (see the documentation for more specifics).
Admin Activity logging is enabled by default, but it can be necessary to
enable Data Access logging to increase logging visibility to include read
operations. To do so, go to the IAM > Audit Logs page and search for
_Kubernetes Engine API_.
Select all 3 boxes as below:
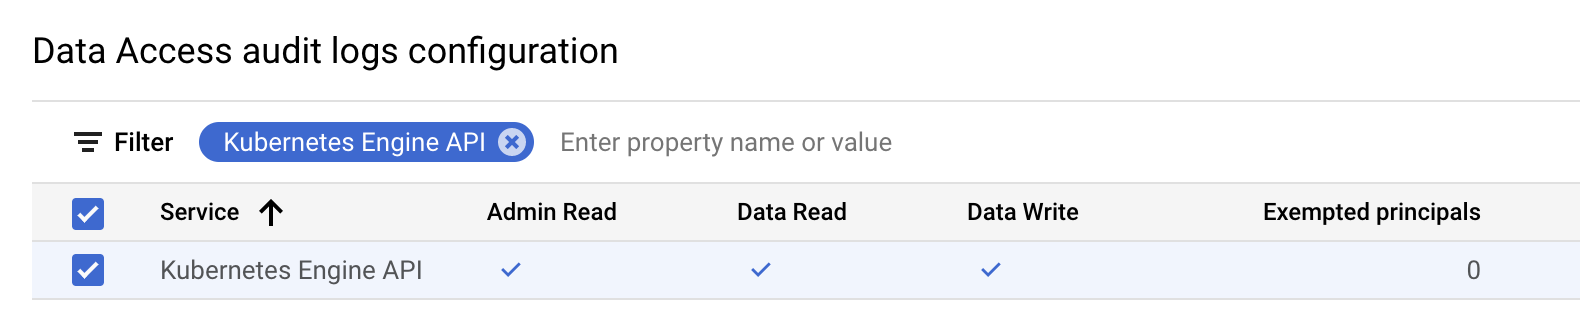
This can be done at a project, folder, or organization level.
### Note
Enabling additional logging can increase costs for Cloud Logging. For more
information on how this is priced, see the documentation.
## Send GKE logs to a pub/sub topic
GKE begins routing Kubernetes logs to Cloud Logging automatically. Next, we
create a pub/sub queue and a log sink to route logs to Workbench.
### Step 1: Create a new pub/sub queue
Workbench collects GKE logs through a pub/sub subscription. Navigate to
Pub/Sub > Topics and create a new topic and default subscription.
### Note
We don't recommend enabling retention duration because of additional cost.
Optionally, configure a Customer-managed encryption key if needed.
### Step 2: Create a log sink to route logs to pub/sub
Next, we need to create a log sink to route logs to the Pub/Sub topic. To
create a sink at the organization level we need to use the gcloud command line
utility.
1. Login to GCP.
`$ gcloud auth login`
2. List the organizations and take note of the org ID.
`$ gcloud organizations list`
3. Create the pub/sub org sink. Use this command to create the sink:
$ gcloud logging sinks create [name of log sink] pubsub.googleapis.com/projects/[project-id]/topics/[topic-id] --include-children --organization=[org-id] --log-filter="(resource.type=gke_cluster OR resource.type=k8s_cluster)\n-proto_payload.method_name=\"io.k8s.core.v1.nodes.proxy.get\"\n-proto_payload.method_name=\"io.k8s.coordination.v1.leases.update\"\n-proto_payload.method_name=\"io.k8s.core.v1.limitranges.update\"\n-proto_payload.method_name=\"io.k8s.autoscaling\""
This automatically creates a new service account which must be granted Pub/Sub
Publisher permissions on the integration’s topic.
4. Grant Pub/Sub Publisher role to log sink’s writer identity.
Obtain the sink's writer identity—an email address—from the new sink. Go to
the Log Router page, and select View sink details. The writer identity appears
in the Sink details panel.
From the console, navigate to PubSub > Topics > [topic-id]. On the Permissions
tab, grant the service account created above the Publisher role.
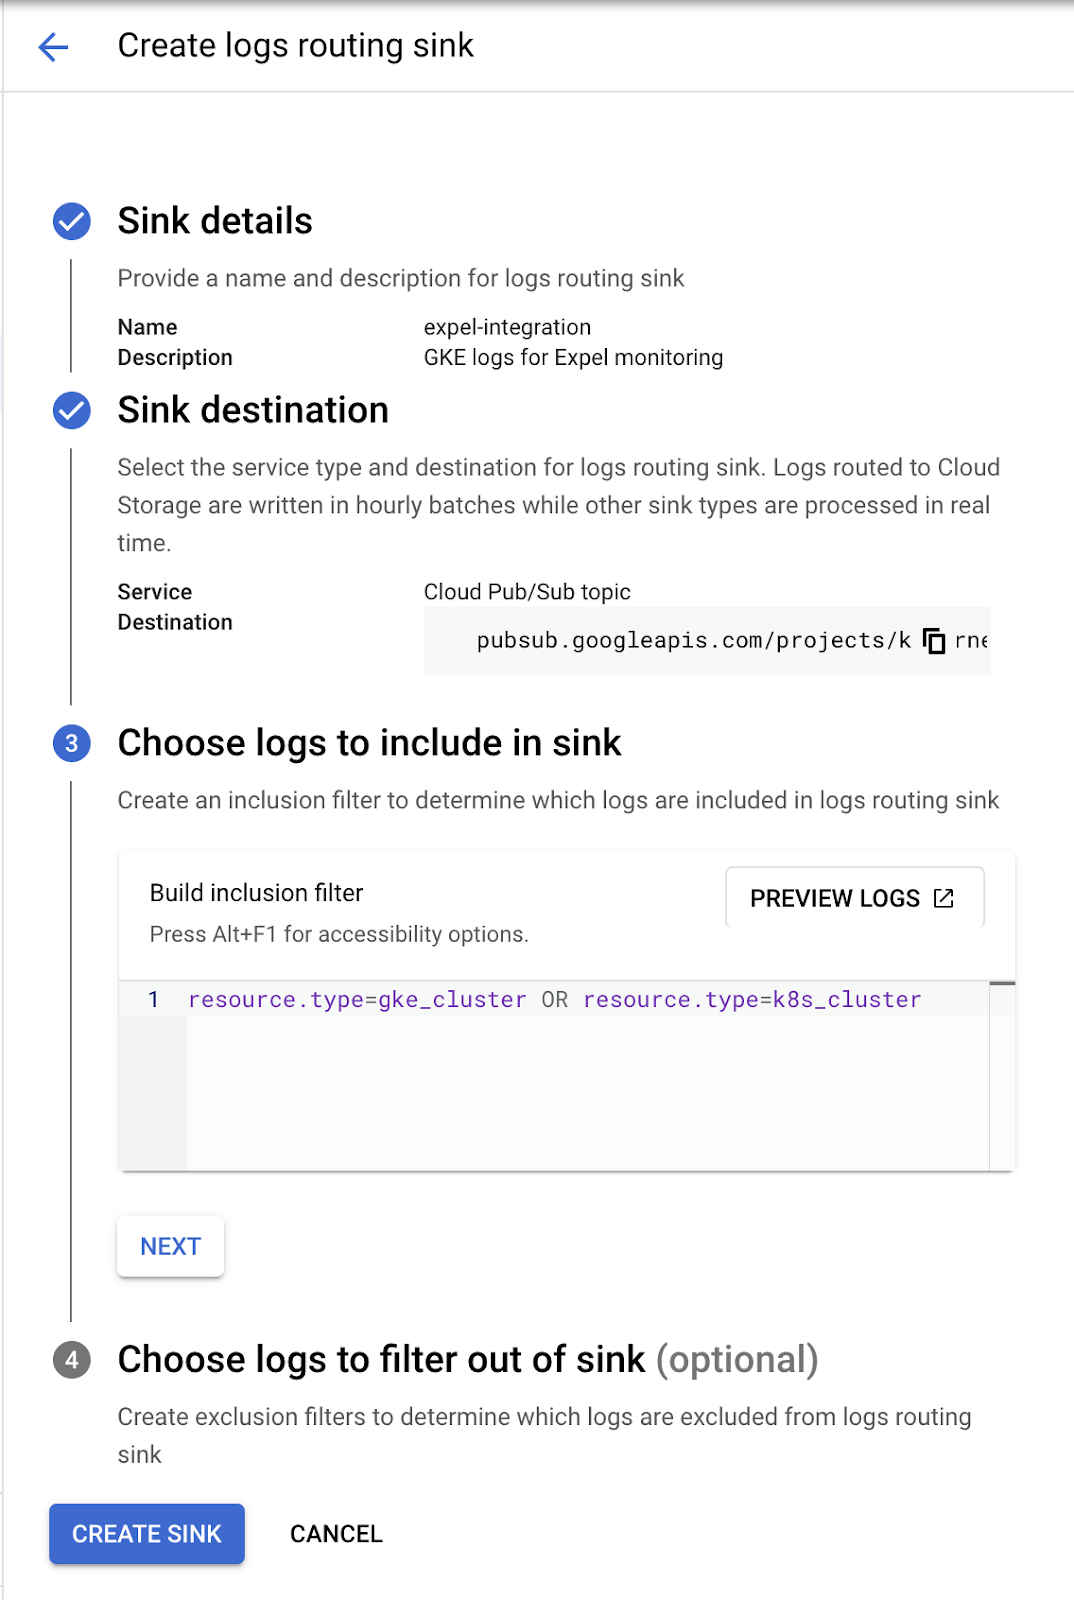
### If you are onboarding a specific project
Next, we need to create a log sink to route logs to the pub/sub topic.
Navigate to Cloud Logging > Logs Router and create a new sink.
Type the following information:
1. A name for the sink.
2. A description for the sink.
3. Select the Cloud Pub/Sub topic we created earlier as the destination.
4. Type the filter below as an inclusion filter.
**Filter**
### Create IAM Role for required permissions
Next, we create a new custom IAM role to capture the required permissions for
Workbench. Navigate to IAM > Roles and create a new role.
Click the ADD PERMISSIONS button and add the below permissions to this role:
* compute.instanceGroupManagers.get
* container.apiServices.get
* container.apiServices.getStatus
* container.apiServices.list
* container.auditSinks.get
* container.auditSinks.list
* container.backendConfigs.get
* container.backendConfigs.list
* container.bindings.get
* container.bindings.list
* container.certificateSigningRequests.get
* container.certificateSigningRequests.getStatus
* container.certificateSigningRequests.list
* container.clusterRoleBindings.get
* container.clusterRoleBindings.list
* container.clusterRoles.get
* container.clusterRoles.list
* container.clusters.get
* container.clusters.list
* container.componentStatuses.get
* container.componentStatuses.list
* container.controllerRevisions.get
* container.controllerRevisions.list
* container.cronJobs.get
* container.cronJobs.getStatus
* container.cronJobs.list
* container.csiDrivers.get
* container.csiDrivers.list
* container.csiNodeInfos.get
* container.csiNodeInfos.list
* container.csiNodes.get
* container.csiNodes.list
* container.customResourceDefinitions.get
* container.customResourceDefinitions.getStatus
* container.customResourceDefinitions.list
* container.daemonSets.get
* container.daemonSets.getStatus
* container.daemonSets.list
* container.deployments.get
* container.deployments.getScale
* container.deployments.getStatus
* container.deployments.list
* container.endpointSlices.get
* container.endpointSlices.list
* container.endpoints.get
* container.endpoints.list
* container.events.get
* container.events.list
* container.frontendConfigs.get
* container.frontendConfigs.list
* container.horizontalPodAutoscalers.get
* container.horizontalPodAutoscalers.getStatus
* container.horizontalPodAutoscalers.list
* container.ingresses.get
* container.ingresses.getStatus
* container.ingresses.list
* container.initializerConfigurations.get
* container.initializerConfigurations.list
* container.jobs.get
* container.jobs.getStatus
* container.jobs.list
* container.mutatingWebhookConfigurations.get
* container.mutatingWebhookConfigurations.list
* container.namespaces.get
* container.namespaces.getStatus
* container.namespaces.list
* container.networkPolicies.get
* container.networkPolicies.list
* container.nodes.get
* container.nodes.getStatus
* container.nodes.list
* container.operations.get
* container.operations.list
* container.persistentVolumeClaims.get
* container.persistentVolumeClaims.getStatus
* container.persistentVolumeClaims.list
* container.persistentVolumes.get
* container.persistentVolumes.getStatus
* container.persistentVolumes.list
* container.petSets.get
* container.petSets.list
* container.podDisruptionBudgets.get
* container.podDisruptionBudgets.getStatus
* container.podDisruptionBudgets.list
* container.podPresets.get
* container.podPresets.list
* container.podSecurityPolicies.get
* container.podSecurityPolicies.list
* container.podTemplates.get
* container.podTemplates.list
* container.pods.get
* container.pods.getStatus
* container.pods.list
* container.priorityClasses.get
* container.priorityClasses.list
* container.replicaSets.get
* container.replicaSets.getScale
* container.replicaSets.getStatus
* container.replicaSets.list
* container.replicationControllers.get
* container.replicationControllers.getScale
* container.replicationControllers.getStatus
* container.replicationControllers.list
* container.resourceQuotas.get
* container.resourceQuotas.getStatus
* container.resourceQuotas.list
* container.roleBindings.get
* container.roleBindings.list
* container.roles.get
* container.roles.list
* container.runtimeClasses.get
* container.runtimeClasses.list
* container.scheduledJobs.get
* container.scheduledJobs.list
* container.serviceAccounts.get
* container.serviceAccounts.list
* container.services.get
* container.services.getStatus
* container.services.list
* container.statefulSets.get
* container.statefulSets.getScale
* container.statefulSets.getStatus
* container.statefulSets.list
* container.storageClasses.get
* container.storageClasses.list
* container.storageStates.get
* container.storageStates.getStatus
* container.storageStates.list
* container.storageVersionMigrations.get
* container.storageVersionMigrations.getStatus
* container.storageVersionMigrations.list
* container.thirdPartyObjects.get
* container.thirdPartyObjects.list
* container.thirdPartyResources.get
* container.thirdPartyResources.list
* container.tokenReviews.create
* container.updateInfos.get
* container.updateInfos.list
* container.validatingWebhookConfigurations.get
* container.validatingWebhookConfigurations.list
* container.volumeAttachments.get
* container.volumeAttachments.getStatus
* container.volumeAttachments.list
* container.volumeSnapshotClasses.get
* container.volumeSnapshotClasses.list
* container.volumeSnapshotContents.get
* container.volumeSnapshotContents.getStatus
* container.volumeSnapshotContents.list
* container.volumeSnapshots.get
* container.volumeSnapshots.list
### Create GCP service account for Workbench
Next, we create a service account for Workbench to collect GKE logs and
monitor GKE clusters. Navigate to IAM > Service Accounts and create a new
service account.
Under service account details, type a Name, ID and Description and click
Create and Continue.
Next, add 3 roles to the service account:
1. The “Browser” role. This allows Workbench to discover GKE clusters in the environment.
2. The custom Workbench role we created earlier.
3. The “Pub/Sub” subscriber role.
### Note
We recommend adding a condition to limit this role to the pub/resource created
earlier.
Finally, for the last section, leave the blank defaults and click Done.
### Download GCP service account key
Workbench requires a service account key to authenticate to your GCP
environment. To generate a key, navigate to IAM > Service Accounts. Locate the
service account you created earlier for Workbench, and select Manage Keys from
the Actions menu for that account.
Create a new key, and download the key in the default JSON format. We use this
key later in Workbench to onboard the GKE integration.
### Onboarding to Expel Workbench
The steps below outline how to finish onboarding in Workbench.
1. Log in to Workbench at https://workbench.expel.io.
2. Navigate to Settings > Security devices.
3. Click \+ Add security device.
4. Select Google Kubernetes Engine.
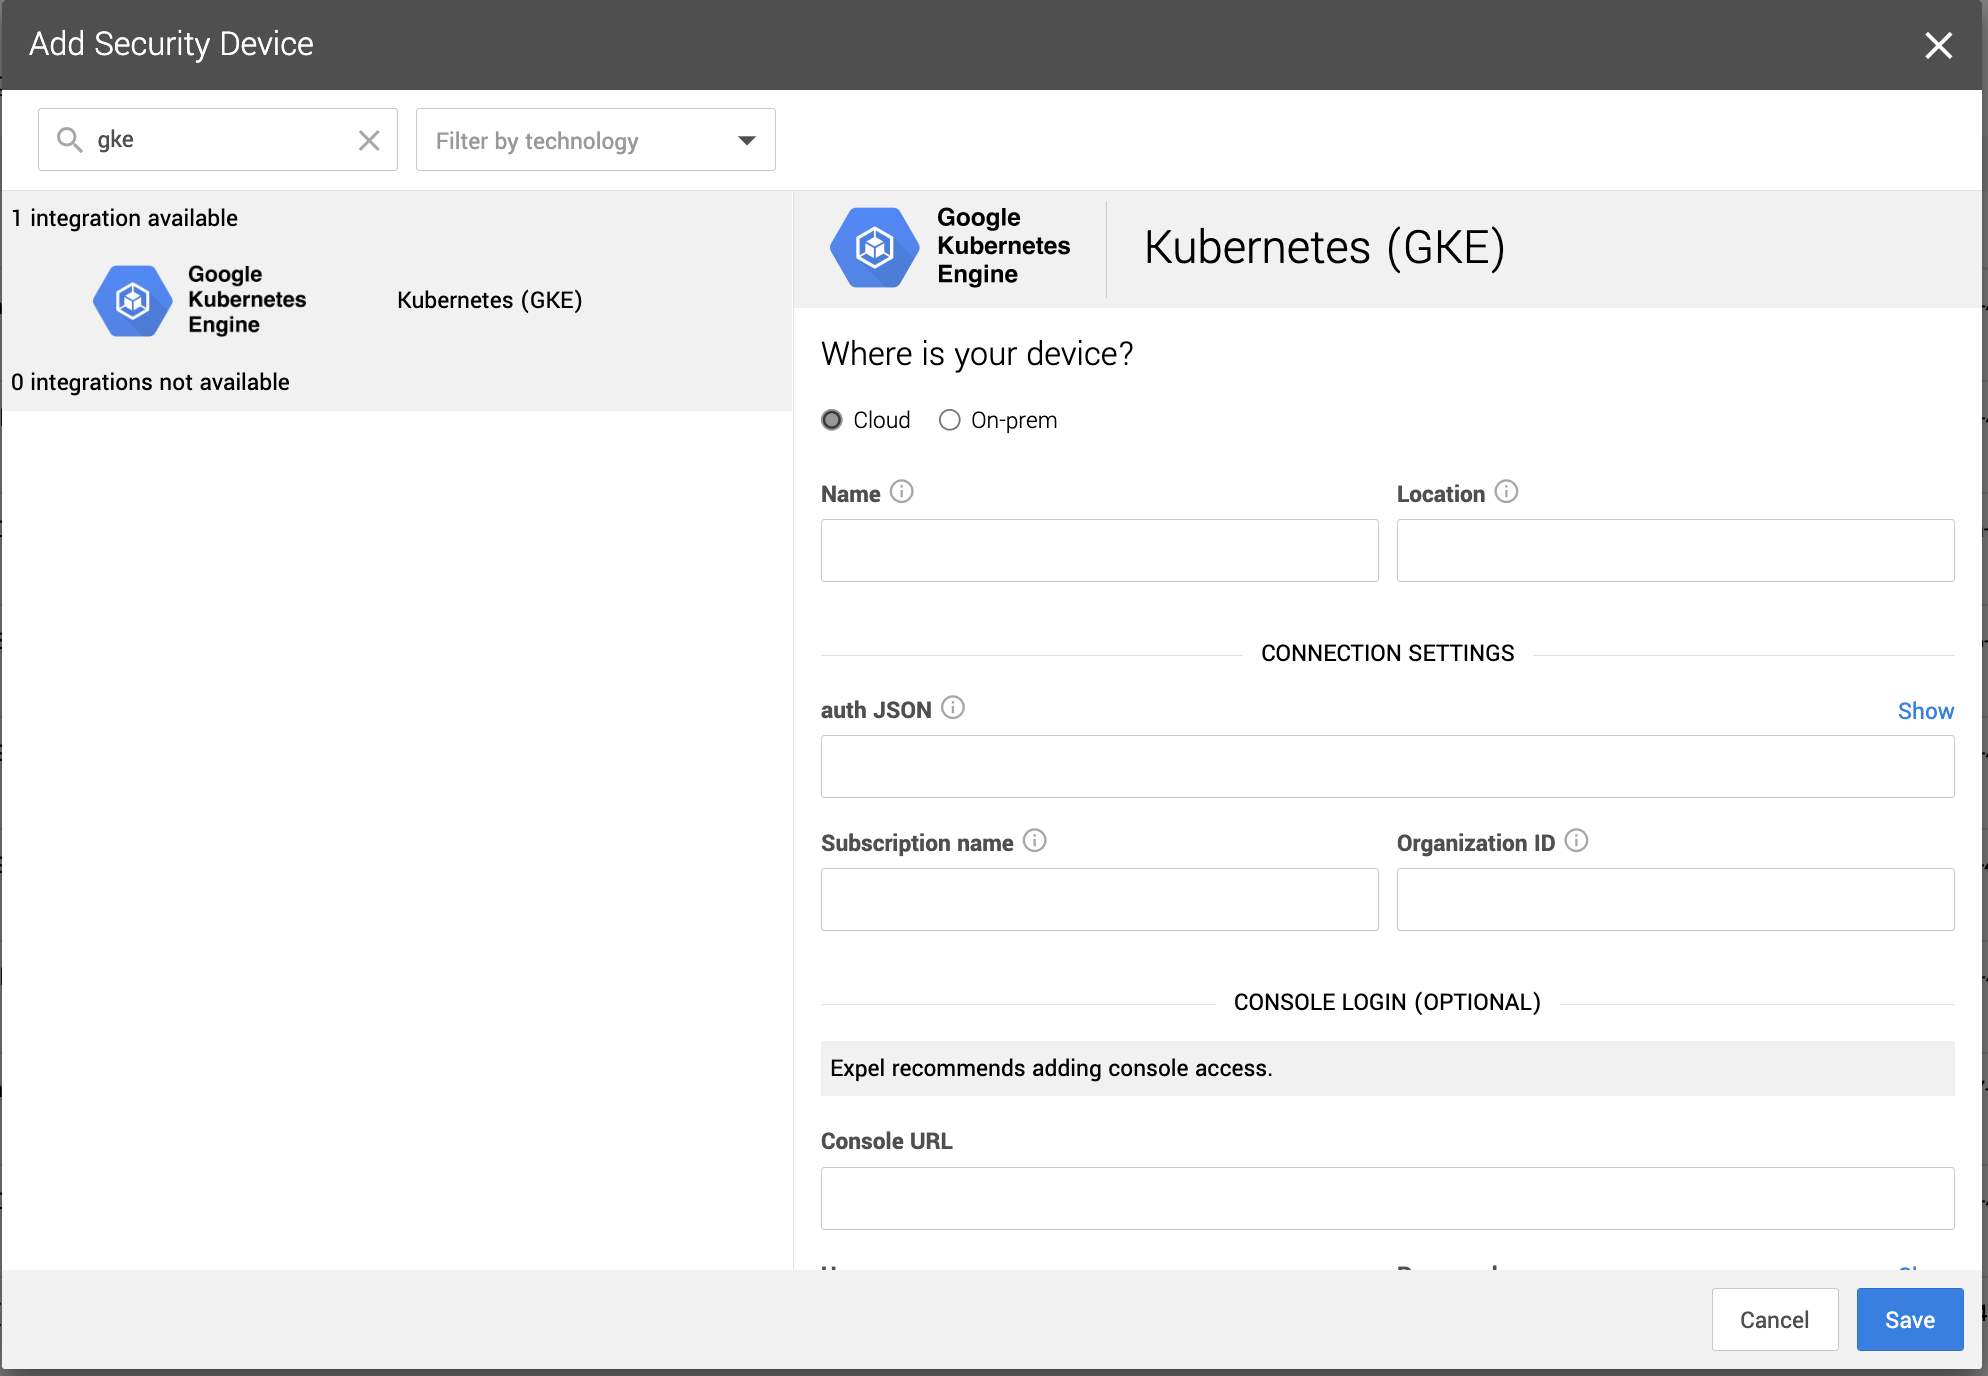
5. Name the device, provide a description, and fill in the Service Account auth JSON, and the pubsub subscription name.
6. Click Save.
### Tip
This article was accurate at the time of writing, but changes happen. If you
find the instructions are outdated, leave a description in the comment field
below and let us know!
|
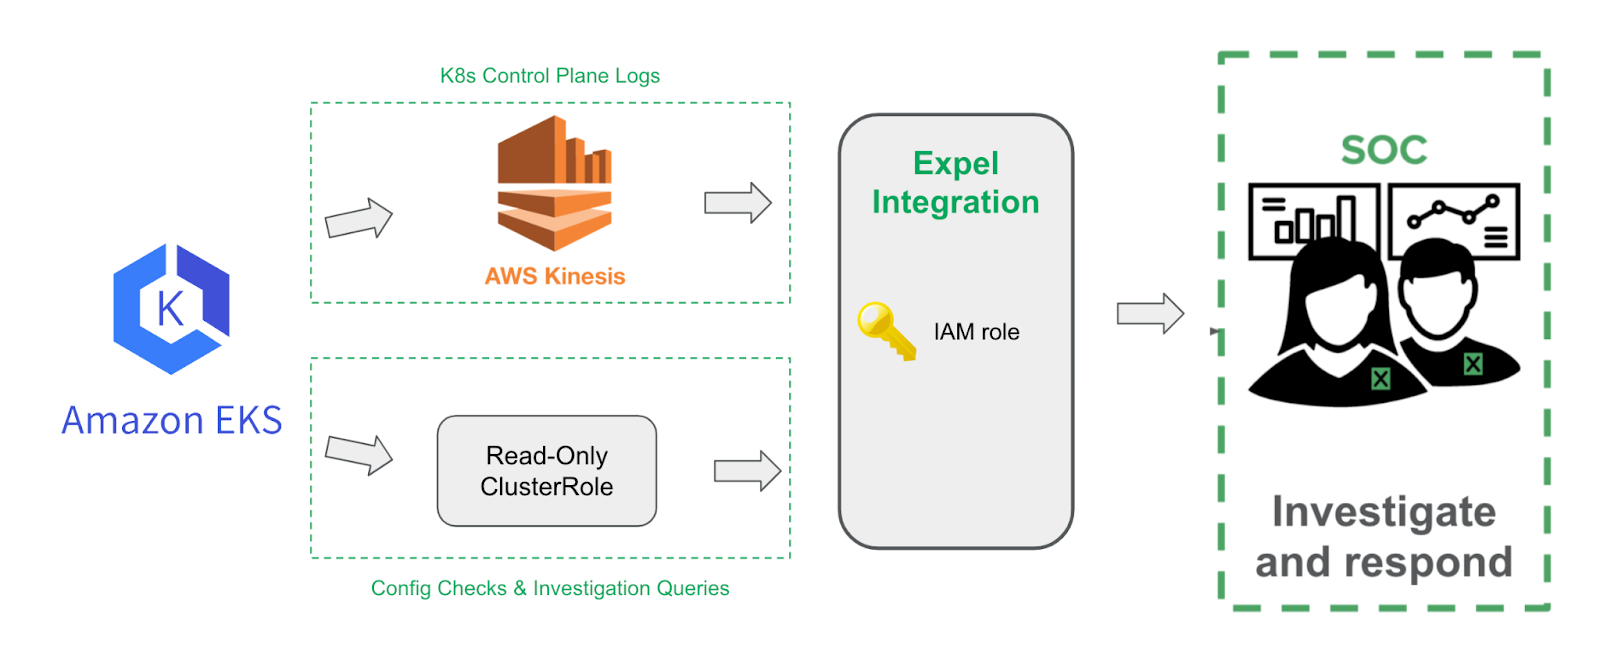
Amazon Elastic Kubernetes Service (EKS) setup for Workbench | https://support.expel.io/hc/en-us/articles/11742327047827-Amazon-Elastic-Kubernetes-Service-EKS-setup-for-Workbench | 2022-12-01T15:04:57 | The Expel Amazon Elastic Kubernetes Service (EKS) consumes audit logs from the
AWS platform through Kinesis. This visibility allows Workbench to identify
activity of interest in EKS, investigate, and notify organizations if action
is recommended.
Complete the steps below for each EKS cluster in each AWS account to be
monitored by Workbench.
#### In this article
* Before you start
* Enable control plane logging for each EKS cluster
* Send EKS logs to a Kinesis stream
* Step 1: Create a new Kinesis data stream
* Step 2: Create an IAM role for CloudWatch log delivery
* Step 3: Route logs from CloudWatch to Kinesis stream
* Create IAM Role for Workbench
* Grant Workbench IAM Role required permissions
* Grant Workbench read-only cluster permissions
* Step 4: Connecting to Workbench
* Put these IP addresses in your allow list
## Before you start
To complete this procedure you need:
* Administrative access to Amazon Web Services (AWS).
* User privileges to create a Kinesis stream, CloudWatch log subscription, IAM role, and IAM policy.
## Enable control plane logging for each EKS cluster
At a minimum, Workbench requires logging of the **audit** events for each
cluster. This provides visibility into activity affecting resources in the
cluster (the “who, what, and when” we need to detect and respond to).
Update logging configuration with the AWS CLI like this:
aws eks update-cluster-config \
_--region_ **_< your-cluster-region>_** \
_--name_ **_< your-cluster-name>_** _\_
_--logging '{"clusterLogging":[{"types":["audit"],"enabled":true}]}'_
For more information on configuring control plane logging, see the Amazon
reference guide.
## Send EKS logs to a Kinesis stream
After control plane logging is enabled, EKS begins sending logs to CloudWatch.
Next, the logs must be routed from CloudWatch to a Kinesis data stream so that
Workbench can consume the logs in real time. Complete the steps below to route
EKS logs to a Kinesis data stream.
## Step 1: Create a new Kinesis data stream
Create a stream with the AWS CLI like this:
_aws kinesis create-stream \_
_--region_ **_< your-cluster-region>_** _\_
_--stream-name_ **_< your-stream-name>_** _\_
_--stream-mode-details '{"StreamMode": "ON_DEMAND"}'_
We recommend creating an `“ON_DEMAND”` stream to allow the stream to adjust
capacity based on demand.
## Step 2: Create an IAM role for CloudWatch log delivery
An IAM role is required to allow CloudWatch to deliver logs to your Kinesis
stream.
To start, create a trust policy document that allows the CloudWatch service to
assume the role:
_{_
_"Statement": {_
_"Effect": "Allow",_
_"Principal": { "Service": "logs._ **_< your-region>_** _.amazonaws.com" },_
_"Action": "sts:AssumeRole",_
_"Condition": {_
_"StringLike": { "aws:SourceArn": "arn:aws:logs:_ **_< your-region>_** _:_ **_< your-account-id>_** _:*" }_
_}_
_}_
_}_
Then, create the IAM role supplying this trust document:
_aws iam create-role \_
_--role-name_ **_< your-cloudwatch-role-name>_**
_--assume-role-policy-document file://_ **_< your-trust-document-file-path>_**
Next, create an IAM policy document that grants this role permissions to put
records into your Kinesis stream:
_{_
_"Statement": [_
_{_
_"Effect": "Allow",_
_"Action": "kinesis:PutRecord",_
_"Resource": "_ **_< your-kinesis-arn>_** _"_
_}_
_]_
_}_
Finally, apply this IAM policy to the CloudWatch role:
aws iam put-role-policy \
--role-name **< your-cloudwatch-role-name>** \
--policy-name “ **< your-policy-name>**” \
--policy-document file:// **< your-policy-document-path>**
## Step 3: Route logs from CloudWatch to Kinesis stream
Logs can be routed to Kinesis with a CloudWatch log group subscription filter.
Create this filter with the AWS CLI like this:
aws logs put-subscription-filter \
_--region_ **_< your-cluster-region>_** _\_
_–log-group-name_ **_< your-cluster-log-group-name>_** _\_
–filter-name “AllEKSLogs” \
–filter-pattern “”
_–destination-arn_ **_< your-kinesis-stream-arn>_**
_--role-arn_ **_< your-cloudwatch-role>_**
### Create IAM Role for Workbench
To authenticate to your AWS account and retrieve logs, Workbench requires an
IAM role. If you already have an Workbench IAM role for another Workbench
integration (like CloudWatch or AWS GuardDuty), this existing role can be
reused and you can go to: **Grant Expel IAM Role required permissions**.
To start, create a trust policy document that allows Workbench to assume the
role:
_{_
_"Statement":_
_[_
_{_
_"Effect": "Allow",_
_"Principal":_
_{_
_"AWS": "arn:aws:iam::012205512454:user/ExpelCloudService"_
_},_
_"Action": "sts:AssumeRole",_
_"Condition":_
_{_
_"StringEquals":_
_{_
_"sts:ExternalId": "_ **_< your-customer-guid>_** _"_
_}_
_}_
_}_
_]_
_}_
Then, create the IAM role supplying this trust document:
_aws iam create-role \_
_--role-name_ **_< your-expel-role-name>_**
_--assume-role-policy-document file://_ **_< your-trust-document-file-path>_**
### Grant Workbench IAM Role required permissions
Workbench requires IAM permissions to retrieve logs from Kinesis, as well as
investigate activity of interest affecting your EKS clusters.
First, create an IAM policy document granting Workbench required permissions
for Kinesis and EKS:
_{_
_"Version": "2012-10-17",_
_"Statement": [_
_{_
_"Effect": "Allow",_
_"Action": [_
_"kinesis:DescribeLimits",_
_"kinesis:DescribeStream",_
_"kinesis:DescribeStreamSummary",_
_"kinesis:GetRecords",_
_"kinesis:GetShardIterator",_
_"kinesis:ListShards"_
_],_
_"Resource": "_ **_< your kinesis stream arn>_** _"_
_},_
_{_
_"Effect": "Allow",_
_"Action": [_
_"eks:AccessKubernetesApi",_
_"eks:DescribeCluster",_
_"eks:DescribeNodegroup",_
_"eks:ListClusters",_
_"eks:ListNodegroups",_
_"eks:ListUpdates",_
_"sts:GetCallerIdentity",_
_"ec2:DescribeRegions",_
_"autoscaling:DescribeAutoScalingGroups"_
],
_"Resource": "*"_
_}_
_]_
_}_
Then, apply this policy to the Expel IAM role:
aws iam put-role-policy \
--role-name **< your-expel-role-name>** \
--policy-name “ **< your-policy-name>**” \
--policy-document file:// **< your-policy-document-path>**
### Grant Workbench read-only cluster permissions
Expel suggests providing limited read-only access to your EKS clusters to
enable deep investigation of interesting activity. These permissions can be
fine-tuned based on your needs. Workbench can deliver service without this
access, but it significantly limits our ability to thoroughly investigate
activity in your clusters.
First, create an Expel ClusterRole manifest to grant limited, read-only
permissions:
_apiVersion: rbac.authorization.k8s.io/v1_
_kind: ClusterRole_
_metadata:_
_name: expel-reader-clusterrole_
_rules:_
_- apiGroups:_
_- ""_
_- admissionregistration.k8s.io_
_- apps_
_- networking.k8s.io_
_- rbac.authorization.k8s.io_
_resources:_
_- apiservices_
_- clusterrolebindings_
_- clusterroles_
_- cronjobs_
_- daemonsets_
_- deployments_
_- events_
_- flowschemas_
_- horizontalpodautoscalers_
_- ingressclasses_
_- ingresses_
_- jobs_
_- localsubjectaccessreviews_
_- mutatingwebhookconfigurations_
_- namespaces_
_- networkpolicies_
_- nodes_
_- persistentvolumes_
_- poddisruptionbudgets_
_- pods_
_- podsecuritypolicies_
_- podtemplates_
_- replicasets_
_- rolebindings_
_- roles_
_- selfsubjectaccessreviews_
_- selfsubjectrulesreviews_
_- serviceaccounts_
_- services_
_- statefulsets_
_- subjectaccessreviews_
_- tokenreviews_
_- validatingwebhookconfigurations_
_- volumeattachments_
_verbs:_
_- get_
_- list_
Use kubectl to apply this role:
= _kubectl apply -f_ **_< your-expel-role-manifest>_**
Next, bind this role to a Workbench user with a ClusterRoleBinding. Create a
ClusterRoleBinding manifest:
_kind: ClusterRoleBinding_
_apiVersion: rbac.authorization.k8s.io/v1_
_metadata:_
_name: expel-reader-clusterrolebinding_
_subjects:_
_- kind: User_
_name: expel-user_
_roleRef:_
_kind: ClusterRole_
_name: expel-reader-clusterrole_
_apiGroup: rbac.authorization.k8s.io_
Use kubectl to apply this role:
_kubectl apply -f_ **_< your-expel-role-binding-manifest>_**
Finally, map the Workbench IAM role to the in-cluster user “expel-user”. This
requires editing the “aws-auth” configMap with **EKS ctl**.
_eksctl create iamidentitymapping \_
_--cluster_ **_< your-cluster-name>_** _\_
_--region_ **_< your-region>_** _\_
_--arn_ **_< your-expel-role-arn>_** _\_
_--username expel-user_
You can confirm the mapping is created by running:
_eksctl get iamidentitymapping --cluster_ **_< your-cluster-name>_** _--region_ **_< your-region>_**
## Step 4: Connecting to Workbench
The steps below outline how to finish connecting to Workbench.
1. Log in to Workbench at https://workbench.expel.io.
2. Navigate to Settings > Security devices.
3. Click +Add security device.
4. Select Amazon Elastic Kubernetes Service (EKS).
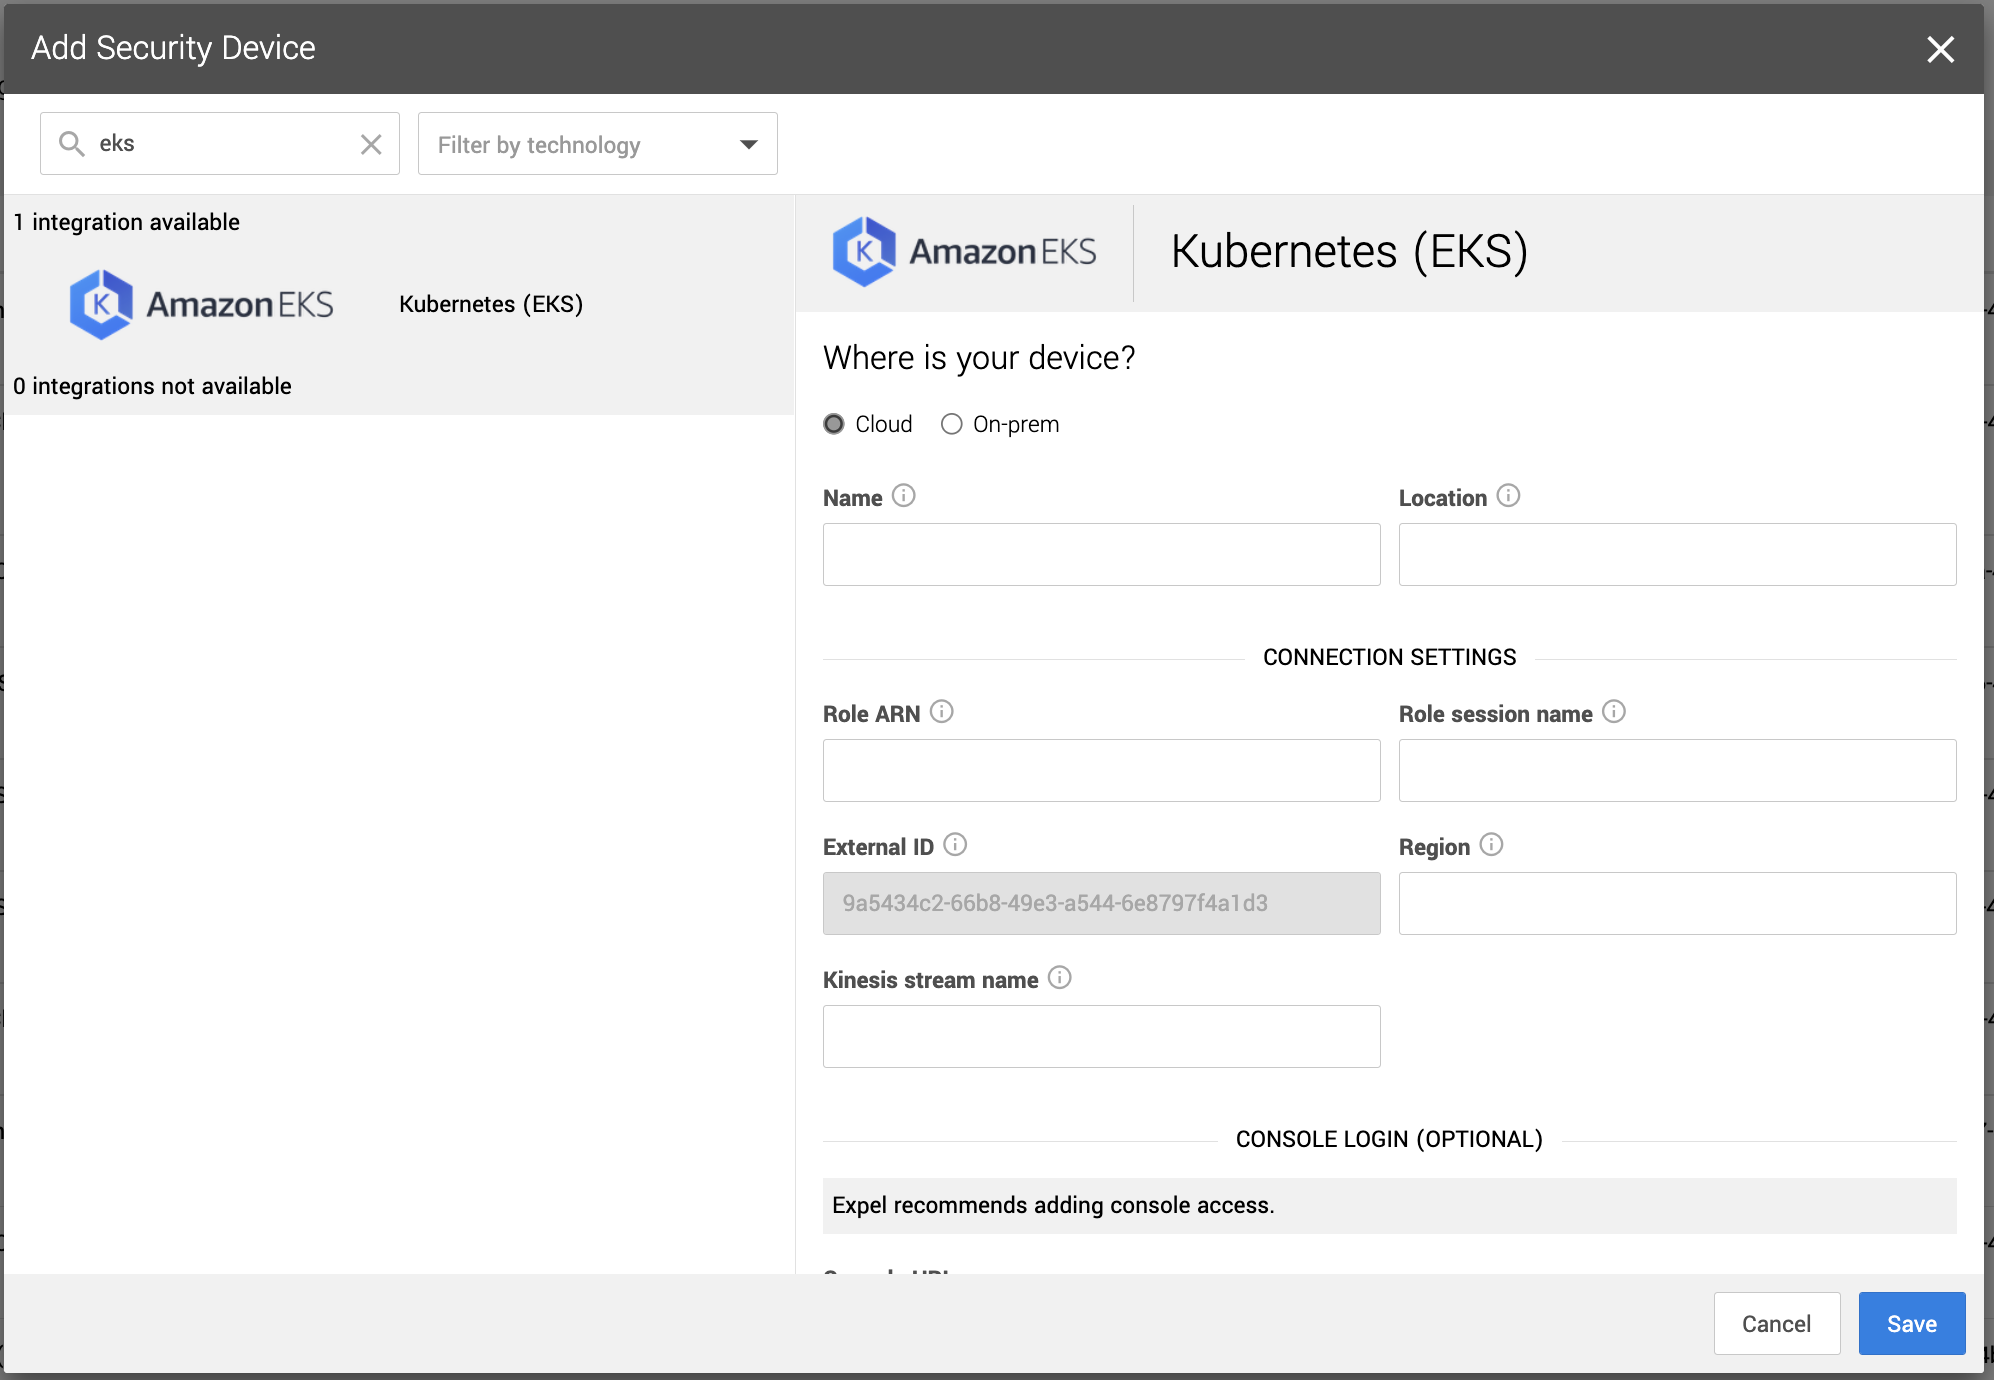
5. Name the device, provide a description, and fill in the Role ARN, Role Session Name, Region, External ID, and Kinesis Stream Name.
6. Click Save.
## Put these IP addresses in your allow list
* 34.75.13.114
* 34.75.152.7
* 35.243.190.98
* 104.196.158.205
* 34.75.81.28
* 34.75.210.18
### Tip
This article was accurate at the time of writing, but changes happen. If you
find the instructions are outdated, leave a description in the comment field
below and let us know!
|
AWS CloudTrail setup for Workbench | https://support.expel.io/hc/en-us/articles/12116548434067-AWS-CloudTrail-setup-for-Workbench | 2022-12-13T18:50:35 | This article contains links to all the ways you can connect your new or
existing AWS CloudTrail to the Expel Workbench.
#### In this article
* Onboarding a new CloudTrail
* Onboarding an existing AWS CloudTrail
## Onboarding a new CloudTrail
You can onboard new CloudTrails in 1 of 2 ways:
* Use our AWS onboarding wizard.
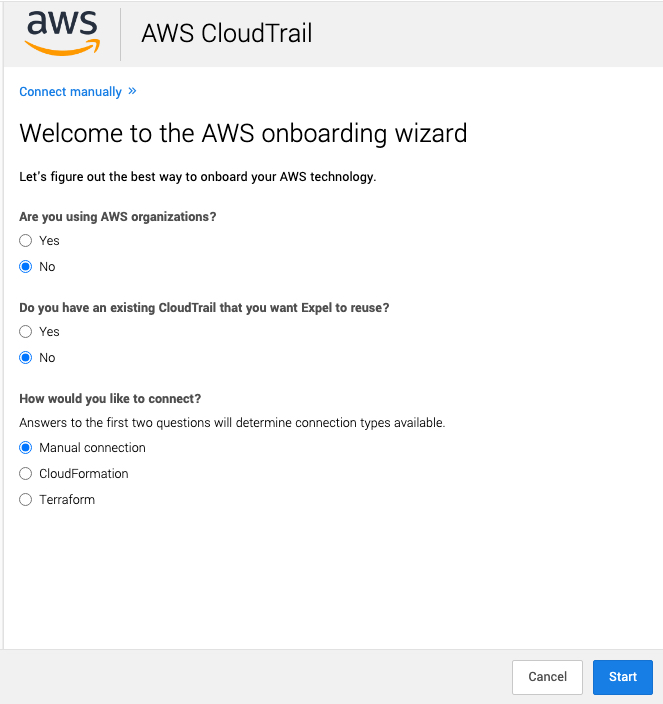
* Connect manually.
If you want Expel to create new CloudTrails on your behalf, use our AWS
Onboarding Wizard in Workbench.
### Note
Creating duplicate CloudTrails can result in additional AWS costs. Do not use
the wizard if you want to connect an existing CloudTrail.
Our wizard supports creating new CloudTrails using:
* CloudFormation Templates: You can use AWS CloudFormation templates to perform the necessary configuration for an individual account or organization. If you’re onboarding an AWS organization, it creates a CloudFormation StackSet to configure the permissions on each account within the organization. It can even automatically run on accounts you create in the future under the organization. Don’t worry, we won’t run anything in your AWS account. We instead populate CloudFormation with the right steps; you review it and decide to execute.
* Terraform: We present an open source, fully transparent Terraform module which creates necessary AWS resources used to securely transfer CloudTrail logs to Workbench. All of the resources that we allocate are listed here: https://registry.terraform.io/modules/expel-io/cloudtrail/aws/latest?tab=resources. By default, all methods of communication between these resources and AWS and Workbench are secured by encryption. All means of data storage (S3) follow AWS best practices—access logging enabled, bucket versioning enabled, zero public access.
If you're...
|
use this...
---|---
using the wizard, setting up new AWS CloudTrails
|
go to the wizard
using the wizard, setting up new AWS CloudTrails with Terraform
|
go to the wizard and select Terraform
## Onboarding an existing AWS CloudTrail
To onboard an existing CloudTrail, the instructions vary depending upon your
use of AWS Control Tower:
If you're...
|
use this...
---|---
manually setting up new AWS CloudTrails
|
the new AWS CloudTrail steps
connecting an existing CloudTrail
|
the existing installation steps
connecting an existing CloudTrail that includes Control Tower
|
the Control Tower connection steps
Our Product team is developing a process for onboarding an existing CloudTrail
using the AWS wizard. We will update this article when the procedure is ready.
### Tip
This article was accurate at the time of writing, but changes happen. If you
find the instructions are outdated, leave a description in the comment field
below and let us know!
|
AWS CloudTrail: Existing CloudTrail with Control Towersetup for Workbench | https://support.expel.io/hc/en-us/articles/12391858961171-AWS-CloudTrail-Existing-CloudTrail-with-Control-Towersetup-for-Workbench | 2022-12-22T16:21:16 | This article describes how to connect your existing AWS CloudTrail with AWS
Control Tower to the Expel Workbench.
If you're...
|
use...
|
Notes
---|---|---
connecting an existing CloudTrail that includes Control Tower,
|
this article
|
You need the following to integrate a Control Tower environment with
Workbench.
* An AWS Control Tower with Landing Zone.
* Administrator privileges in the AWS Control Tower management and Log Archive accounts.
setting up new AWS CloudTrails
|
the onboarding wizard
|
You can also use the manual connection procedure.
connecting an existing CloudTrail
|
the existing installation steps
|
#### In this article
* About connecting your device
* Before you start
* About console permissions in your devices
* Permissions description and explanation
* Step 1: Setup ExpelIAM role and policy
* Step 2: Update CloudTrail CMK policy if applicable
* Step 3: Confirm S3 log bucket ACL settings
* Step 4: Setup SNS topic for S3 notifications
* Option 1: Using CloudFormation (recommended)
* Option 2: Manual setup
* Step 5: Setup SQS queue for SNS notification
* Step 6: Subscribe SQS to SNS topic
* Step 7: Setup KMS encryption for SNS and SQS
* Step 8: Enable S3 event notifications to SNS topic
* Step 9: Grant ExpelIAM Role necessary access
* Step 10: Complete Workbench setup
## About connecting your device
Connecting your device to Workbench allows Workbench to ingest the logs. AWS
logs include a great deal of information that can take hours to manually
review. And not all AWS alerts need attention.
Expel collects data through direct API integrations with the AWS platform.
Expel supports authentication with an IAM Role (recommended) or IAM User with
a set of read-only permissions. To collect data, Expel communicates directly
with AWS APIs (like AWS GuardDuty and Inspector) and pulls in CloudTrail data
from S3.
Expel processes all product alerts with a library of Expel created rules
focused on the MITRE attack framework. This makes it possible for a product
alert that wouldn't be reviewed to be elevated to an Expel alert.
## Before you start
**This process requires you to download the attachment, found at the end of
this article. The attachment includes the code blocks you need to complete
this process.**
### Note
This article assumes the default service control policies are in play. If you
run into any issues during setup, contact your engagement manager for help.
## About console permissions in your devices
As you connect your devices to Workbench, you provide Workbench access to
those devices through permissions in the devices. These permissions vary from
1 device technology to another, but we typically need at least Read access to
your devices to pull in any logs from those devices into Workbench.
Without minimum permissions to your devices, the SOC analysts are limited in
their insight into your technology. This can mean they surface more benign
alerts to your team for further investigation, resulting in increasing the
workload for your team, and resulting in alert fatigue.
If you grant Read access to your devices, we can investigate the device and
the logs more deeply and surface relevant alerts to you in Workbench. Allowing
Expel visibility into the console of your security devices helps our SOC
analysts make better decisions on whether an alert is benign or malicious. It
also allows our SOC analysts to perform health checks to make sure Workbench
is not missing alerts from your security devices. Depending on what your
organization purchased from Expel, the SOC analysts may even be able to
contain and/or remediate the issues on your behalf.
Ultimately, the more permissions you can grant Workbench, the better and
faster the SOC analysts can find and investigate alerts in your environment.
### Permissions description and explanation
Expel requires these permissions when connecting to AWS CloudTrail. These
permissions are set to **Read** , except as shown below.
**This permission...**
|
**does this...**
|
**Notes**
---|---|---
ec2:DescribeRegions
|
Dynamically list all enabled regions for a customer account
|
ec2:DescribeInstances
|
Cloud investigative actions and inventory
|
Allows SOC analysts to triage issues and get additional content for the
environment.
ec2:DescribeSecurityGroups
iam:List*
iam:Get*
lambda:GetFunction
rds:DescribeDBInstances
rds:ListTagsForResource
eks:DescribeCluster
eks:ListClusters
ecs:ListContainerInstances
ecs:DescribeContainerInstances
ecs:DescribeClusters
ecs:ListClusters
s3:GetBucketNotification
s3:GetEncryptionConfiguration
cloudtrail:GetTrail
cloudtrail:DescribeTrails
cloudtrail:GetTrailStatus
cloudtrail:ListTrails
organizations:ListAccounts
|
Enumerate accounts in an org
|
sqs:DeleteMessage
|
Remove Processed messages from the queue
|
Requires **Write** permission.
sqs:ReceiveMessage
|
Read messages
|
s3:GetObject
|
Download cloudtrail log files
|
ec2:DescribeVolumes
|
Cloud investigative actions and inventory
|
Allows SOC analysts to triage issues and get additional content for the
environment.
ecs:DescribeTaskDefinition
|
Inventory
|
ecs:ListTaskDefinitions
config:ListDiscoveredResources
config:GetDiscoveredResourceCounts
lambda:ListFunctions
|
Cloud investigative actions and inventory
|
Allows SOC analysts to triage issues and get additional content for the
environment.
lightsail:GetInstances
lightsail:GetRegions
s3:ListAllMyBuckets
kms:Decrypt
|
Decrypt S3 buckets
|
organizations:DescribeOrganization
|
Organization information
|
Retrieves information about the organization the user's account belongs to.
## Step 1: Setup ExpelIAM role and policy
In this step we create a permissions policy to assign to the IAM Role.
### Important
For AWS Control Tower the primary Expel role is created within the
organization’s Log Archive account where the CloudTrail S3 Log Bucket exists.
The role and policy must be replicated across all the other accounts in the
organization to allow Expel to perform investigative actions within your AWS
environment. The policy replicated to the other non-Log Archive sub-accounts
can be modified to exclude the policy elements providing access permissions to
the S3 resources if necessary.
1. Create IAM Role and Policy in management account.
* Navigate to the CloudFormation > Stacks service portal.
* Click Create Stack (with new resources) and select Upload a template file as the source.
* Upload a json file containing the stack template. You can find that code in the attachment for this article in the Step 1 area.
* Provide a relevant name to the stack, such as ExpelIAMStack.
* In the WorkbenchExternalID parameter field, type in your Workbench GUID, then click Next.
### Note
You can find this GUID by logging into Workbench and then navigating to
https://workbench.expel.io/settings/organizations. The redirected URL contains
the value to be used for this parameter.

---
* You can leave all defaults for configuring the stack options and click Next.
* Verify the stack details, then check the acknowledgement and click Submit.
* The new IAM role and attached policy should exist for Expel within the management account on completion of the stack.
2. Create IAM Role and Policy in all sub accounts.
* Navigate to the CloudFormation > Stacksets service portal.
* Click Create StackSet and select Upload a template file as the source.
* Follow the same process to fill out the stackset details as was done in deploying the stack above (Step 1.1).
## Step 2: Update CloudTrail CMK policy if applicable
### Note
You can skip this step if your CloudTrail is not configured to encrypt the S3
logs using CMK. Otherwise, we need to update the key policy to provide
Workbench with the kms:Decrypt permission so that we can properly get objects
from the S3 bucket containing the CloudTrail logs.
You can determine if this step applies to you by navigating to Services >
CloudTrail > Trails and then selecting the trail created by Control Tower in
your management account. In the General details section you see a value under
Log file SSE-KMS encryption and an associated AWS KMS key populated as well.
1. Navigate to the CMK key used to encrypt the CloudTrail logs.
* You can find the specific key arn by looking for AWS KMS Key in the General details section of the CloudTrail.
2. Select the Key policy tab and then click Edit to change it.
3. Add the decrypt permission to the existing list of policy statements. You can find that code in the attachment for this article in the Step 2 area.
### Note
Make sure to update the principal value with the correct arn path to the Expel
Role created in the Log Archive account as a result of Step 1.2 via the
StackSet.
4. Click Save changes.
### Important
The following steps (Steps 3 - 8) must be performed from within your AWS
Control Tower Log Archive account. See the AWSdocumentation for any
clarification on what that is.
## Step 3: Confirm S3 log bucket ACL settings
### Note
Amazon S3 access control lists allow you to manage access to buckets and any
objects contained within. We want to confirm that the S3 bucket created in
your log archive account allows the bucket owner (Log Archive) and Expel by
extension through the deployed role read permissions for the objects within.
1. Navigate to Services > S3 > Buckets > [Your S3 Log Bucket] (usually follows the naming scheme “aws-controltower-logs-”.
2. Select the Permissions tab, then look at the Object Ownership section to confirm the current ACL setting.
3. If you keep ACLs enabled on the bucket then confirm the current Object Ownership is set to Bucket owner preferred.
### Important
AWS recommends that you disable ACLs on S3 for a majority of modern use-cases
which then delegate ownership to the bucket owner account (source).
## Step 4: Setup SNS topic for S3 notifications
### Option 1: Using CloudFormation (recommended)
### Important
If you choose this option, then you can skip to Step 8 when you’re done.
1. Navigate to Services > CloudFormation > Stacks and click Create stack (with new resources).
2. In the Specify template section select Upload a template file. Then upload a json file containing the stack template. Then click Next. You can find that code in the attachment for this article in the Step 4, Option 1 area.
3. Fill in a name for the stack.
4. Fill in the following required parameters.
* S3LogBucketARN: the ARN associated with the S3 Bucket in your Log Archive account that retains the CloudTrail logs.
* CloudTrailKeyARN: the ARN for the customer-managed kms key configured on your CloudTrail (in your management account).
5. Proceed through the rest of the wizard keeping the defaults, then click Submit to initiate the stack.
6. After the stack creation completes, make note of all values returned in the Outputs tab of the stack console. You need these returned values to complete setup in Workbench.
* RoleARN: the IAM Role created in the log archive account needed to complete setup in Workbench.
* SqsURL: the SQS url path needed to complete setup of in Workbench.
### Important
You can now skip directly to Step 8.
#### Option 2: Manual setup
### Caution
Make sure to create the SNS topic in the same region as the S3 bucket
CloudTrail events are being sent to!
1. Navigate to Services > Simple Notification Service > Topics and click Create Topic.
2. On the next screen, select Standard as the Type and create a Topic Name.
3. Under Access Policy, select Advanced.
In the JSON editor, paste the below policy substituting the YOUR_TOPIC_ARN and
YOUR_S3_ARN fields with your values. This policy allows S3 to publish
notifications to the topic for your CloudTrail bucket. You can find that code
in the attachment for this article in the Step 4, Option 2 area.
4. Click Create Topic.
## Step 5: Setup SQS queue for SNS notification
In this step, we create a new SQS queue for S3 notifications. Workbench polls
notifications from this queue to know when new CloudTrail data is added.
### Caution
Make sure you create the SQS queue in the same region as the SNS topic and S3
bucket!
1. Navigate to Services > Simple Queue Service > Queues and click Create queue.
2. On the next screen, select Standard Queue and name the new queue.
* Visibility timeout: 30 Seconds.
* Message retention period: 7 days.
* Delivery delay: 0 Seconds.
* Maximum message size: 256 KB.
* Receive message wait time: 0 Seconds.
3. Under Access Policy, select Advanced.
4. In the JSON editor, paste the policy substituting the YOUR_SQS_QUEUE_ARN and YOUR_SNS_TOPIC_ARN fields with your values. You can find that code in the attachment for this article in the Step 5 area.
## Step 6: Subscribe SQS to SNS topic
Now that we created an SNS topic and SQS queue, we need to configure SNS to
send events to the SQS queue.
1. Navigate to Services > Simple Notification Service > Subscriptions and click Create subscription.
2. On the next screen, configure the required fields to complete the subscription.
Field
|
Value
---|---
Topic ARN
|
Your SNS Topic ARN
Protocol
|
Select Amazon SQS
Endpoint
|
Your SNS Queue ARN
Enable raw message delivery
|
### Important
Selecting enable raw message delivery makes sure SNS doesn’t add extra
metadata headers to the message when it sends to SQS. Make sure you select
this!
3. Click Create subscription to finish this step.
## Step 7: Setup KMS encryption for SNS and SQS
1. Navigate to Services > Key Management Service (KMS) > Customer managed keys and click Create Key.
2. Retain the default configuration values as shown below, then click Next.
3. Fill in values for the alias and description for the key, then click Next.
4. Select any additional key administrators for the new key, then click Next until you get to the Review page.
5. Look for the Key policy generated for this key in the Review page and add the policies to the statement list to give S3 & SNS the right perms they need to decrypt with this key. You can find that code in the attachment for this article in the Step 7 area.
6. Click Finish to complete the creation of the new key.
7. Enable Encryption on the SNS topic you created in Step 3 using the new key.
* Navigate to Services > Simple Notification Service > Topics > YourTopic.
* Click Edit, then click Encryption on.
* In the Customer master key (CMK) selection, click the KMS key you created above.
* Click Save changes.
8. Enable Encryption on the SQS topic you created in Step 4 using the new key.
* Navigate to Services > Simple Queue Service > Queues > YourQueue.
* Click Edit, then toggle the Encryption option on.
* Set the Server-side encryption option to Enabled.
* Set the Encryption key type to SSE-KMS.
* In the Customer master key selection, click the KMS key you created above.
* Click Save.
## Step 8: Enable S3 event notifications to SNS topic
In this step, we configure the CloudTrail S3 bucket to send SNS notifications
when CloudTrail adds logs to the bucket.
1. Navigate to Services > S3 > Your S3 CloudTrail Bucket.
2. Open Properties for your S3 bucket and navigate to Event notifications. Click Create event notification.
3. On the next screen:
* Create a name for your notification rule.
* Select All object create events from the Event types section.
* Select SNS topic from the Destination section.
* Select your SNS topic created in Step 3.
4. Click Save changes.
## Step 9: Grant ExpelIAM Role necessary access
### Tip
Skip this step if you onboarded the Expel resources with CloudFormation using
Step 4, Option 1. You can go to Step 10.
At this point we configured S3 notifications → SNS topic → SQS queue. The
final step involves granting the existing ExpelIAM Role the necessary access
to poll events from the SQS queue and the S3 bucket.
1. Navigate to Services > IAM > Roles.
2. Create and add a new inline policy to the Expel Role that was propagated to the Log Archive account as part of Step 1.
### Tip
Name it ExpelAssumeRole if you used the provided StackSet template. The policy
grants the permissions. You can find that code in the attachment for this
article in the Step 9 area.
## Step 10: Complete Workbench setup
Congratulations! You configured S3 notifications to an SQS queue through SNS.
Go through Step 8: Register AWS in Workbench of the AWS CloudTrail: New
CloudTrail setup for Workbench complete setup to register the integration in
Workbench. Make sure to select Manual Connection for the connection type.
You require the following details to complete this step:
* Role ARN: Expel Role ARN created in Step 1 specific to the Log Archive account.
* SQS URL: the full URL path of the SQS created in Step 4.
* Organization Management Account: the account ID of your AWS organization’s management account.
### Tip
This article was accurate at the time of writing, but changes happen. If you
find the instructions are outdated, leave a description in the comment field
below and let us know!
|
About console permissions in your devices | https://support.expel.io/hc/en-us/articles/12871722483347-About-console-permissions-in-your-devices | 2023-01-09T15:29:41 | As you connect your devices to Workbench, you provide Workbench access to
those devices through permissions in the devices. These permissions vary from
1 device technology to another, but we typically need at least Read access to
your devices to pull in any logs from those devices into Workbench.
Without minimum permissions to your devices, the SOC analysts are limited in
their insight into your technology. This can mean they surface more benign
alerts to your team for further investigation, resulting in increasing the
workload for your team, and resulting in alert fatigue.
If you grant Read access to your devices, we can investigate the device and
the logs more deeply and surface relevant alerts to you in Workbench. Allowing
Expel visibility into the console of your security devices helps our SOC
analysts make better decisions on whether an alert is benign or malicious. It
also allows our SOC analysts to perform health checks to make sure Workbench
is not missing alerts from your security devices. Depending on what your
organization purchased from Expel, the SOC analysts may even be able to
contain and/or remediate the issues on your behalf.
Ultimately, the more permissions you can grant Workbench, the better and
faster the SOC analysts can find and investigate alerts in your environment.
|
What are Expel alerts? | https://support.expel.io/hc/en-us/articles/12925742896787-What-are-Expel-alerts- | 2023-01-10T21:54:24 | Expel alerts are vendor alerts that appear in Workbench for analysts to
triage, investigate, and respond to. An Expel alert is created when one or
more vendor alerts satisfy the rule logic in our detection engines. You can
view Expel alerts on the Alerts analysis dashboard.
Each Expel alert is assigned a severity, which may not always match the
severity of the originating vendor alert(s). Expel alerts are _de facto_ tier
1 when mapping back to the traditional security operations center (SOC)
process. New Expel alerts trigger Ruxie, our automated workflow bot. Ruxie
creates new investigative actions, looks for similar Expel alerts, and even
closes the alert in certain circumstances.
As our SOC analysts and Ruxie triage Expel alerts, they can end up proceeding
in 3 different ways:
* **Closed** : Expel alerts are closed if the vendor alert is benign or doesn’t fall into a category we can investigate further. For example, potentially unwanted programs (PUP) or potentially unwanted applications (PUA).
* **Escalated to investigation** : if there’s a potential of malicious behavior or our SOC analysts need more information, we create an investigation from that Expel alert.
* **Escalated to incident** : if an Expel alert is explicitly malicious, it is immediately escalated to an incident.
In the case of phishing Expel alerts, instead of a vendor alert being both the
source/cause of the Expel alert, it’s a phishing submission.
In the Expel alert/triage phase Ruxie may contact your organization to ask
“did you expect this?”.
In both cases, Expel alerts are closed with a reason and a comment if they are
determined to be benign in nature.
|
What are incidents? | https://support.expel.io/hc/en-us/articles/12925743005331-What-are-incidents- | 2023-01-10T21:54:25 | If the SOC analysts determine there's a threat in an organization’s
environment, an incident is created or an investigation is promoted to an
Incident.
Incidents are similar to investigations in that they include investigative
actions and have a similar look and feel. Incidents, however, include
findings. These are the details to the common questions:
* What is it?
* Where is it?
* When did it get here?
* How did it get here?
Incidents can also include remediation and resilience actions.
|
What are investigations? | https://support.expel.io/hc/en-us/articles/12925743051411-What-are-investigations- | 2023-01-10T21:54:26 | An Expel alert becomes an investigation if the SOC analysts think a more in-
depth analysis of the activity is needed. In this case, the Expel alert that
raised suspicion is called the lead Expel alert.
Investigations are where the SOC analysts can perform additional actions
(investigative actions) to uncover more information to help determine the
scope and nature of the activity that occurred proximate to the time of the
Expel alert.
In an investigation, you and the SOC analysts can collaborate and share
information in Workbench to reach a conclusion through comments, findings, and
investigative actions.
If the activity is determined to be benign, the investigation is closed with
an explanation. If not, the investigation is promoted to an incident.
|
What are vendor alerts? | https://support.expel.io/hc/en-us/articles/12925743290387-What-are-vendor-alerts- | 2023-01-10T21:54:29 | Vendor alerts are the Expel-normalized representation of signal coming from
integrations you connected to Workbench. Vendor alerts are signal in the form
of alerts from security technologies such as endpoint detection and response
(EDR) providers, next-gen firewalls (NGFW), or security information and event
management (SIEM) systems. Vendor alerts can also include audit events
produced by software Expel monitors. For example, AssumeRole events from AWS
CloudTrail, or login events from Microsoft Azure AD, and so on.
Every vendor alert is associated with a specific security device in Workbench.
Vendor alerts don’t have a status and we don’t assign them. Our detection
engines evaluate vendor alerts to produce Expel alerts if they rise to the
level of requiring additional attention.
|
What are findings? | https://support.expel.io/hc/en-us/articles/12925746962195-What-are-findings- | 2023-01-10T21:54:25 | Findings are where security analysts document, in detail, the answers to
questions such as: What is it? Where is it? When did it get here? How did it
get here?
### Tip
In the cases of commodity malware, business email compromise and red team
activity, the findings are even more optimized to directly address those
specific classes of activity.
Lastly, on every incident you find an alert-to-fix timeline in the findings
section in Workbench that describes the activity involved in answering the
above questions.
|
What are investigative actions? | https://support.expel.io/hc/en-us/articles/12925747081875-What-are-investigative-actions- | 2023-01-10T21:54:27 | Investigative actions are steps an analyst and/or automation take to aid in
the investigation. Most commonly used investigative actions are steps that a
given security technology supports. For example,
* acquiring a file can be accomplished by asking Workbench to retrieve it.
* Workbench navigates for the SOC analysts, indicating how to acquire the file from any number of EDRs.
Investigative actions can also describe manual steps. This is less common, but
an investigative action can be created, for example, tasking you to upload a
file that Expel doesn’t have access to but needs to complete the
investigation.
Investigative actions come in many forms, but can be grouped into 2
categories: _triage support_ and _communications_.
* Triage support consists of gathering additional data from customer devices, enriching data from external data sources, and fetching data sources from multiple locations.
* Communications involves sending out verify actions or notifications.
|
What is a Phishing submission? | https://support.expel.io/hc/en-us/articles/12925747142803-What-is-a-Phishing-submission- | 2023-01-10T21:54:27 | The phishing submission model object represents some email metadata related to
an Expel alert. It can further link to other metadata in the form of
attachments/URLs/headers for that submission record. It's roughly analogous to
a vendor alert, but can also exist in tandem with a vendor alert. For example,
a Proofpoint TAP-based Expel alert has a vendor alert containing threat
information and a phishing submission record containing the email information
from the Proofpoint TAP alert.
|
What are remediation actions? | https://support.expel.io/hc/en-us/articles/12925747196051-What-are-remediation-actions- | 2023-01-10T21:54:28 | A remediation action is a recommended action that should be performed by the
customer organization, an analyst, or another automated process to ensure that
the bad actor(s) involved in an incident are stopped. Expel can automate some
remediation steps, removing the customer from the loop if they choose.
|
Expel alert categorization by alert fidelity and impact | https://support.expel.io/hc/en-us/articles/13017623221779-Expel-alert-categorization-by-alert-fidelity-and-impact | 2023-01-13T17:15:27 | Expel uses the following matrix to map an alert's fidelity and impact to an
Expel alert severity.
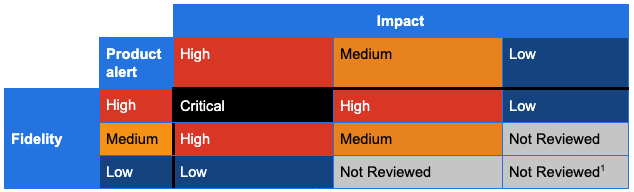
Expel considers the following when assigning severities of Critical, High,
Medium, or Low for Expel created rule content, and when reclassifying certain
security product alerts:
1. How likely can the underlying logic that generated the alert identify what it was designed to identify? This is also known as the _alert fidelity_.
* High Fidelity: the alert maintains a true positive rate of **50%** or greater.
* Medium Fidelity: the alert maintains a true positive rate between **5% to 50%**.
* Low Fidelity: the alert maintains a true positive rate between **0% to 5%**.
2. If the alerts are a true positive, what is the impact to the organization?
* High Impact: there's a high or absolute likelihood of consequences, including but not limited to:
* Business operation outage to critical systems
* Large reputational damage
* Large amount of regulated data exposed
* Catastrophic exposure of trade secrets
* Large financial loss
* Medium Impact: there's a high or absolute likelihood of consequences, including but not limited to:
* Business operation outage to non-critical systems
* Limited reputational damage
* Limited amount of regulated data exposed
* Limited exposure of trade secrets
* Limited financial loss
* Low Impact
* No business operation outage
* No reputational damage
* No amount of regulated data exposed
* No exposure of trade secrets
* No financial loss
|
Expel alert severity descriptions | https://support.expel.io/hc/en-us/articles/13017623282195-Expel-alert-severity-descriptions | 2023-01-13T17:15:28 | Expel processes 2 types of data from security technologies we integrate with:
alerts and events. Alerts are security events generated by a security
technology based on events it observed. Events are atomic elements like log
messages. Expel uses 2 combined approaches for mapping alerts to our alert
severity of Critical, High, Medium or Low:
* Categorization by alert fidelity and impact
* Categorization by security product fidelity
|
SIEM products fidelity and impact | https://support.expel.io/hc/en-us/articles/13017623557267-SIEM-products-fidelity-and-impact | 2023-01-13T17:15:31 | |
**Expel severity**
---|---
**Product**
|
**Critical**
|
**High**
|
**Medium**
|
**Low**
|
**Not reviewed**
Azure Log Analytics
| |
See Azure Active Directory Identity Protection and Microsoft Defender for
Cloud (formerly Azure Security Cloud)
|
See Azure Active Directory Identity Protection and Microsoft Defender for
Cloud (formerly Azure Security Cloud)
|
See Azure Active Directory Identity Protection and Microsoft Defender for
Cloud (formerly Azure Security Cloud)
|
See Azure Active Directory Identity Protection and Microsoft Defender for
Cloud (formerly Azure Security Cloud)
DEVO
|
N/A
|
N/A
|
N/A
|
N/A
|
N/A
Exabeam UBA
| | |
Score of 200 or greater
|
Score of 100 to 199
|
Score less than 100
iBoss
| | | | |
All alerts
LogRhythm
|
N/A
|
N/A
|
N/A
|
N/A
|
N/A
Splunk
|
N/A
|
N/A
|
N/A
|
N/A
|
N/A
Splunk Enterprise Security
| | |
Notable events categorized as High or Critical
| |
Notable events categorized as a lesser severity than High
QRadar Offenses
| | | |
Magnitude 7 or greater
|
Magnitude less than 7
|
Cloud products fidelity and impact | https://support.expel.io/hc/en-us/articles/13017668722707-Cloud-products-fidelity-and-impact | 2023-01-13T17:15:31 | |
**Expel severity**
---|---
**Product**
|
**Critical**
|
**High**
|
**Medium**
|
**Low**
|
**Not reviewed**
AWS GuardDuty
| | |
Severity 7 or greater
| |
Severity less than 7
AWS Inspector
| | |
High risk “Network Reachability” alerts
| |
All other alerts
AWS MACIE
| | |
All alerts
| |
N/A
AWS Trusted Advisor
| | | | |
All alerts
DUO
|
N/A
|
N/A
|
N/A
|
N/A
|
N/A
Azure Active Directory Identity Protection
| |
Authentications from suspicious countries and leaked credential events
| | |
All other events
Defender for Cloud (formerly Azure Security Cloud)
| | |
Severity High and Critical
| |
Severity less than High
Microsoft Cloud App Security
| | |
Severity of 2 or greater
| |
Severity less than 2
Microsoft 365
| |
See Azure Active Directory Identity Protection and Microsoft Cloud App
Security
|
See Azure Active Directory Identity Protection and Microsoft Cloud App
Security
|
See Azure Active Directory Identity Protection and Microsoft Cloud App
Security
|
See Azure Active Directory Identity Protection and Microsoft Cloud App
Security
Okta
| | | | |
Security Threats
OneLogin
|
N/A
|
N/A
|
N/A
|
N/A
|
N/A
|
Usage Metrics overview | https://support.expel.io/hc/en-us/articles/13511503596179-Usage-Metrics-overview | 2023-01-30T17:25:04 | When your organization purchased Workbench, a certain number of attack
surfaces, or endpoints, were purchased. These endpoints are all the devices,
users, and other places threats can come from in your environment. In
Workbench you can see how many endpoints you're actually using in your
environment.
#### In this article
* Viewing the overall counts
* Viewing specific device counts
## Viewing the overall counts
To see the total counts for your environment, click Settings > Counts.
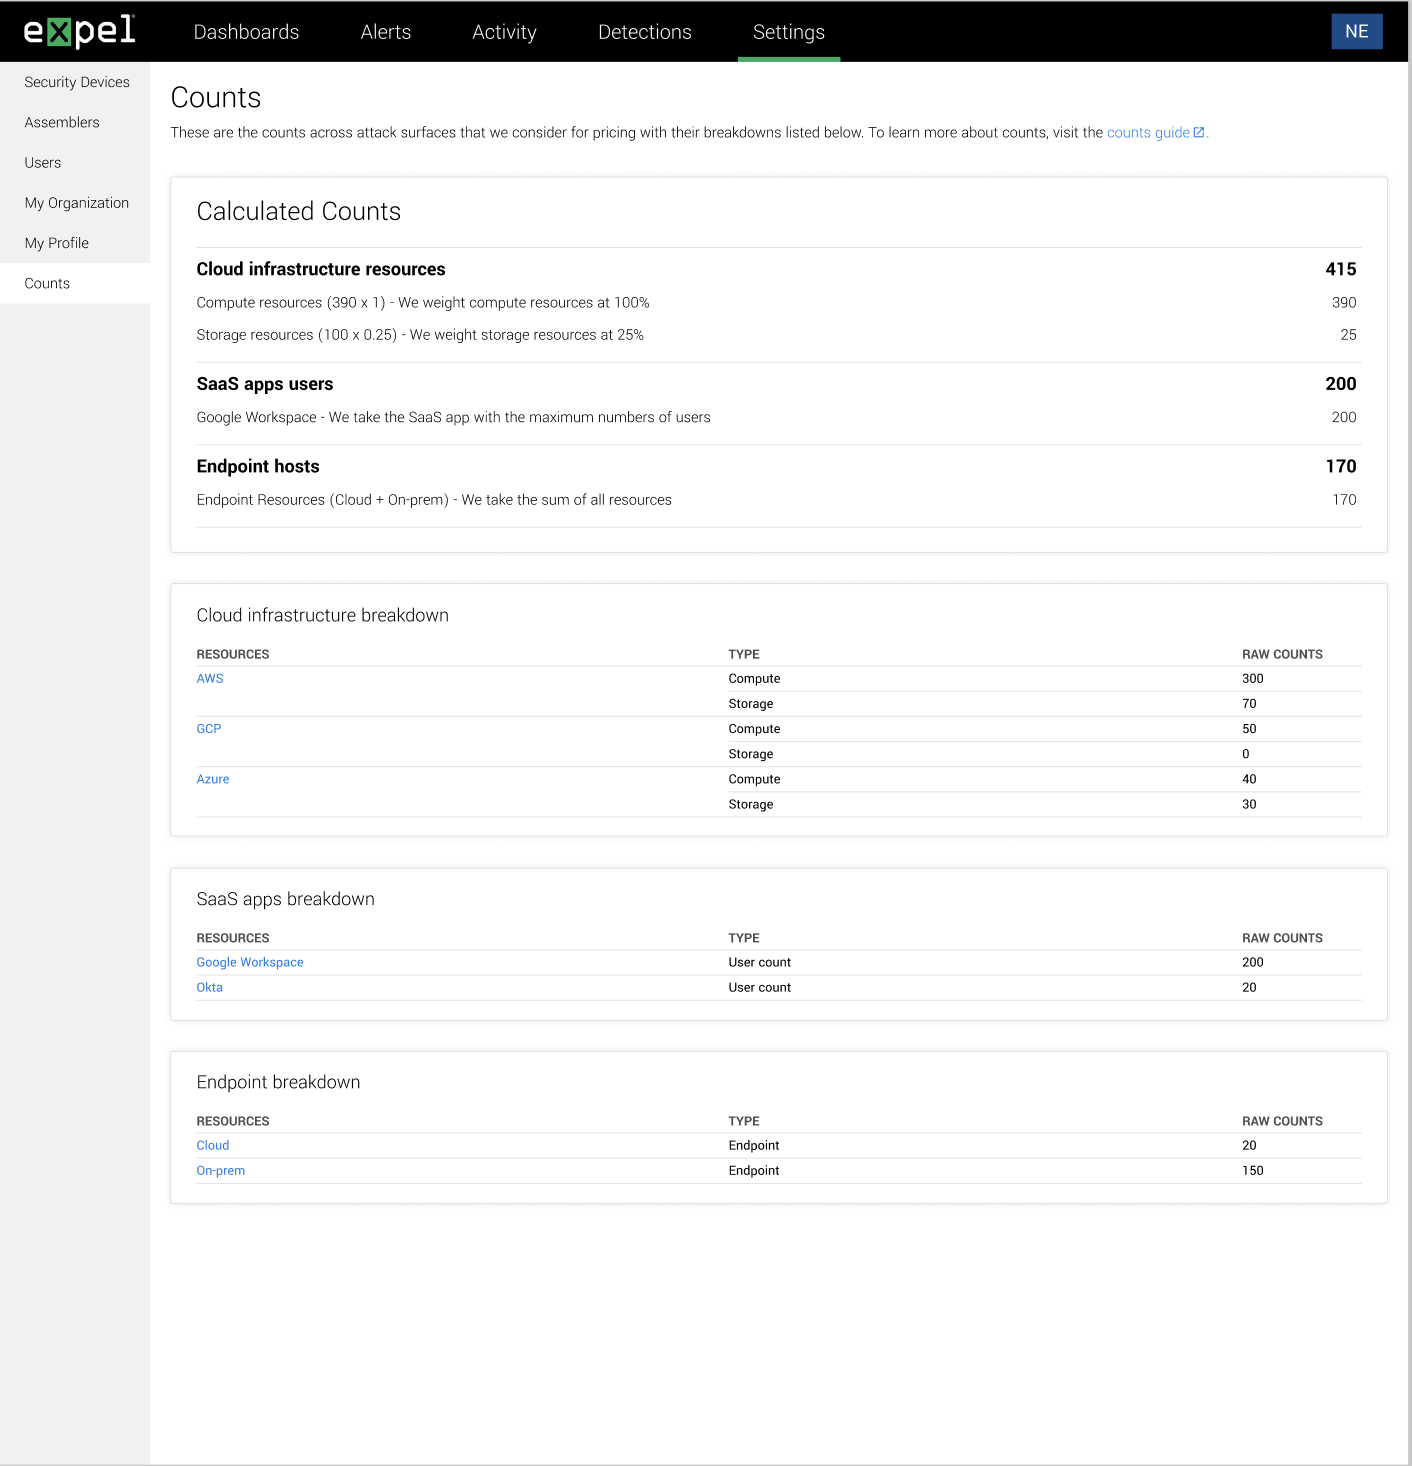
On this screen, you see:
* **Calculated counts** : these are the categories and the general numbers for each area listed.
* **Counts detail area** : these are the more detailed counts for the endpoints listed above.
For what the specific counts are and what they mean, go to What's counted in
your Expel usage
## Viewing specific device counts
You can also view the counts for a specific device. This view also shows you
the inventory for the selected device.
To see the specific device counts, click Settings > Counts > locate the device
to view > down arrow > View details > Counts.
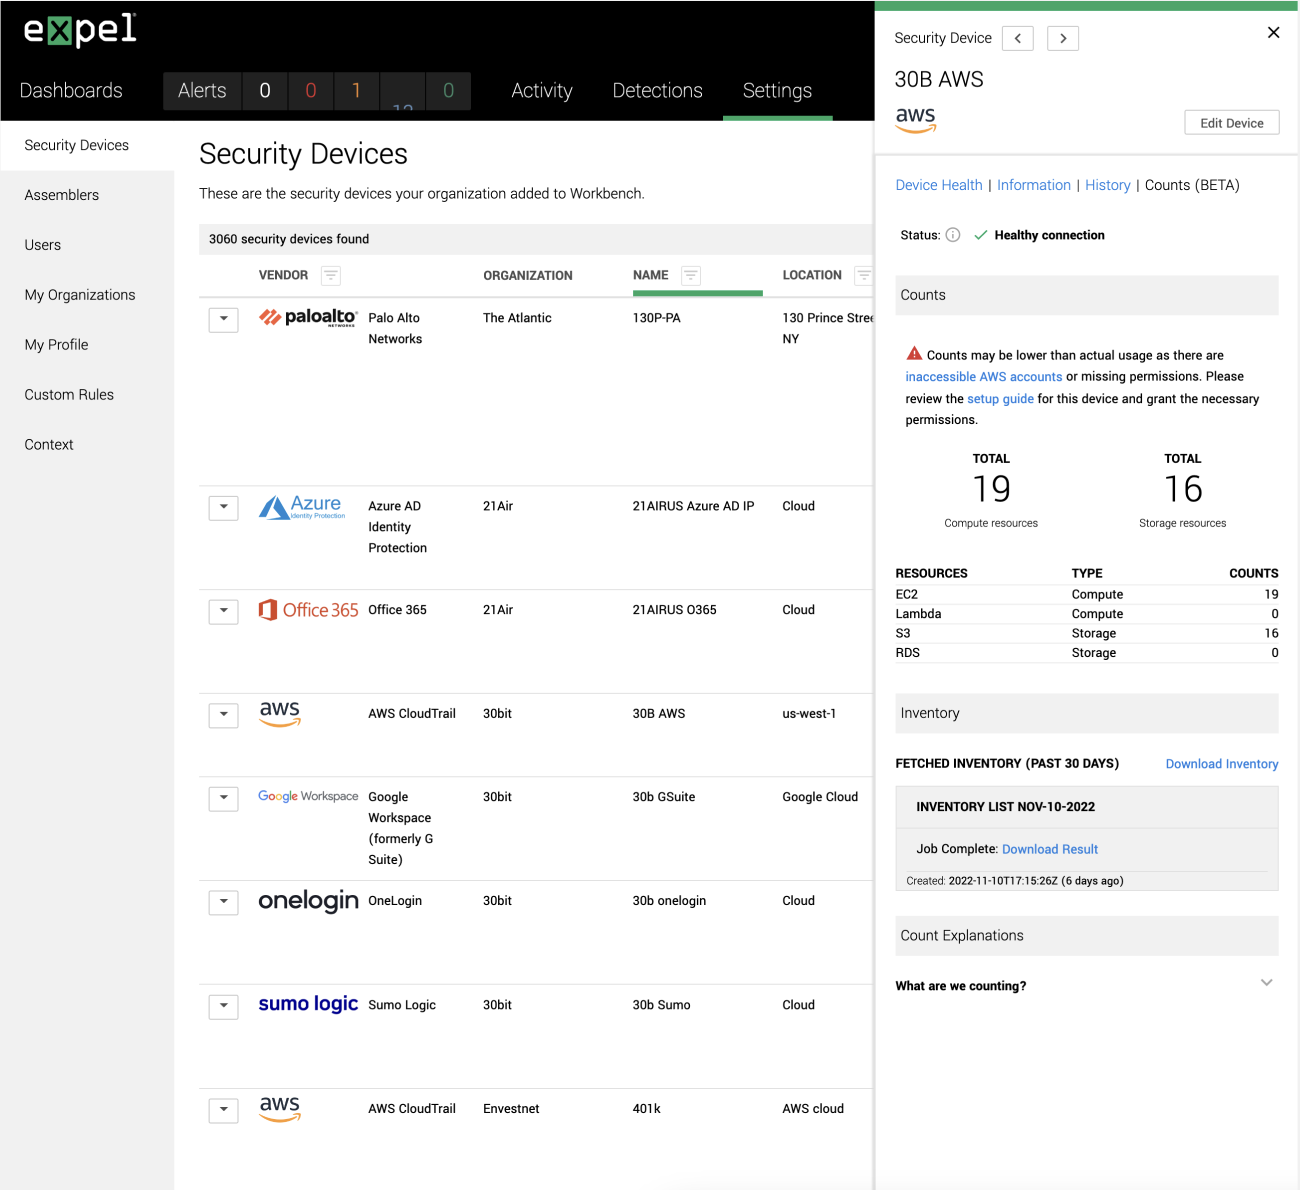
What you specifically see listed varies, based on the type of selected device.
To read an explanation of what you're seeing, expand Count explanations.
|
What's counted in your Expel usage | https://support.expel.io/hc/en-us/articles/13511503709587-What-s-counted-in-your-Expel-usage | 2023-01-30T17:25:05 | As you view your usage in Workbench, you see specific information for each
area. This article details that information for each type of technology.
#### In this article
* Kubernetes
* SaaS apps
* Duo
* Google Workspace
* Microsoft 365
* Okta
* Onelogin
* Cloud infrastructure
* AWS
* Azure
* Google Cloud Platform (GCP)
* Endpoints
* CrowdStrike
* Microsoft defender
* Palo Alto Networks Cortex
* SentinelOne
* Carbon Black
* Product not listed here?
**Kubernetes**
We count the median number of nodes over the past 30 days. Kubernetes Services
and Pods are informational only and are not factored into your usage.
What we're counting
|
Resource type
|
Description
---|---|---
Nodes
|
Nodes
|
The number of nodes across all clusters.
## SaaS apps
We count the most recent number of the IdP SaaS app with the maximum number of
users. If there is no IdP connected, we take the most recent number of the
SaaS app with the highest number of users.
**Duo**
What we're counting
|
Resource type
|
Description
|
Notes
---|---|---|---
Users
|
User count
|
The number of users that are not pending deletion in the organization's DUO
account.
|
Note: We filter for users where the account status is not "pending deletion".
See DUO admin users API.
**Google Workspace**
What we're counting
|
Resource type
|
Description
|
Note
---|---|---|---
Users
|
User count
|
The number of users that are not marked deleted in the organization's Google
Workspace account.
|
Note: We filter for users that are not deleted by setting showDeleted as
false. See Google workspace users list API.
**Microsoft 365**
What we're counting
|
Resource type
|
Description
|
Note
---|---|---|---
Users
|
User count
|
The number of users that can sign in.
|
Note: We filter for users where the field accountEnabled is true. See
Microsoft user properties.
**Okta**
What we're counting
|
Resource type
|
Description
|
Notes
---|---|---|---
Users
|
User count
|
The number of active users in the organization's Okta account.
|
Note: We filter for users where the account status is not deprovisioned
(deactivated). See Okta user statuses.
**Onelogin**
What we're counting
|
Resource type
|
Description
|
Notes
---|---|---|---
Users
|
User count
|
The number of activated users in the organization's Onelogin account.
|
Note: We filter for users where status is not 0 (unactivated). See Onelogin
user resource.
## Cloud infrastructure
We apply a weighting factor to count the number of cloud resources we protect.
We count the median data point from the past 30 days, which prevents the data
from being skewed by outliers.
* We weight storage resources at 25%.
* We weight compute resources at 100%.
**AWS**
What we're counting
|
Resource type
|
Description
|
Note
---|---|---|---
EC2
|
Compute
|
The number of running AWS EC2 instances for this account. This includes EC2
instances created by other AWS services, for example, Elastic Kubernetes
Service (EKS).
|
Lambda
|
Compute
|
The number of unique lambdas for this account. This count is grouped by
account, region, and lambda name.
|
Note: We're treating lambdas with the same name but different regions or
accounts as separate lambdas because there can be differences in the security
configurations and access to services in each region or account.
S3
|
Storage
|
The number of S3 buckets for this account.
|
RDS
|
Storage
|
The number of provisioned RDS instances for this account.
|
**Azure**
What we're counting
|
Resource type
|
Description
---|---|---
Virtual machines
|
Compute
|
The number of virtual machines and virtual machine scale sets in this Azure
subscription.
Sites
|
Storage
|
The number of static sites in this Azure subscription.
Storage accounts
|
Storage
|
The number of storage accounts and compute disks for this Azure subscription.
SQL servers
|
Storage
|
The number of SQL virtual machines, SQL servers, and SQL databases in this
Azure subscription.
Functions and App Services
|
Compute
|
The number of Functions and App Service Apps in this subscription.
**Google Cloud Platform (GCP)**
What we're counting
|
Resource type
|
Description
|
Note
---|---|---|---
App Engine
|
Compute
|
The number of App Engine applications in all projects.
|
Cloud function
|
Compute
|
The number of unique cloud functions when grouped by project ID, region, and
function name.
|
Note: We're grouping functions with the same name that may be in a different
region or account because there can be differences in the security
configurations and access to services.
Compute instance
|
Compute
|
The number of compute instances in all projects and regions.
|
SQL admin
|
Storage
|
The number of Cloud SQL instances in all projects.
|
Storage
|
Storage
|
The number of Cloud Storage buckets in all projects.
|
## Endpoints
We count on-prem endpoint resources and don't count cloud resources. We take
the most recent number of endpoint resources. We’re not including mobile
devices or devices like printers, thermostats and other things with an IP
address in the usage data.
**CrowdStrike**
What we're counting
|
Resource type
|
Description
---|---|---
On-prem resources
|
Endpoint
|
The number of hosts with a non-null Service Provider in CrowdStrike. The
number of endpoints that have been last seen within 30 days.
**Microsoft defender**
What we're counting
|
Resource type
|
Description
|
Notes
---|---|---|---
Machines
|
Endpoint
|
The number of endpoints that have been last seen within 30 days.
|
Note: We filter for machines where the onboardingStatus is “onboarded”. See
machine resources API.
**Palo Alto Networks Cortex**
What we're counting
|
Resource type
|
Description
---|---|---
Endpoints
|
Endpoint
|
The number of endpoints that have been last seen within 30 days.
**SentinelOne**
What we're counting
|
Resource type
|
Description
---|---|---
Agents
|
Endpoint
|
The number of agents that don't have a Cloud Provider of AWS, CDP, or Azure in
SentinelOne. The number of endpoints that have been last seen within 30 days.
**Carbon Black**
What we're counting
|
Resource type
|
Description
---|---|---
Sensors
|
Endpoint
|
The number of endpoints that have been last seen within 30 days.
## Product not listed here?
The products listed here are the primary ones we use for determining your
usage for each product. There are many more products we integrate with. If you
only have products not listed here integrated with Workbench, your account
team can work with you to determine the correct quantity of Expel to purchase.
|
Connecting your devices securely to Workbench | https://support.expel.io/hc/en-us/articles/13612714001171-Connecting-your-devices-securely-to-Workbench | 2023-02-02T15:59:46 | All traffic from Expel to your security devices come from 1 of these 6 IP
addresses, which are available in DNS under the hostname
egress.opsv2.expel.io. If your security tech supports an IP allow list,
configure it to restrict access to these IP addresses.
* 34.75.13.114
* 34.75.152.7
* 35.243.190.98
* 104.196.158.205
* 34.75.81.28
* 34.75.210.18
|
Slack setup for Workbench | https://support.expel.io/hc/en-us/articles/13807470251027-Slack-setup-for-Workbench | 2023-02-08T21:52:49 | This article helps you integrate your Slack installation with the Expel
Workbench.
#### In this article
* Before you start
* Step 1: Enable API access
* Step 2: Configure Slack in Expel Workbench
## Before you start
* **Slack Enterprise Grid is required.**
* The Slack app must be installed by the **Owner** of the Enterprise Grid organization.
* The Slack app must be installed on the organization, not just a workspace within the organization.
## Step 1: Enable API access
Having read-only access to the interface of your technology allows Expel to
dig deeper during incident investigations. Our device health team uses this
access to investigate potential health issues with your tech.
### Note
Expel secures all login information our SOC analysts need about your devices
in a MFA password product. Access to this login information is protected using
our internal MFA processes. To learn more about the IP addresses all Expel
traffic comes from, go here.
1. Create a new slack app https://api.slack.com/apps.
2. In the settings for the new app, select OAuth > Permissions from the left navigation. Scroll to the section titled Scopes, then click Add an OAuth Scope under User Token Scopes. Add the `auditlogs:read` scope. Use https://localhost for the redirect URL.
3. In the settings for the new app, select Manage Distribution from the left navigation. Under the section titled Share Your App with Other Workspaces, make sure all four sections have the green checkmark. Then click the green Activate Public Distribution button.
4. Under the Share Your App with Your Workspace section, copy the Sharable URL and paste it into a browser to start the OAuth handshake that installs the app on your organization. You must be logged in as the Owner of your Enterprise Grid organization to install the app.
5. Check the list in the upper right of the installation screen to make sure you are installing the app on the Enterprise Grid organization, not an individual workspace within the organization (see image below).
6. After the app is authorized, you are redirected to the localhost URL that contains a temporary code. Use that code to manually exchange it with an access token. Click here for instructions. Save the access token for later use.
## Step 2: Configure Slack in Expel Workbench
Now that we have the correct access configured and noted the credentials, we
can integrate your tech with Workbench.
1. In a new browser tab, click this link to open the Add Security Device screen in Workbench.
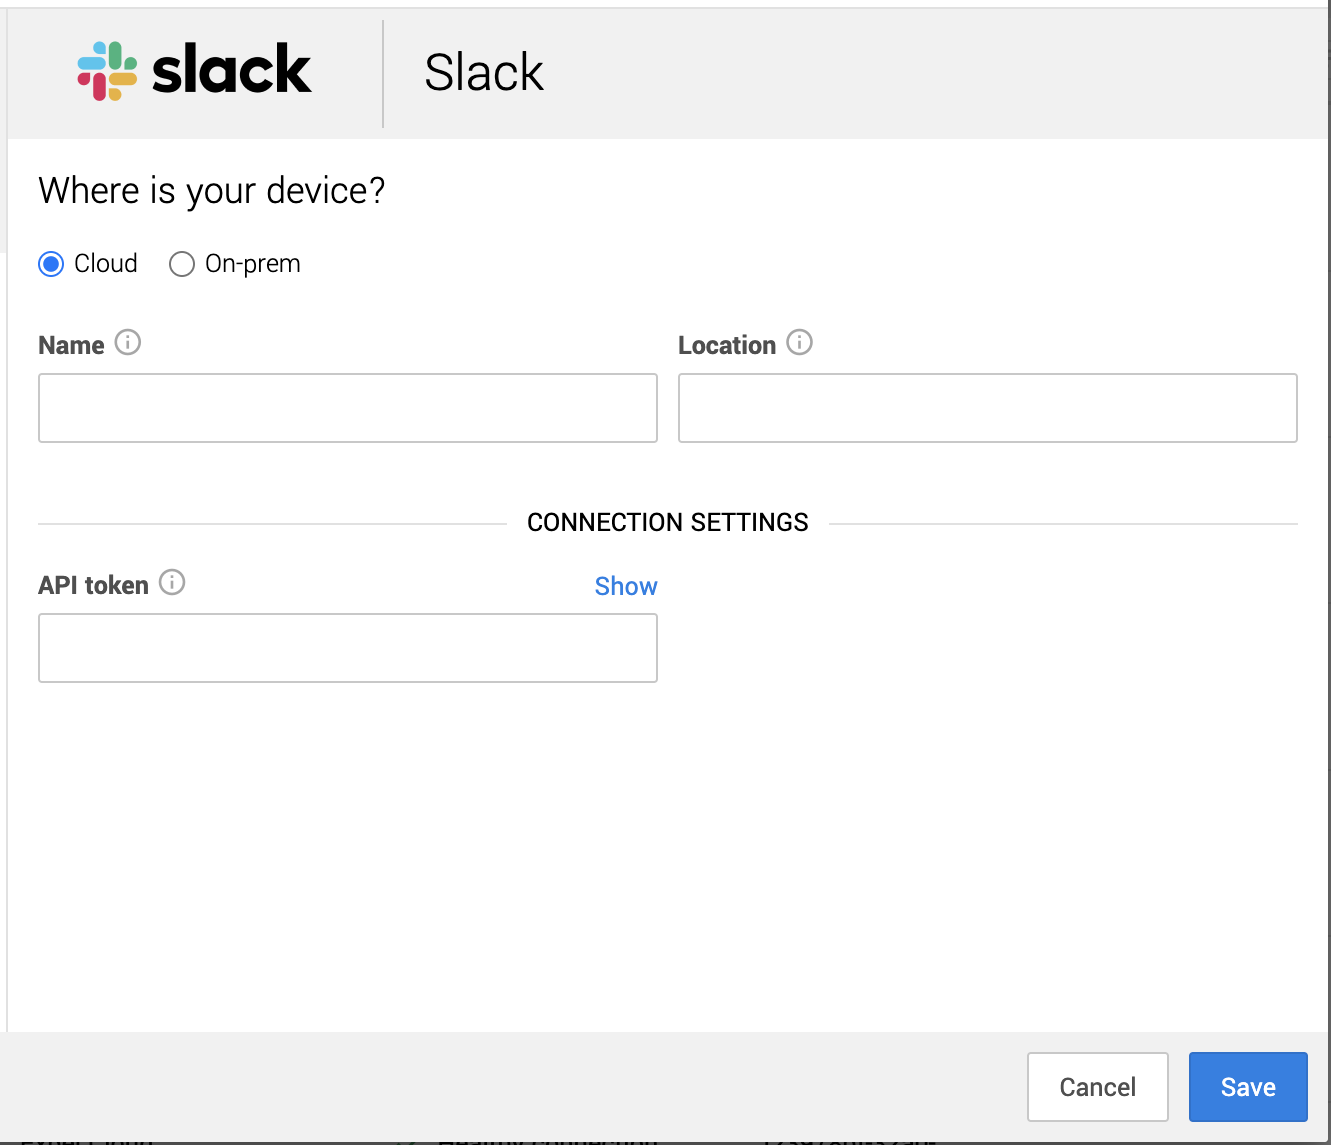
2. Fill in the fields like this:
Field name
|
What to put in it
---|---
Name
|
What you want to name the security device.
Location
|
Geographic location of the server.
API Token
|
The access token created in Step 1.
3. Click Save.
You can see if the device is healthy on the Security Devices page. It may take
a few minutes to see the device listed as healthy.
To check if alerts are coming through, navigate to the Alerts Analysis page.
Scroll to the device you want to check and click View alerts. Switch to grid
view, then check the list for device alerts. It can take 36 to 72 hours for
alerts to appear after setup, as we tune your device.
### Tip
This article was accurate at the time of writing, but changes happen. If you
find the instructions are outdated, leave a description in the comment field
below and let us know!
|
Microsoft Intune setup for Workbench | https://support.expel.io/hc/en-us/articles/14012946928659-Microsoft-Intune-setup-for-Workbench | 2023-02-15T18:34:05 | This article helps you provide the provisioning of the Azure App needed to
perform the graph API queries for the deviceManagement endpoint, which allows
the Expel Workbench to collect logs for Microsoft Intune.
#### In this article
* Step 1: Enable console access
* Step 2: Configure Slack in Expel Workbench
#### Step 1: Enable console access
Having read-only access to the interface of your technology allows Expel to
dig deeper during incident investigations. Our device health team uses this
access to investigate potential health issues with your tech.
### Note
Expel secures all login information our SOC analysts need about your devices
in a MFA password product. Access to this login information is protected using
our internal MFA processes. To learn more about the IP addresses all Expel
traffic comes from, go here.
1. Sign into Azure and search for app registrations.
2. In the App registrations pane, select New registration.
3. Give the application a name, choose the supported account type that can access the API, assign a redirect URL if needed, and click Register to create the app.
4. After you load into the app, select API permissions to begin selecting the necessary permissions for the integration.
5. Choose to add permissions to the app and select Microsoft Graph > Application permissions, and then scroll down to DeviceManagementApps. Select DeviceManagementApps.Read.All and click Add permissions to prepare the grant permissions request.
6. Create a Client secret to enter into Workbench to facilitate API authentication for alert polling. Save this for later use.
7. As an Administrator, navigate to the Expel Admin Consent Page.
8. Review and accept the requested permissions.
9. The Expel Intune Integration app now appears under Enterprise Applications. Review properties and make sure that all permissions were properly granted.
#### Step 2: Configure Slack in Expel Workbench
Now that we have the correct access configured and noted the credentials, we
can integrate your tech with Workbench.
1. In a new browser tab, click this link to open the Add Security Device screen in Workbench.
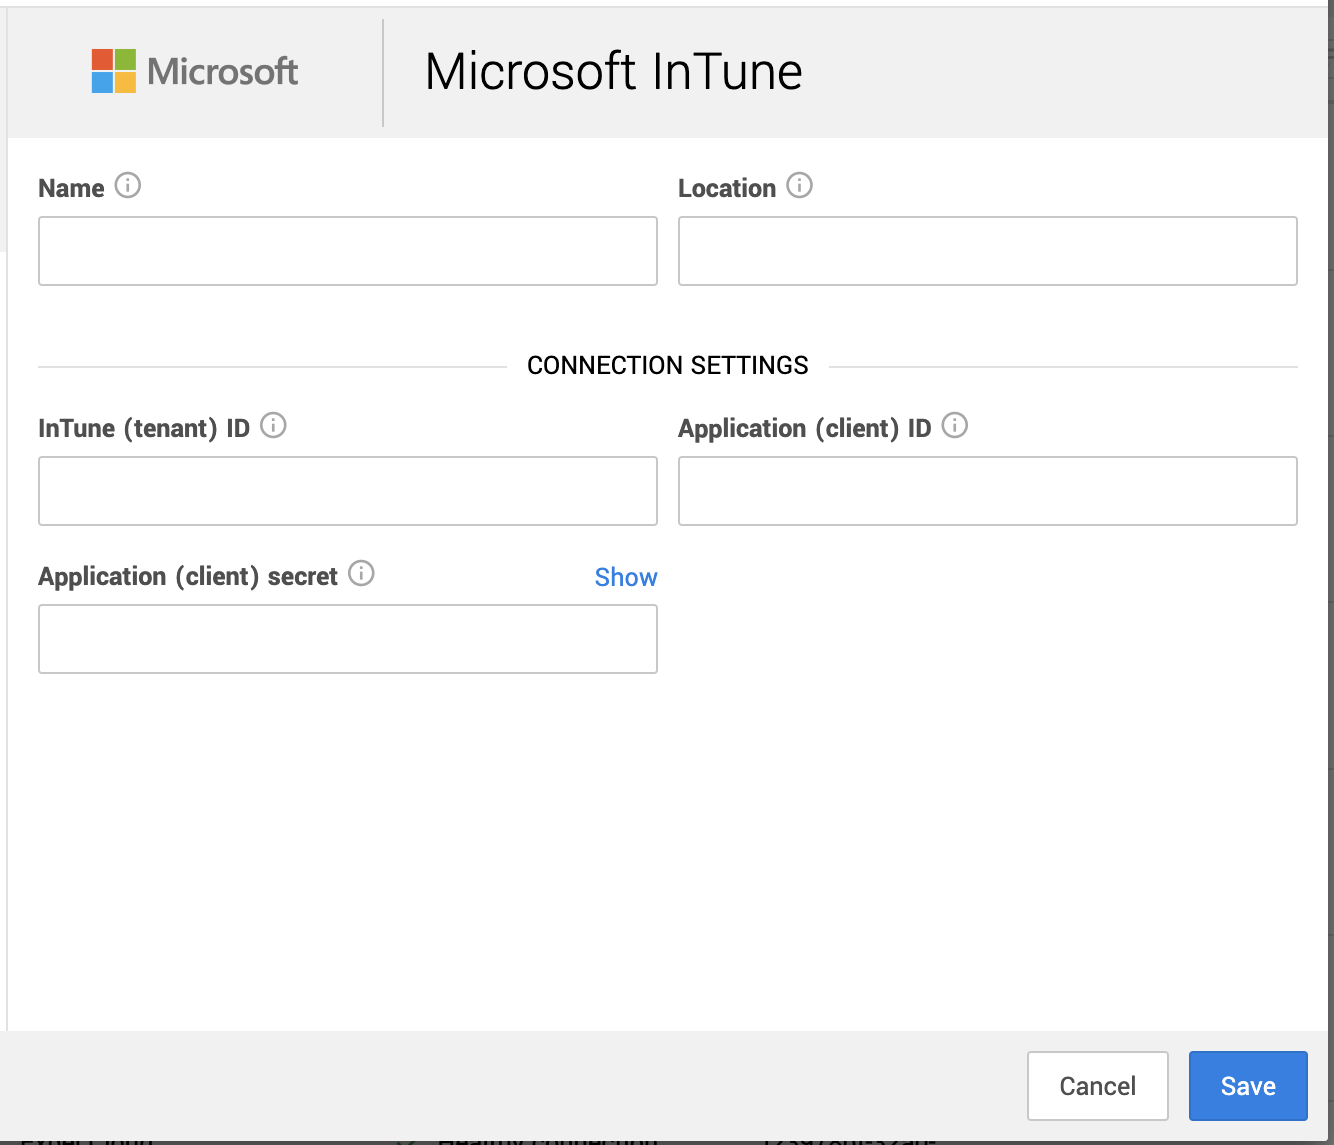
2. Fill in the fields like this:
Field name
|
What to put in it
---|---
Name
|
What you want to name the security device.
Location
|
Geographic location of the server.
Intune (tenant) ID
|
Application (client) ID
|
Application (client) secret
|
The client secret created in Step 1.
3. Click Save.
You can see if the device is healthy on the Security Devices page. It may take
a few minutes to see the device listed as healthy.
To check if alerts are coming through, navigate to the Alerts Analysis page.
Scroll to the device you want to check and click View alerts. Switch to grid
view, then check the list for device alerts. It can take 36 to 72 hours for
alerts to appear after setup, as we tune your device.
### Tip
This article was accurate at the time of writing, but changes happen. If you
find the instructions are outdated, leave a description in the comment field
below and let us know!
|
ExtraHop Setup for Workbench | https://support.expel.io/hc/en-us/articles/14012947037715-ExtraHop-Setup-for-Workbench | 2023-02-15T18:34:06 | This guide helps you connect your ExtraHop installation to the Expel
Workbench.
#### In this article
* Before you start
* Step 1: Enable console access
* Step 2: Configure the technology in Workbench
## Before you start
You must have:
* **ExtraHop Reveal(x) Enterprise. Expel does not support ExtraHop Reveal(x) 360.**
* An ExtraHop user account with admin-level permissions to create another account.
## Step 1: Enable console access
Having read-only access to the interface of your technology allows Expel to
dig deeper during incident investigations. Our device health team uses this
access to investigate potential health issues with your tech.
### Note
Expel secures all login information our SOC analysts need about your devices
in a MFA password product. Access to this login information is protected using
our internal MFA processes. To learn more about the IP addresses all Expel
traffic comes from, go here.
1. Login to the ExtraHop console using the admin account.
2. Create a new user account named Expel-Integration with these permissions:
* Full Read-only permissions.
* `"write" : "personal"` This is required for API key generation.
3. Login to the ExtraHop console using the Expel-Integration account.
4. Click the user bubble to open a list with an API access option, then select API access. If you need instructions on creating an API key in ExtraHop, click here.
5. Type a description for the API key, then click Generate. Make a note of the key for later use.
## Step 2: Configure the technology in Workbench
Now that we have the correct access configured and noted the credentials, we
can integrate your tech with Workbench.
1. Click this link to open Workbench. The link opens the Add Security Device screen directly. You may need to log in first.
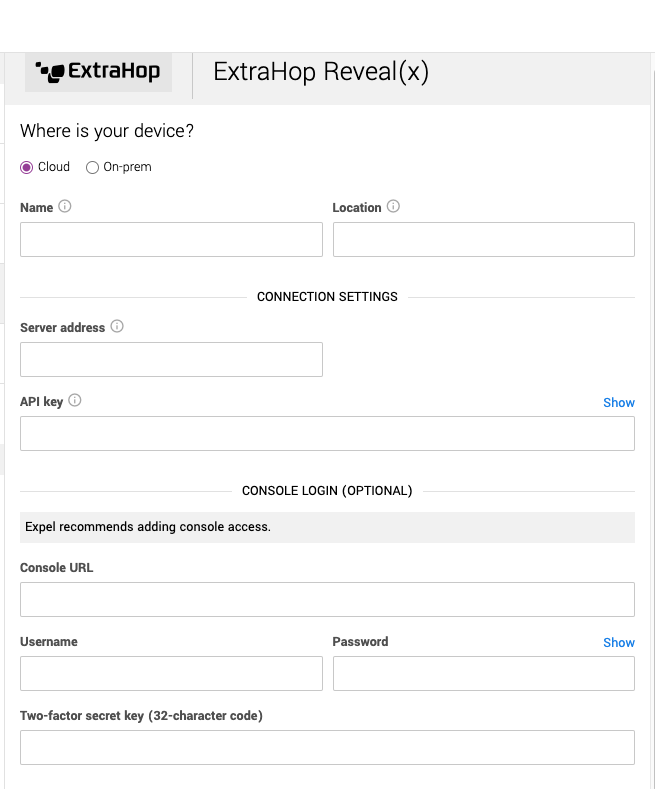
2. Fill in the Connection Settings fields like this:
* Add a Name and Location that are meaningful to you.
* For Server address, use the ExtraHop server URL.
* For API key, use the key generated in Step 1.
3. (Optional) To grant console access, fill in the Console Login fields like this:
* For Console URL, use the ExtraHop console URL.
* For Username and Password, use the username and password created for the Expel-Integrations account.
4. Click Save.
You can see if the device is healthy on the Security Devices page. It may take
a few minutes to see the device listed as healthy.
To check if alerts are coming through, navigate to the Alerts Analysis page.
Scroll to the device you want to check and click View alerts. Switch to grid
view, then check the list for device alerts. It can take 36 to 72 hours for
alerts to appear after setup, as we tune your device.
### Tip
This article was accurate at the time of writing, but changes happen. If you
find the instructions are outdated, leave a description in the comment field
below and let us know!
|
GitHub self-hosted (on-prem) setup for Workbench | https://support.expel.io/hc/en-us/articles/14049611141779-GitHub-self-hosted-on-prem-setup-for-Workbench | 2023-02-16T18:36:02 | This article explains how to connect GitHub to Workbench.
#### In this article
* Before you start
* Step 1: Install the self-hosted GitHub App
* Step 2: Configure the technology in Workbench
## Before you start
You must have:
* A GitHub Enterprise account license. For more information, see GitHub products.
### Note
This procedure is specifically for self-hosted GitHub deployments. For cloud-
hosted, use the GitHub cloud-hosted Workbench setup guide.
## Step 1: Install the self-hosted GitHub App
Workbench uses a GitHub App as part of the onboarding process. During
installation, the Expel GitHub App receives the following organization-level
privileges:
* Members: Read+Write
* Administration: Read-only
### Note
GitHub doesn't log user identities, making it difficult to track suspicious
activity at the user level. To solve this problem, Expel uses Write
Permissions to map GitHub data to a user's identity.
1. Use the Create a GitHub App instructions to create a custom application in the organization you want monitored. Fill in the required fields like this:
* GitHub app name: ExpelGitHubIntegration
* https://github.com/apps/expelgithubintegration
* Permissions:
* Members: Read+Write
* Administration: Read-Only
* Leave all other fields blank.
2. Navigate to the organization's Apps Settings page. Example URL: https://github.*****/organizations/*****/settings/apps/ExpelGitHubIntegration.
3. Write down the App ID.
4. Use the Authenticating with GitHub Apps instructions to generate a private key and store it for later use. This is your PEM key and you need it in the next section.
* ### Note
If you have multiple organizations, create a separate Security Device in
Workbench for each organization.
5. If you are using an Expel Assembler within your network, use the Managing allowed IP addresses for a GitHub App instructions to add the assembler's internal IP to the allow list. Otherwise, add the Expel egress IPs to the allow list:
* 34.75.13.114
* 34.75.152.7
* 35.243.190.98
* 104.196.158.205
* 34.75.81.28
* 34.75.210.18
## Step 2: Configure the technology in Workbench
Now that we have the correct access configured and noted the credentials, we
can integrate your tech with Workbench.
### Note
Expel secures all login information our SOC analysts need about your devices
in a MFA password product. Access to this login information is protected using
our internal MFA processes. To learn more about the IP addresses all Expel
traffic comes from, go here.
1. In a new browser tab, login to https://workbench.expel.io/settings/security-devices?setupIntegration=github.
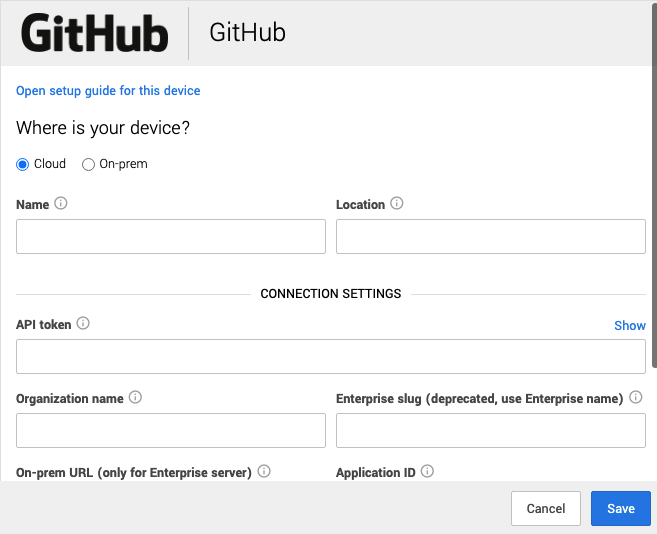
2. For Where is your device? select:
1. If you decided to allowlist the Expel egress IPs, select Cloud.
2. If you are using an Assembler, select On-prem.
3. For Assembler select the Assembler from the list. N/A for Cloud.
4. Complete these fields using the credentials and information from Step 1.
* For Name type the name of your GitHub organization.
* For Location type Cloud.
* For Organization name, type the name of your GitHub organization.
* For Enterprise slug type the Enterprise name.
* For the Application installation ID type the installation ID from Step 1.
* For Application ID type the application ID from Step 1.
* For Application Private PEM, copy and paste the PEM file contents from Step 1.
5. Click Save.
You can see if the device is healthy on the Security Devices page. It may take
a few minutes to see the device listed as healthy.
To check if alerts are coming through, navigate to the Alerts Analysis page.
Scroll to the device you want to check and click View alerts. Switch to grid
view, then check the list for device alerts. It can take 36 to 72 hours for
alerts to appear after setup, as we tune your device.
### Tip
This article was accurate at the time of writing, but changes happen. If you
find the instructions are outdated, leave a description in the comment field
below and let us know!
|
How to provision Expel Assembler | https://support.expel.io/hc/en-us/articles/1500002718861-How-to-provision-Expel-Assembler | 2021-02-17T20:44:46 | The Expel Assembler enables you to create a secure VPN connection so that we
can access your security devices. We’ve packaged it as a virtual machine. If
you install virtual machine images regularly, this should be pretty
straightforward.
#### In this article
* Do you need an Assembler?
* Download the Assembler image
* Register the Assembler in the Expel Workbench
* Deploy the Assembler virtual machine in your network
* Activate the Assembler through the virtual machine console
* Authorize the Assembler in the Expel Portal
## Do you need an Assembler?
The Expel Assembler is only needed if a security device you want to connect to
Workbench is on an internal network to your company. If Workbench can connect
directly to the security device, you don’t need an Assembler at all! Just go
right to adding the security device in Workbench.
## Before you start
Before you get started, you need 2 things.
1. A place to run the Expel Assembler virtual machine. We work with VMWare or Hyper V for on-prem environments and AWS or Microsoft Azure for cloud environments. The Assembler needs the following resources available:
* 4 virtual CPUs
* 8 GB RAM
* 100 GB disk space
2. Connect the Assembler virtual machine to the following network resources:
* Our VPN servers:
**Host**
|
**Ports**
---|---
provisionvpn.opsv2.expel.io
|
TCP 443 or TCP 8099
servicevpn.opsv2.expel.io
* The security devices you want to connect to the Expel Assembler. Search this knowledge base for documentation on each security device.
* Your DHCP server, unless you decide to assign a static IP to the Assembler.
* Your DNS server.
If your network is segmented, you may need to deploy multiple Assemblers. If
you have any questions about how many Assemblers to install, let us know and
we’ll recommend the best approach for your environment.
## Download the Assembler image
### Note
If you are deploying the assembler image in Amazon Web Services (AWS), then
skip this section and go to Register the Assembler in the Expel Workbench.
1. In Expel Workbench, click Settings in the top navigation bar.
2. Click Assemblers in the left navigation panel.
3. Click Download installer.
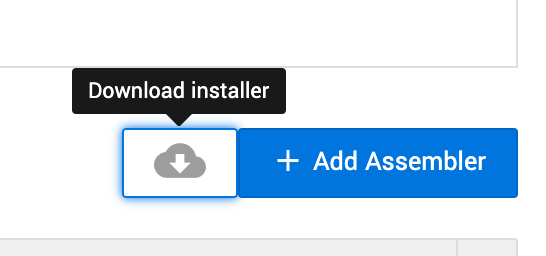
---
4. Click the installer link for your virtualization technology.
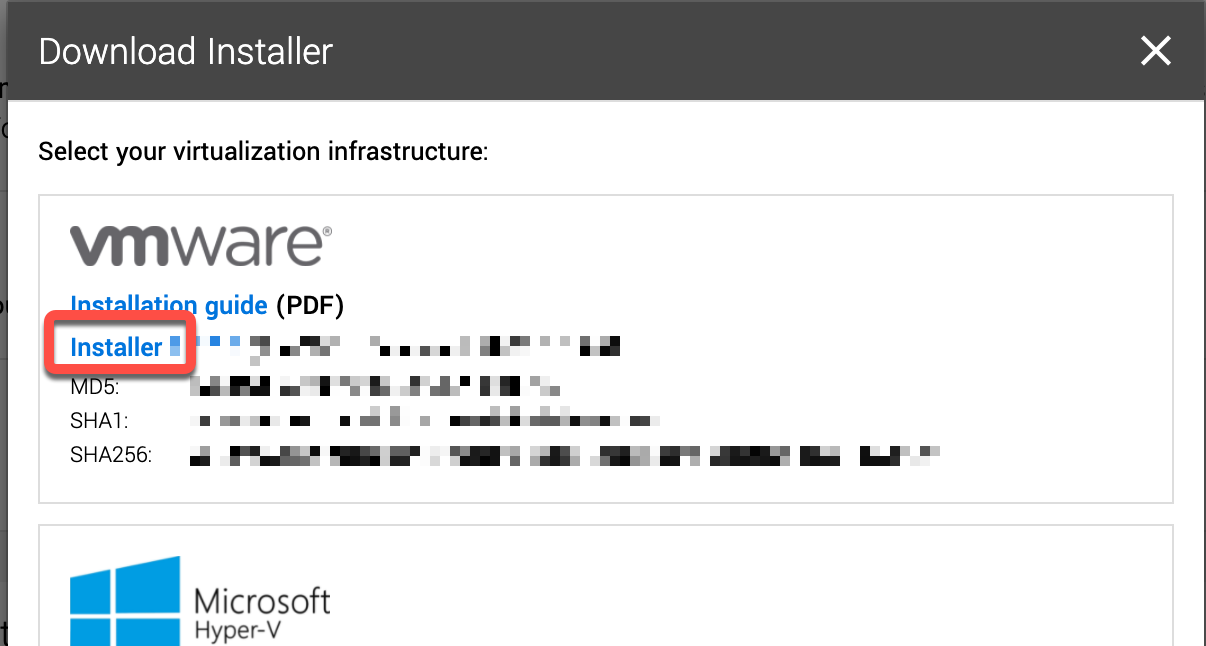
---
5. Note the hash of the file downloaded for error checking in Step 7.
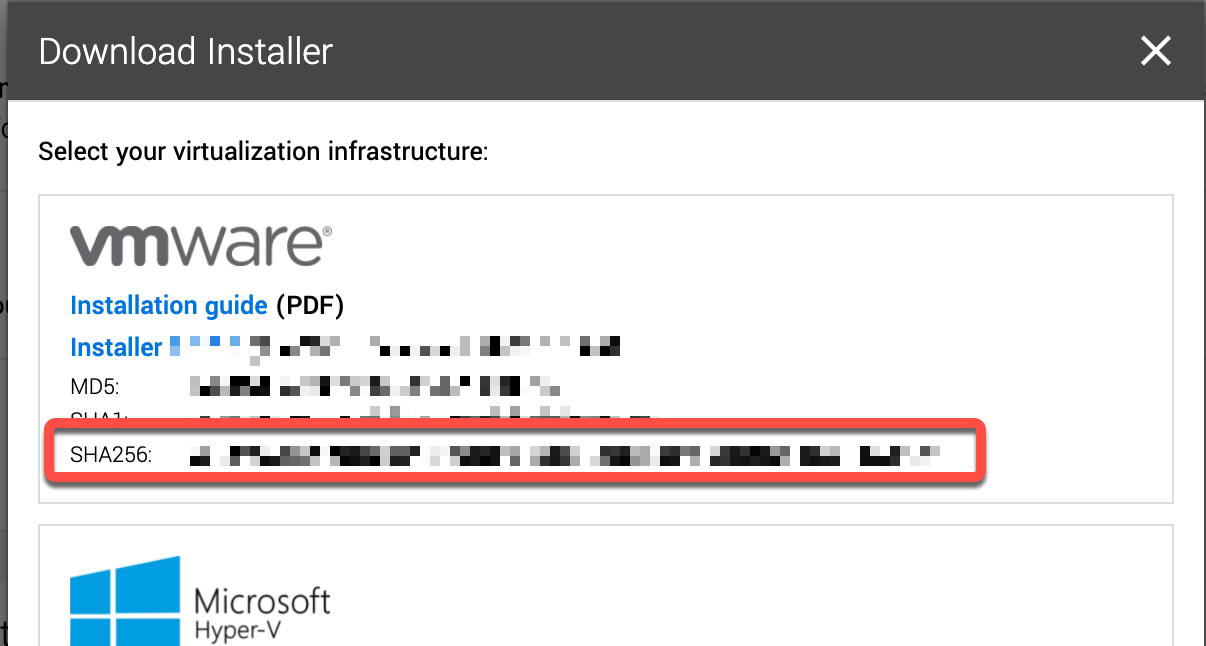
---
6. Now’s a good time to grab a cup of coffee because it’ll take a few minutes to download.
* If the hash matches, continue to Register the Assembler in Expel Workbench.
* If the hash doesn't match, download it again and re-check the hash.
* If the hash still doesn’t match after the second time, something’s not right. In that case, contact your engagement manager or customer success engineer in Slack or by email, or you can email devicehealth@expel.io.
7. After the download completes, verify that a hash of the file downloaded matches the data shown in Expel Workbench. The table below shows how you can do this for the 3 main operating systems.
### Caution
This is an important step because it confirms that your download is complete
and that no one tampered with the image.
**Operating system**
|
**Hash to verify**
|
**Command**
---|---|---
Windows
|
SHA256
|
Search for cmd, and select cmd.exe or “Command Prompt” from the results. Run
these commands in the window that opens:
cd <your download folder>
certutil -hashfile expel-assembler-vmware- <version>.ova sha256
Mac OS
|
SHA256
|
In Spotlight Search, search for the Terminal program and run it. In the
terminal window, run this command:
shasum -a 256 ~/Downloads/expel-assembler-vmware- <version>.ova
Linux
|
SHA256
|
In a terminal program, run:
sha256sum ~/Downloads/expel-assembler-vmware- <version>.ova
## Register the Assembler in the Expel Workbench
1. In Workbench, click Settings in the top navigation bar, then Assemblers on the left navigation panel. You see a box with the Assembler Name and Location fields. If not, click the Add Assembler button.
2. Type the Assembler Name and Location for the Assembler. It’s best to select names that are meaningful to both you and to Expel so you can easily identify the Assembler in the user interface. For example: ACME HQ.
3. Click Save.
4. Note the Install Code for the newly registered Assembler. You need this later to activate the Assembler.
5. To add another Assembler, click the Add Assembler button and repeat these steps.
#### Deploy the Assembler virtual machine in your network
Click a link for instructions on deploying the Assembler virtual machine in
your network:
* Deploying the Expel Assembler in AWS.
* Deploying the Expel Assembler On VMWare.
* Deploying the Expel Assembler on Hyper-V.
* Deploying the Expel Assembler on Microsoft Azure.
## Activate the Assembler through the virtual machine console
1. Select the newly deployed Virtual Machine for the Assembler.
2. Open the console of the Assembler.
3. Log in with username expel and password expel.
4. Set a unique and secure password for the expel account. First type the existing password (expel), then type the new password 2 more times. Securely store the new password per your organization's policies. You need it to log in to the Assembler again.
Note: Your password must be at least 8 characters and not a word found in the
dictionary.
You are required to change your password immediately (root enforced)
Changing password for expel.
(current) UNIX password: expel
New password: <enter new password>
Retype new password: <enter new password again>
---
5. Azure users only: delete the users you created during VM creation by running:
sudo userdel temp
6. Determine the network interface to use by running:
sudo expelmanage --list-interfaces
7. The Assembler uses DHCP by default. To use DHCP, skip to the next step. To use a static network configuration, run:
sudo expelmanage --net --interface <interface name> --type static --ip <IP address> --netmask <subnet mask> --gateway <gateway IP> --dns <nameserver IP>
<interface name> is determined in the previous step.
---
### Note
Get the IP address, subnet mask, gateway IP, and nameserver IP to input the
above command from your virtualization administrator.
8. Activate the Assembler by supplying the 8-character install code created in Register the Assembler:
sudo expelmanage --activate <eight-character install code>
You see output like this:
[expel@hostname ~]$ sudo expelmanage --activate abcd1234
Activation code set
Regenerating SSH keys
Activated
[expel@hostname ~]$
---
9. Run exit to log out of the console.
## Authorize the Assembler in the Expel Portal
Within 30 seconds of activating the Assembler with a matching install code,
the Assembler you registered at https://workbench.expel.io/settings/assemblers
changes status from Not Yet Connected to Connected, and an Authorize button
appears for the Assembler. Click the Authorize button.
Workbench now automatically configures the Assembler. This process takes about
10 minutes but can take longer if you have a slow network connection. After
complete, the status changes to Active.
If any errors occur along the way, leave everything as it is and file a
support case. We can often fix any issues without any further involvement from
you after it's connected to our VPN.
You can now begin to turn on your security devices. Follow the instructions in
the Getting connected to Expel Workbench.
|
Lacework setup for Workbench | https://support.expel.io/hc/en-us/articles/1500002718881-Lacework-setup-for-Workbench | 2021-02-17T20:44:47 | This article explains how to connect Lacework to Workbench.
#### In this article
* Step 1: Enable console access
* Step 2: Generate API credentials
* Step 3: Configure the technology in Workbench
* Step 4: Edit the device to add console access
## Step 1: Enable console access
Create a user in Lacework for Workbench or create an SSO user for Workbench
with access to Lacework.
Having read-only access to the interface of your technology allows Expel to
dig deeper during incident investigations. Our device health team uses this
access to investigate potential health issues with your tech.
## Step 2: Generate API credentials
To integrate the technology with Workbench, we need to create secure
credentials to the API.
Lacework provides a combination of API Access keys and tokens to be used by
clients and client applications to access the Lacework API. API access key IDs
and secret access keys are created using the Lacework Console. Temporary
access (bearer) tokens, used by clients, are created using the Lacework API.
Only administrators can create API access keys with a limit of 2 per user. An
API access key doesn't expire but can be disabled or deleted. After creation,
administrators can download and securely store the secret key.
1. To create an API key, navigate to Settings > API Keys and click \+ Create New.
2. Type a name for the key and an optional description and click Save.
3. To get the secret key, download the generated API key file and open it in an editor.
Docs reference: https://support.lacework.com/hc/en-
us/articles/360011403853-Generate-API-Access-Keys-and-Tokens
## Step 3: Configure the technology in Workbench
Now that we have the correct access configured and noted the credentials, we
can integrate your tech with Workbench.
### Note
Expel secures all login information our SOC analysts need about your devices
in a MFA password product. Access to this login information is protected using
our internal MFA processes. To learn more about the IP addresses all Expel
traffic comes from, go here.
1. In a new browser tab, login to https://workbench.expel.io.
2. On the console page, navigate to Settings and click Security Devices.
3. At the top of the page, click Add Security Device.
4. Search for and select your technology.
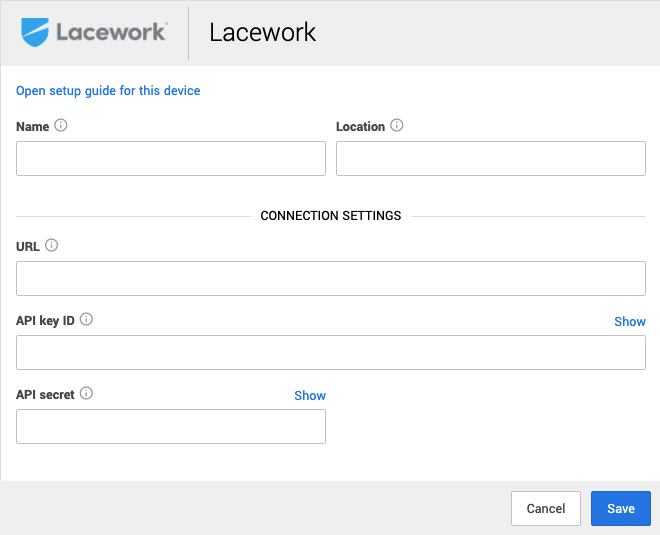
---
5. Complete all fields using the credentials and information you collected in Step 1 and Step 2.
* For Name type the host name of the Lacework device.
* For Location type the geographic location of the appliance.
* For URL type the host name or IP address of the Lacework management interface. Device IP can be found in the Lacework console under Dashboard > General Information > MGT IP Address.
* For API key type the API generated in Step 2.
* For API secret, type the secret generated in Step 2.
6. Click Save.
7. You can provide console access now or set it up later. Use the instructions below to set it up later.
You can see if the device is healthy on the Security Devices page. It may take
a few minutes to see the device listed as healthy.
To check if alerts are coming through, navigate to the Alerts Analysis page.
Scroll to the device you want to check and click View alerts. Switch to grid
view, then check the list for device alerts. It can take 36 to 72 hours for
alerts to appear after setup, as we tune your device.
## Step 4: Edit the device to add console access
Expel needs console access to your device to allow our SOC analysts to dig
deeper during incident investigations. Additionally, our engineering teams use
this access to investigate potential health issues, including proper alert
ingestion.
### Note
Expel secures all login information our SOC analysts need about your devices
in a MFA password product. Access to this login information is protected using
our internal MFA processes. To learn more about the IP addresses all Expel
traffic comes from, go here.
1. Open Workbench. Go to Organization Settings > Security Devices. Next to the device you just connected, click the down arrow and click Edit.
2. In the Console Login area, type these details:
* Console URL: type the console URL from the Server address in the Connection Settings area above. At the end of the URL, type **/login**.
* Username: type the user name you created above.
* Password: type the password you created above.
* Two-factor secret key (32-character code): depending on how your organization enforces log-ins, this field may not apply to you. In these cases, you can leave it blank. This field is optional and if you have questions or concerns, reach out to your engagement manager or to support.
3. Click Save.
### Tip
This article was accurate at the time of writing, but changes happen. If you
find the instructions are outdated, leave a description in the comment field
below and let us know!
|
Configuring your Okta SSO provider with Workbench | https://support.expel.io/hc/en-us/articles/1500002718901-Configuring-your-Okta-SSO-provider-with-Workbench | 2021-02-17T20:44:47 | This article explains setting up your Okta SSO provider with Expel Workbench
### Tip
Workbench logins don't support SCIM. We only support SAML and local logins.
1. Log into your Okta console.
2. Navigate to Applications in the main top navigation.
3. Click Add Application > Create New App.
4. The settings should be as follows:
* Platform: Web
* Sign on method: SAML 2.0
* Click Create.
### Note
This screen can look slightly different depending on your Okta account.
5. Under General Settings:
* App name: Expel Workbench.
* Upload our logo and click Save. You can right-click this image and save it locally.

* Click Next.
6. You are now on the Configure SAML step in Okta. Copy information from Expel Workbench to complete the integration. Open a new tab or window and log into Expel Workbench (https://workbench.expel.io)
7. Navigate to Organization Settings > My Organizations and select the organization. Click Integrations > Configure SSO.
8. Next, copy and paste the following from Expel Workbench into Okta:
* ACS URL or Single Sign-on URL → Single sign on URL
* Audience URI or Audience → Audience URI (SP Entity ID)
* Leave Yes, allow users to log in locally OR via SSO selected for local logins. This selection makes initial SSO setup easier. You can change this later.
9. In Okta under (A) SAML Settings, Attribute Statements (Optional):
* Type the word email under Name, and select user.email from the Value list.
### Tip
These are case sensitive.
* Click Next.
10. For the Okta feedback form, select I’m an Okta customer adding an internal app and fill in the following optional information as you see fit. Or This is an internal app that we have created. Then click Finish.
11. In Okta under Sign On, Settings > View Setup Instructions.
12. In Expel Workbench, click Next 2 times, until you see Step 3 of 3.
13. Copy and paste the following from Okta into Expel Workbench.
* Identity Provider Single-Sign-On URL → Single Sign-On URL or SAML 2.0 Endpoint
* Identity Provider Issuer → Issuer or Issuer ID
* X.509 Certificate → Certificate
14. Click Save in Expel Workbench.
### Important
Before signing in with SSO, make sure that:
* In your SSO provider, Workbench is assigned to all intended users.
* The user email addresses in your SSO provider match the email that's configured for the users in Workbench. The emails are case sensitive.
* New members of your organization that need access to Workbench have user accounts created in Workbench and have Workbench assigned to them in your Identity Provider.
* After you finish testing and setting up, in Workbench, you can disable local logins by going to the Integrations area in Settings. Click Edit from the list, and click No, users can ONLY log in via SSO. Then click Next > Next > Save to save.
|
Exabeam Fusion XDR setup for Workbench | https://support.expel.io/hc/en-us/articles/1500002718921-Exabeam-Fusion-XDR-setup-for-Workbench | 2021-02-17T20:44:50 | This article explains how to connect Exabeam Fusion XDR to Workbench.
#### In this article
* Step 1: Enable console access
* Step 2: Generate API credentials
* Step 3: Configure the technology in Workbench
* Step 4: Edit the device to add console access
## Step 1: Enable console access
Having read-only access to the interface of your technology allows Expel to
dig deeper during incident investigations. Our device health team uses this
access to investigate potential health issues with your tech.
The Exabeam Security Management Platform uniquely combines a data lake for
unlimited data collection, machine learning for advanced analytics, and
automated incident response into an integrated set of products. The SOC
analysts require a dedicated user account, which allows us to respond to
security alerts and leverage the data available in Exabeam Fusion XDR.
### Note
Expel secures all login information our SOC analysts need about your devices
in a MFA password product. Access to this login information is protected using
our internal MFA processes. To learn more about the IP addresses all Expel
traffic comes from, go here.
1. From the menu at the top right, click Settings.
2. In the Exabeam User Management section, select Users.
3. Select Add User. Type the following information for the fields:
**Field name**
|
**What to put in it**
---|---
User Type
|
Local
Username
|
expel
Full Name
|
Expel SOC
Email
|
Optional field can be left blank
Password
|
Enter a password. **Save the password to enter later in Workbench.**
4. For Role, select Tier 3 Analyst. If a custom role is preferred, complete the next 2 steps. Note the permission requirements. If you don't need a custom role, skip to Step 2 below.
5. For a custom role, type Expel for Role Name and Expel Custom Role for Description.
6. Select Advanced Analytics, and select the following permissions:
**View**
|
---|---
View Activities
|
Required
View Executive Info
|
Required
View Global Insights
|
Required
View Infographics
|
Required
View Insights
|
Required
View Rules
|
Required
**Edit and Approve**
|
Approve Lockouts
|
Optional but recommended
Accept Sessions
|
Optional but recommended
Manage Rules
|
Optional but recommended
Manage Watchlist
|
Optional but recommended
**Search**
|
Manage Search Library
|
Optional but recommended
Basic Search
|
Required
Threat Hunting
|
Required
View Search Library
|
Required
## Step 2: Generate API credentials
Having read-only access to the interface of your technology allows Expel to
dig deeper during incident investigations. Our device health team uses this
access to investigate potential health issues with your tech.
1. Navigate to Settings > Admin Operations > Cluster Authentication Token.
2. On the Cluster Authentication Token menu, click + to add a new token.
3. In the Setup Token dialog box, fill in the Token Name, set Expiry Date to Permanent, and set the Permission Level as Tier 3 Analyst.
4. Click Save.
5. Copy the generated token for use in the next step.
## Step 3: Configure the technology in Workbench
Now that we have the correct access configured and noted the credentials, we
can integrate your tech with Workbench.
1. Go to https://workbench.expel.io/settings/security-devices?setupIntegration=exabeam_fusion_xdr.
2. Complete the fields using the credentials and information you collected in Step 1 and Step 2.
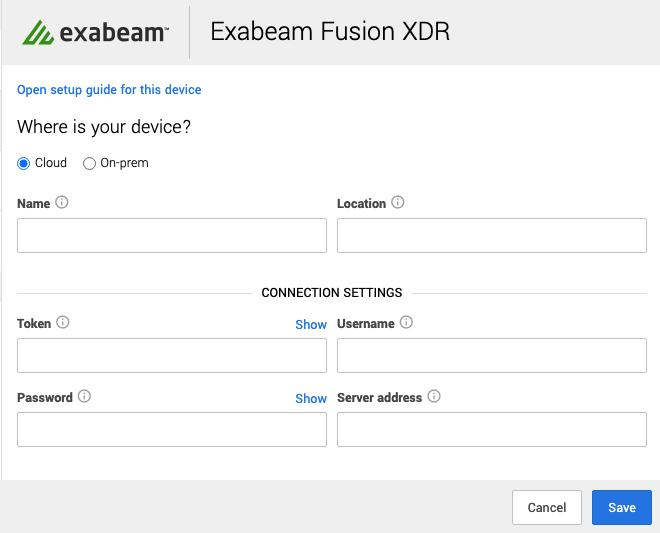
* (On-prem only) Select an Assembler from the list. If you have an assembler, select the assembler you set up in Getting connected to googleWorkbench
* For Name, type a name that's meaningful to you.
* Type the city or site where your Exabeam installation is located for Location.
* Under Connection Settings, for Token type the token you generated in Step 2 and for Server Address type the IP address for Exabeam.
* For Username and Password, type the information you created in Step 1.
3. Click Save.
4. You can provide console access now or set it up later. Use the instructions below to set it up later.
You can see if the device is healthy on the Security Devices page. It may take
a few minutes to see the device listed as healthy.
To check if alerts are coming through, navigate to the Alerts Analysis page.
Scroll to the device you want to check and click View alerts. Switch to grid
view, then check the list for device alerts. It can take 36 to 72 hours for
alerts to appear after setup, as we tune your device.
## Step 4: Edit the device to add console access
Expel needs console access to your device to allow our SOC analysts to dig
deeper during incident investigations. Additionally, our engineering teams use
this access to investigate potential health issues, including proper alert
ingestion.
### Note
Expel secures all login information our SOC analysts need about your devices
in a MFA password product. Access to this login information is protected using
our internal MFA processes. To learn more about the IP addresses all Expel
traffic comes from, go here.
1. Open Workbench. Go to Organization Settings > Security Devices. Next to the device you just connected, click the down arrow and click Edit.
2. In the Console Login area, type these details:
* Console URL: type the console URL from the Server address in the Connection Settings area above. At the end of the URL, type **/login**.
* Username: type the user name you created above.
* Password: type the password you created above.
* Two-factor secret key (32-character code): depending on how your organization enforces log-ins, this field may not apply to you. In these cases, you can leave it blank. This field is optional and if you have questions or concerns, reach out to your engagement manager or to support.
3. Click Save.
### Tip
This article was accurate at the time of writing, but changes happen. If you
find the instructions are outdated, leave a description in the comment field
below and let us know!
|
VMware Carbon Black EDR setup for Workbench | https://support.expel.io/hc/en-us/articles/1500002718961-VMware-Carbon-Black-EDR-setup-for-Workbench | 2021-02-17T20:44:52 | This article explains how to connect VMware Carbon Black EDR to Workbench.
VMWare VMware Carbon Black EDR was formerly called Carbon Black Response.
#### In this article
* Step 1: Enable console access
* Create an admin account
* Verify VMware Carbon Black Live EDR is enabled
* Step 2: Generate API credentials
* Obtain the API key for the Expel account
* Step 3: Enable threat feeds
* Step 4: Configure the technology in Workbench
* Step 5: Edit the device to add console access
## Step 1: Enable console access
This procedure creates a user account for Expel that keeps the Expel activity
separate from other activity on the VMware Carbon Black EDR console.
### Note
Expel secures all login information our SOC analysts need about your devices
in a MFA password product. Access to this login information is protected using
our internal MFA processes. To learn more about the IP addresses all Expel
traffic comes from, go here.
### Create an admin account
1. Navigate to the Users icon on left and click +Add User.
* For Username type expel.
* For First Name type Expel.
* For Last Name type User.
* For Email Address type soc@expel.io.
* Type a Password.
* Assign to: Administrators.
* Select Global administrator. Global administrator is required to perform the necessary functions within VMware Carbon Black EDR for pulling process listings, and so on.
2. Click Save changes.
### Verify VMware Carbon Black Live EDR is enabled
This step allows Expel to interact with your endpoints, for example, pull
process listings, and so on.
1. Click on the Sensors icon on the left side panel and click any host name.
2. In the upper right corner, the button Go Live is active if VMware Carbon Black Live EDR is enabled. If it's active, you are DONE!
3. If VMware Carbon Black Live EDR isn't enabled and is hosted on-prem:
* SSH into the CB appliance and perform the command `vi /etc/cb/cb.conf`.
* Search for `CbLREnabled=False` and change the value from False to True.
* Restart services for the change to take effect: `service cb-enterprise restart`.
4. If VMware Carbon Black Live EDR is not enabled and cloud-hosted:
* Submit a request to the Carbon Black Cloud Support team requesting this feature be enabled. You can simply send the request with the following: “Please enable Live EDR and VDI Behavior”.
## Step 2: Generate API credentials
To integrate the technology with Workbench, we need to create secure
credentials to the API.
This step creates an authentication token that allows the Expel Assembler to
access the VMware Carbon Black EDR API.
### Obtain the API key for the Expel account
1. Log out of the VMware Carbon Black EDR Console.
2. Log back into the VMware Carbon Black EDR Console as the newly-created Expel User.
3. Click Expel User on the upper right, then My Profile, then API Token.
4. Make note of the API token. It's used next for registration within Workbench.
## Step 3: Enable threat feeds
Expel recommends enabling the following Carbon Black threat feeds at a
minimum:
* \+ CB Advanced Threat
* \+ CB Community
* \+ CB Suspicious Feed
* \+ CB Tamper Detection
* \+ CB Early Access
* \+ SANS Feed
* \+ Expel (this feed is added and enabled by Expel)
1. Navigate to the Threat Intelligence icon.
2. Select Enable and the Create Alert options for each of the feeds.
## Step 4: Configure the technology in Workbench
Now that we have the correct access configured and noted the credentials, we
can integrate your tech with Workbench.
1. Login to https://workbench.expel.io/settings/security-devices?setupIntegration=carbon_black.
2. Enter the following information:
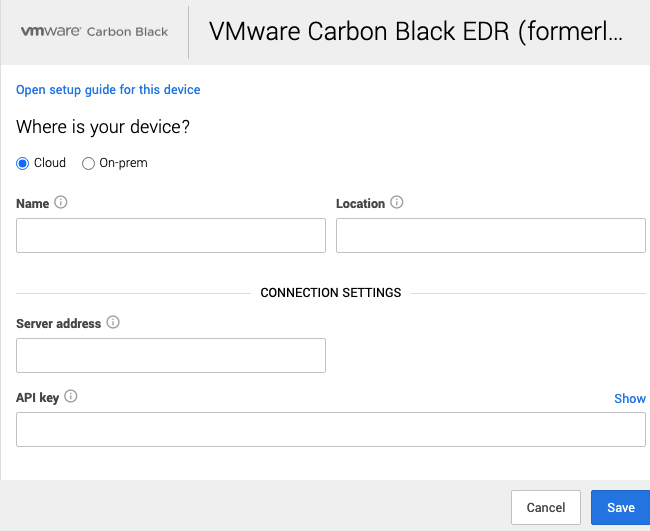
* Select Cloud or On-Prem (on premises) installation.
* For On-Prem installations only, select an Assembler from the list. Select the assembler you set up in Getting connected to Expel Workbench.
* For Name type the hostname of the VMware Carbon Black EDR device.
* For Location type the geographic location of the appliance.
* For Server address type the VMware Carbon Black EDR device IP or hostname in the following format: `https://10.0.0.10 or https://mycbraddress.com`
* For API key type the API generated in Step 2.
3. Click Save.
4. You can provide console access now or set it up later. Use the instructions below to set it up later.
You can see if the device is healthy on the Security Devices page. It may take
a few minutes to see the device listed as healthy.
To check if alerts are coming through, navigate to the Alerts Analysis page.
Scroll to the device you want to check and click View alerts. Switch to grid
view, then check the list for device alerts. It can take 36 to 72 hours for
alerts to appear after setup, as we tune your device.
## Step 5: Edit the device to add console access
Expel needs console access to your device to allow our SOC analysts to dig
deeper during incident investigations. Additionally, our engineering teams use
this access to investigate potential health issues, including proper alert
ingestion.
### Note
Expel secures all login information our SOC analysts need about your devices
in a MFA password product. Access to this login information is protected using
our internal MFA processes. To learn more about the IP addresses all Expel
traffic comes from, go here.
1. Open Workbench. Go to Organization Settings > Security Devices. Next to the device you just connected, click the down arrow and click Edit.
2. In the Console Login area, type these details:
* Console URL: type the console URL from the Server address in the Connection Settings area above. At the end of the URL, type **/login**.
* Username: type the user name you created above.
* Password: type the password you created above.
* Two-factor secret key (32-character code): depending on how your organization enforces log-ins, this field may not apply to you. In these cases, you can leave it blank. This field is optional and if you have questions or concerns, reach out to your engagement manager or to support.
3. Click Save.
### Tip
This article was accurate at the time of writing, but changes happen. If you
find the instructions are outdated, leave a description in the comment field
below and let us know!
|
Attivo through SIEM setup for Workbench | https://support.expel.io/hc/en-us/articles/1500002719001-Attivo-through-SIEM-setup-for-Workbench | 2021-02-17T20:44:59 | This article explains how to connect Attivo to Workbench.
#### In this article
* Step 1: Enable console access
* Step 2: Logging Attivo using Sumo Logic and Splunk
* Step 3: Configure Attivo in Workbench
* Step 4: Edit the device to add console access
## Step 1: Enable console access
Having read-only access to the interface of your technology allows Expel to
dig deeper during incident investigations. Our device health team uses this
access to investigate potential health issues with your tech.
### Note
Expel secures all login information our SOC analysts need about your devices
in a MFA password product. Access to this login information is protected using
our internal MFA processes. To learn more about the IP addresses all Expel
traffic comes from, go here.
1. Administration > User Accounts > Configure.
2. Select +Add from the Users List.
* For User Type select local.
* Select Privileges checkbox for Admin.
* For Username type expelsoc.
* For First Name type Expel.
* For Last Name type SOC.
* Type a Password.
3. Click Save.
### Note
After console access is established, the remaining onboarding steps for this
technology can also be performed by Expel. Reach out to your engagement
manager and we're happy to complete the integration!
## Step 2: Logging Attivo using Sumo Logic and Splunk
Refer to your SIEM documentation or work with your SIEM representative to port
in Attivo logs. You can also refer to the following web references for
creating a new Syslog source:
Sumo Logic: https://help.sumologic.com/docs/send-data/installed-
collectors/sources/syslog-source/
Splunk:
https://docs.splunk.com/Documentation/Splunk/7.0.2/Data/Monitornetworkports
## Step 3: Configure Attivo in Workbench
Now that we have the correct access configured and noted the credentials, we
can integrate your tech with Workbench.
1. In a new browser tab, go to https://workbench.expel.io/settings/security-devices?setupIntegration=attivo.
2. Select the Assembler with network connectivity to the Attivo device. Select the SIEM you created earlier.
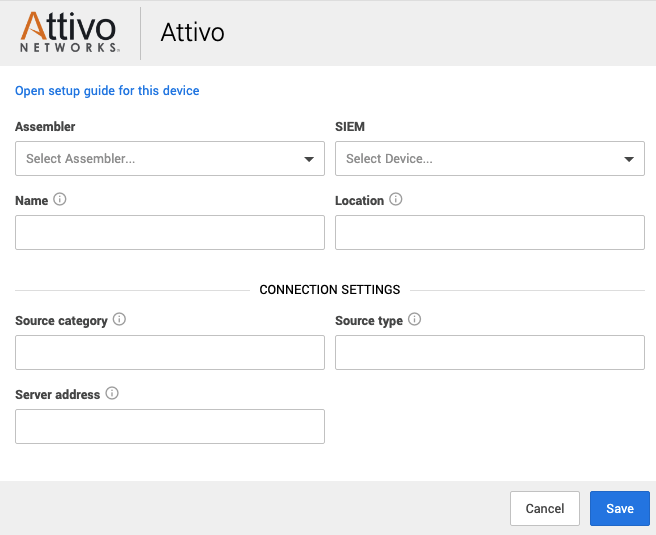
* For Name type the host name of the Attivo device.
* For Location type the geographic location of the appliance.
* For Source Category, type the Sumo Logic source category for this device.
* For Source Type (SIEM that contains the data) type the Splunk source type for this device.
* For Server address type the address of the server for console access.
3. Click Save.
4. You can provide console access now or set it up later. Use the instructions below to set it up later.
You can see if the device is healthy on the Security Devices page. It may take
a few minutes to see the device listed as healthy.
To check if alerts are coming through, navigate to the Alerts Analysis page.
Scroll to the device you want to check and click View alerts. Switch to grid
view, then check the list for device alerts. It can take 36 to 72 hours for
alerts to appear after setup, as we tune your device.
## Step 4: Edit the device to add console access
Expel needs console access to your device to allow our SOC analysts to dig
deeper during incident investigations. Additionally, our engineering teams use
this access to investigate potential health issues, including proper alert
ingestion.
### Note
Expel secures all login information our SOC analysts need about your devices
in a MFA password product. Access to this login information is protected using
our internal MFA processes. To learn more about the IP addresses all Expel
traffic comes from, go here.
1. Open Workbench. Go to Organization Settings > Security Devices. Next to the device you just connected, click the down arrow and click Edit.
2. In the Console Login area, type these details:
* Console URL: type the console URL from the Server address in the Connection Settings area above. At the end of the URL, type **/login**.
* Username: type the user name you created above.
* Password: type the password you created above.
* Two-factor secret key (32-character code): depending on how your organization enforces log-ins, this field may not apply to you. In these cases, you can leave it blank. This field is optional and if you have questions or concerns, reach out to your engagement manager or to support.
3. Click Save.
### Tip
This article was accurate at the time of writing, but changes happen. If you
find the instructions are outdated, leave a description in the comment field
below and let us know!
|
Getting connected to Expel Workbench | https://support.expel.io/hc/en-us/articles/1500002872602-Getting-connected-to-Expel-Workbench | 2021-02-17T20:44:43 | Welcome to Expel. We’re excited to be working with you! We’ve put a lot of
effort into making it as easy as possible to get going. You have 3 basic steps
and this article walks you through each of them.
* Step 1: Get your account set up in Expel Workbench.
* Step 2: Complete configuration steps on your technologies.
* Step 3: Connect your technologies to Expel Workbench.
Three steps. That’s it and you’re ready to go! We’re always looking to make
things easier, so if you see anything along the way that'd make this process
smoother, don’t be shy—let us know!
##### Step 1: Set up your Expel Workbench account
The Expel Workbench is what you use to see everything Expel is doing for you.
Here’s how you get your account set up:
1. Check your inbox. You received a Welcome to Expel email. It includes a link to activate your Expel Workbench account. If you haven’t received the email (or just can’t find it) don’t worry. Just let us know and we’ll send another one over to you right away.
2. Click the Activation button in your welcome email and follow the directions to configure your password and multifactor authentication. You need a multifactor authentication app on your phone or computer to complete creating your account.
### Tip
Bookmark https://workbench.expel.io so you have quick access to Expel
Workbench in the future.
##### Step 2: Configure your technologies
1. In the knowledge base, search for and find the Getting Started Guide for your technology.
2. Complete the steps in the articles.
### Note
Some on-prem technologies require the deployment of an Expel Assembler. For
information on the Expel Assembler, search the knowledge base for the
assembler you're interested in.
##### Step 3: Add your security devices
Follow this procedure on https://workbench.expel.io for each technology to
connect to Expel Workbench:
1. Click the Dashboards link in the upper left. The Welcome to Expel Workbench screen appears. The technology your organization purchased is listed.
2. Click the technology you want to set up.
3. Follow the instructions on the screen.
4. Continue until all your technology is set up.
If your organization purchased additional technology and you want to add it to
Expel Workbench, use the instructions below.
1. Click Organization Settings.
2. Click Security Devices in the left panel.
3. Click the \+ Add Security Device button.
4. Select the type of security device you want to connect.
5. Type a Name and Location that's meaningful to both you and to Expel.
6. Type additional information specific to the security device type.
7. Click Save.
|
Trellix HX Series setup for Workbench | https://support.expel.io/hc/en-us/articles/1500002872642-Trellix-HX-Series-setup-for-Workbench | 2021-02-17T20:44:46 | This article explains how to connect Trellix HX to Workbench.
#### In this article
* Step 1: Enable console access
* Step 2: Generate API credentials
* Step 3: Configure the technology in Workbench
* Step 4: Edit the device to add console access
## Step 1: Enable console access
This procedure creates a user account for Expel that keeps the Expel activity
separate from other activity on the Trellix HX console.
Having read-only access to the interface of your technology allows Expel to
dig deeper during incident investigations. Our device health team uses this
access to investigate potential health issues with your tech.
### Note
Expel secures all login information our SOC analysts need about your devices
in a MFA password product. Access to this login information is protected using
our internal MFA processes. To learn more about the IP addresses all Expel
traffic comes from, go here.
1. Navigate to Admin > Appliance Settings.
2. Click User Accounts on the left.
* For Username add Expel.
* Ensure the Role is set to Admin.
* Type a Password.
3. Click Add User.
## Step 2: Generate API credentials
To integrate the technology with Workbench, we need to create secure
credentials to the API.
This procedure creates an authentication token that allows the Expel Assembler
to access the Trellix HX API.
1. Go to the User Accounts section.
2. For Username add expelapi.
3. Make sure the Role is set to API Admin.
4. Type a Password.
5. Click Add User.
## Step 3: Configure the technology in Workbench
Now that we have the correct access configured and noted the credentials, we
can integrate your tech with Workbench.
1. In a new browser tab, log into https://workbench.expel.io.
2. On the console page, navigate to Settings and click Security Devices.
3. At the top of the page, click Add Security Device.
4. Search for and select Trellix HX.
5. Make the following selections.
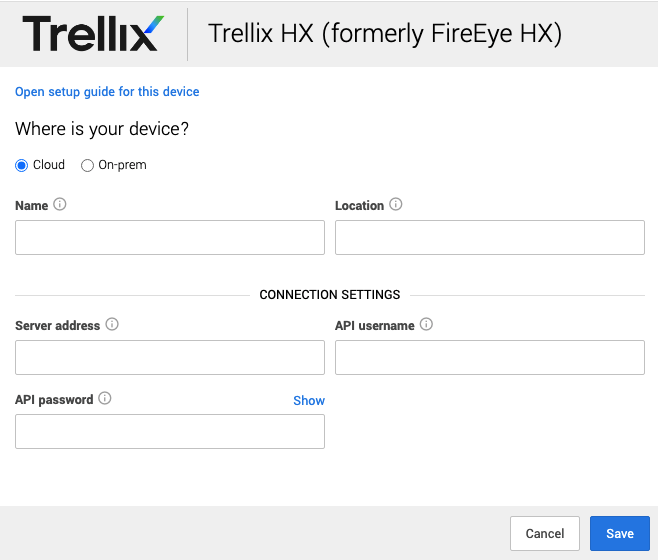
* (On-prem only) Select an Assembler from the list with network connectivity to the Trellix HX device. Select the assembler you set up in Getting connected to Expel Workbench.
* For Name type the host name of the Trellix HX device.
* For Location type the geographic location of the appliance.
* For Server address type the Trellix HX device IP and communications port in the following format: `https://<serverip>:3000`. Find the Device IP in the Trellix HX console > Admin > Appliance Settings > Network.
* For API Password and API Username type the API Admin credentials previously created in the Trellix HX console in Step 2.
6. Click Save.
7. You can provide console access now or set it up later. Use the instructions below to set it up later.
You can see if the device is healthy on the Security Devices page. It may take
a few minutes to see the device listed as healthy.
To check if alerts are coming through, navigate to the Alerts Analysis page.
Scroll to the device you want to check and click View alerts. Switch to grid
view, then check the list for device alerts. It can take 36 to 72 hours for
alerts to appear after setup, as we tune your device.
## Step 4: Edit the device to add console access
Expel needs console access to your device to allow our SOC analysts to dig
deeper during incident investigations. Additionally, our engineering teams use
this access to investigate potential health issues, including proper alert
ingestion.
### Note
Expel secures all login information our SOC analysts need about your devices
in a MFA password product. Access to this login information is protected using
our internal MFA processes. To learn more about the IP addresses all Expel
traffic comes from, go here.
1. Open Workbench. Go to Organization Settings > Security Devices. Next to the device you just connected, click the down arrow and click Edit.
2. In the Console Login area, type these details:
* Console URL: type the console URL from the Server address in the Connection Settings area above. At the end of the URL, type **/login**.
* Username: type the user name you created above.
* Password: type the password you created above.
* Two-factor secret key (32-character code): depending on how your organization enforces log-ins, this field may not apply to you. In these cases, you can leave it blank. This field is optional and if you have questions or concerns, reach out to your engagement manager or to support.
3. Click Save.
### Tip
This article was accurate at the time of writing, but changes happen. If you
find the instructions are outdated, leave a description in the comment field
below and let us know!
#### Related terms
FireEye, FireEye HX, Fire Eye
|
Okta setup for Workbench | https://support.expel.io/hc/en-us/articles/1500002872662-Okta-setup-for-Workbench | 2021-02-17T20:44:46 | This article explains how to connect Okta to Workbench.
#### In this article
* Step 1: Enable console access
* Step 2: Generate API credentials
* Step 3: Configure the technology in Workbench
## Step 1: Enable console access
Having read-only access to the interface of your technology allows Expel to
dig deeper during incident investigations. Our device health team uses this
access to investigate potential health issues with your tech.
1. Create a user in Okta for Expel.
* Select Directory and People.
* Under People select Add person.
* User type: User
* First name: Expel
* Last name: SOC
* Username: soc+<Your_Organization_Name>@expel.io
### Tip
Yes, the "+" sign is part of the email address, and it's important. Click here
to find out why.
* Primary email: same as username
* Password: set by user
* Select Send user activation email now.
* Click Save.
2. Notify your customer success engineer that the registration email is sent.
## Step 2: Generate API credentials
To integrate the technology with Workbench, we need to create secure
credentials to the API.
1. Sign into your Okta organization as a user with Read-Only Admin privileges. API tokens have the same permissions as the user who creates them, and if the user permissions change, the API token permissions also change.
* Okta permissions table:
https://help.okta.com/oie/en-us/Content/Topics/Security/administrators-admin-
comparison.htm
2. Open the API page.
* If you use the Developer Console, select Tokens from the API menu.
* If you use the Administrator Console (Classic UI), select API from the Security menu, and then select Tokens.
3. Click Create Token.
4. Name your token ExpelAPI and click Create Token.
### Note
Make note of your API token, as you only see it 1 time.
5. Collect your Okta URL (also called an Okta domain).
* Sign in to your Okta organization with your administrator account.
* Look for the Okta domain in the upper right corner of the dashboard.
## Step 3: Configure the technology in Workbench
Now that we have the correct access configured and noted the credentials, we
can integrate your tech with Workbench.
1. Log into https://workbench.expel.io.
2. Navigate to Settings > Security Devices.
3. At the top of the page, click Add New Device.
4. Search for and select Okta.
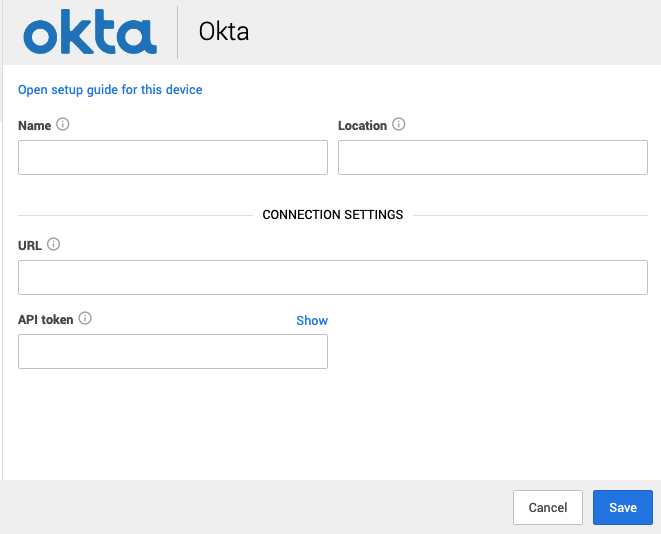
* Complete all fields using the credentials and information you collected in Step 1 and Step 2.
5. Click Save.
You can see if the device is healthy on the Security Devices page. It may take
a few minutes to see the device listed as healthy.
To check if alerts are coming through, navigate to the Alerts Analysis page.
Scroll to the device you want to check and click View alerts. Switch to grid
view, then check the list for device alerts. It can take 36 to 72 hours for
alerts to appear after setup, as we tune your device.
### Tip
This article was accurate at the time of writing, but changes happen. If you
find the instructions are outdated, leave a description in the comment field
below and let us know!
|
Configuring your OneLogin SSO provider with Workbench | https://support.expel.io/hc/en-us/articles/1500002872682-Configuring-your-OneLogin-SSO-provider-with-Workbench | 2021-02-17T20:44:48 | This article explains setting up your OneLogin SSO provider with Expel
Workbench
### Tip
Workbench logins don't support SCIM. We only support SAML and local logins.
1. Log into your OneLogin Console and navigate to Administration in the top right corner.
2. Navigate to Applications > Add App.
3. Search for SAML and select SAML Test Connector (IdP w/attr w/ sign response).
4. Under Portal:
* Display Name: Expel Workbench.
* Upload our logo and click Save. You can right-click this image and save it locally.

* Click Save.
5. Select Configuration in the left navigation.
6. Copy information from Expel Workbench to complete the integration. Open a new tab or window and log in to Expel Workbench (https://workbench.expel.io).
7. Navigate to Organization Settings > My Organizations and select the organization. Then click Integrations > Configure SSO.
8. Copy and paste the following from Expel Workbench into OneLogin.
* ACS URL or Single Sign-on URL → ACS (Consumer) URL.
* Audience URI or Audience → Audience.
* ACS URI Validator → ACS (Consumer) URI Validator.
* Leave Yes, allow users to log in locally OR via SSO selected for local logins. This makes initial SSO setup easier. You can change this later.
9. In Expel Workbench, click Next.
* Select Parameters from the left navigation.
* Click the “+” button on the left to add a new parameter.
* For Field name type the word email and select Include SAML assertion. Click Save.
10. In OneLogin, click Save in the upper right corner.
* For Value, select Email from the list and click Save.
11. Navigate to SSO in the left navigation.
12. Right-click and open in a new tab or window View Details under the X.509 Certificate.
13. Copy and paste the X.509 Certificate from OneLogin into Expel Workbench.
14. Back in the SSO window, copy and paste the following from OneLogin into Expel Workbench.
* SAML 2.0 Endpoint (HTTP)→ Single Sign-On URL or SAML 2.0 Endpoint.
* Issuer URL → Issuer or Issuer ID.
15. Click Save in Expel Workbench.
16. Click Save in OneLogin.
### Important
Before signing in with SSO, make sure that:
* In your SSO provider, Workbench is assigned to all intended users.
* The user email addresses in your SSO provider match the email that's configured for the users in Workbench. The emails are case sensitive.
* New members of your organization that need access to Workbench have user accounts created in Workbench and have Workbench assigned to them in your Identity Provider.
* After you finish testing and setting up, in Workbench, you can disable local logins by going to the Integrations area in Settings. Click Edit from the list, and click No, users can ONLY log in via SSO. Then click Next > Next > Save to save.
|
Splunk setup for Workbench | https://support.expel.io/hc/en-us/articles/1500002872702-Splunk-setup-for-Workbench | 2021-02-17T20:44:48 | By following these steps, you create a user account for Expel that keeps the
Expel activity separate from other activity on the Splunk console.
### Note
Expel needs access to the Splunk device or instance through port 8000 (UI) and
8089 (API). For cloud instances, follow the Splunk Configure IP Allow List
instructions to grant Expel these access privileges:
* Search head API access
* Search head UI access
Expel has 6 egress IP addresses. All requests to rest API come from 1 of 6 IP
addresses. We’ve designed this so it can scale significantly without Expel
needing to add new IP addresses to the list.
* 34.75.13.114/32
* 34.75.152.7/32
* 35.243.190.98/32
* 104.196.158.205/32
* 34.75.81.28/32
* 34.75.210.18/32
#### In this article
* Step 1: Enable console access
* Step 2: Configure the technology in Workbench
* Step 3: Edit the device to add console access
## Step 1: Enable console access
Having read-only access to the interface of your technology allows Expel to
dig deeper during incident investigations. Our device health team uses this
access to investigate potential health issues with your tech.
### Note
Expel secures all login information our SOC analysts need about your devices
in a MFA password product. Access to this login information is protected using
our internal MFA processes. To learn more about the IP addresses all Expel
traffic comes from, go here.
1. Log into Splunk.
2. Navigate to Settings > Access Controls > Users.
3. Click the +Add new button.
4. Fill in the following information:
* For Name type Expel.
* For Full name type Expel SOC.
* For Email address type soc@expel.io.
* Set the Password.
* For Time Zone select GMT (or UTC).
* For Assign roles select User.
* Clear Require password change on first login.
5. Click Save.
### Tip
After console access is established for Expel, the remaining onboarding steps
for this technology can also be performed by Expel. Reach out to your
engagement manager if this is needed and we're happy to complete the
integration!
## Step 2: Configure the technology in Workbench
Now that we have the correct access configured and noted the credentials, we
can integrate your tech with Workbench.
1. Go to https://workbench.expel.io/settings/security-devices?setupIntegration=splunk.
2. If your installation is on premises ( **On-prem** ), then select the Assembler connected to the Splunk device. This is the assembler you set up in How to provision Expel Assembler.
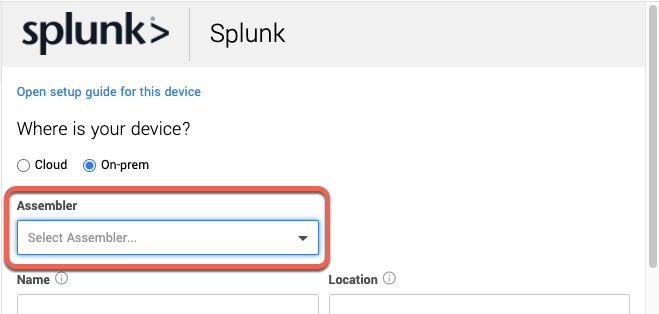
3. Fill in the following information:
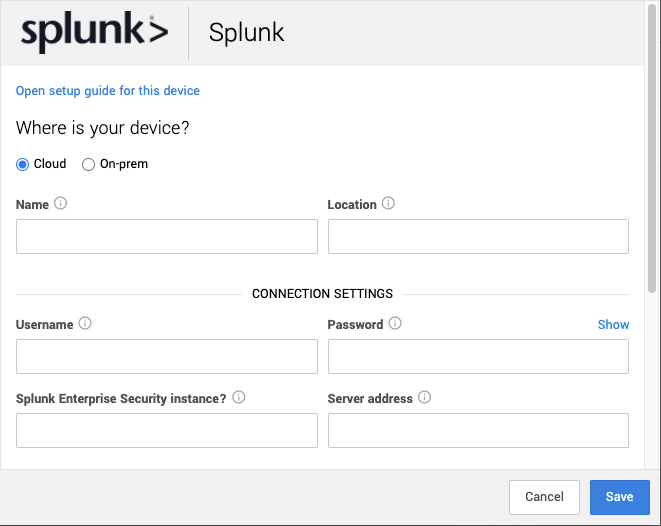
* Name: the hostname of the Splunk device.
* Location: the geographic location of the appliance.
* Username: the username created in Step 1.
* Password: the password created in Step 1.
* Leave the Splunk Enterprise Security instance? field blank.
### Note
Integration_Vendors: Splunk Enterprise Security alerts require review by Expel
before enabling. Reach out to your engagement manager for details.
* Server address:
* Cloud: type the Splunk server address and port 8089. For example: https://<domainname>.splunkcloud.com:8089.
* On-prem: type the Splunk console IP address and port 8089. For example: https://10.10.10.10:8089/.
4. Click Save.
5. You can provide console access now or set it up later. Use the instructions below to set it up later.
You can see if the device is healthy on the Security Devices page. It may take
a few minutes to see the device listed as healthy.
To check if alerts are coming through, navigate to the Alerts Analysis page.
Scroll to the device you want to check and click View alerts. Switch to grid
view, then check the list for device alerts. It can take 36 to 72 hours for
alerts to appear after setup, as we tune your device.
## Step 3: Edit the device to add console access
Expel needs console access to your device to allow our SOC analysts to dig
deeper during incident investigations. Additionally, our engineering teams use
this access to investigate potential health issues, including proper alert
ingestion.
### Note
Expel secures all login information our SOC analysts need about your devices
in a MFA password product. Access to this login information is protected using
our internal MFA processes. To learn more about the IP addresses all Expel
traffic comes from, go here.
1. Open Workbench. Go to Organization Settings > Security Devices. Next to the device you just connected, click the down arrow and click Edit.
2. In the Console Login area, type these details:
* Console URL: type the console URL from the Server address in the Connection Settings area above. At the end of the URL, type **/login**.
* Username: type the user name you created above.
* Password: type the password you created above.
* Two-factor secret key (32-character code): depending on how your organization enforces log-ins, this field may not apply to you. In these cases, you can leave it blank. This field is optional and if you have questions or concerns, reach out to your engagement manager or to support.
3. Click Save.
### Tip
This article was accurate at the time of writing, but changes happen. If you
find the instructions are outdated, leave a description in the comment field
below and let us know!
|
Elastic Endpoint Security (formerly Endgame) setup for Workbench | https://support.expel.io/hc/en-us/articles/1500002872722-Elastic-Endpoint-Security-formerly-Endgame-setup-for-Workbench | 2021-02-17T20:44:50 | This article explains how to connect Elastic Endpoint Security to Workbench.
#### In this article
* Step 1: Enable console access
* Step 2: Configure the technology in Workbench
* Step 3: Edit the device to add console access
## Step 1: Enable console access
Having read-only access to the interface of your technology allows Expel to
dig deeper during incident investigations. Our device health team uses this
access to investigate potential health issues with your tech.
This procedure creates a user account for Expel that keeps the Expel activity
separate from other activity on the Elastic Endpoint Security console.
### Note
Expel secures all login information our SOC analysts need about your devices
in a MFA password product. Access to this login information is protected using
our internal MFA processes. To learn more about the IP addresses all Expel
traffic comes from, go here.
1. Navigate to Administration icon on the left, click Users tab, and click Create New User.
2. For First name add Expel.
* For Last name type Admin.
* For Username type Expel.
* For User Role select Admin.
### Note
You can select LEVEL 3 access here, although Expel can't view security
policies for the device to advise on best practices and configuration.
Detection remains unaffected.
* Create a Password for Expel.
3. Click Create User.
### Tip
After console access is established for Workbench, the remaining onboarding
steps for this technology can also be performed by Expel. Reach out to your
engagement manager if you want us to help.
## Step 2: Configure the technology in Workbench
Now that we have the correct access configured and noted the credentials, we
can integrate your tech with Workbench.
1. In a new browser tab, log into https://workbench.expel.io.
2. On the console page, navigate to Settings and click Security Devices.
3. At the upper right of the page, select Add Security Device.
4. Search for and select Endgame.

---
5. Select Cloud or On-prem.

* Select the assembler from the list. (On-prem only)
* For Name, type the host name of the Elastic Endpoint Security device.
* For Location, type the geographic location of the appliance.
* For Username, type Expel from Step 1.
* For Password, type the password used in Step 1.
* For Server address, type the management/console IP address of the device to be connected through https. For example: https://127.0.0.1.
* For File unzip password, type the password to unzip the acquired file. If you don't type a password here, the default Endgame password is used.
* For Acknowledge alerts, select yes to mark Endgame alerts as _viewed_ after Workbench processes them.
* For Dismiss alerts, select yes to mark Endgame alerts as _dismissed_ after Workbench processes them.
6. Click Save.
7. You can provide console access now or set it up later. Use the instructions below to set it up later.
You can see if the device is healthy on the Security Devices page. It may take
a few minutes to see the device listed as healthy.
To check if alerts are coming through, navigate to the Alerts Analysis page.
Scroll to the device you want to check and click View alerts. Switch to grid
view, then check the list for device alerts. It can take 36 to 72 hours for
alerts to appear after setup, as we tune your device.
## Step 3: Edit the device to add console access
Expel needs console access to your device to allow our SOC analysts to dig
deeper during incident investigations. Additionally, our engineering teams use
this access to investigate potential health issues, including proper alert
ingestion.
### Note
Expel secures all login information our SOC analysts need about your devices
in a MFA password product. Access to this login information is protected using
our internal MFA processes. To learn more about the IP addresses all Expel
traffic comes from, go here.
1. Open Workbench. Go to Organization Settings > Security Devices. Next to the device you just connected, click the down arrow and click Edit.
2. In the Console Login area, type these details:
* Console URL: type the console URL from the Server address in the Connection Settings area above. At the end of the URL, type **/login**.
* Username: type the user name you created above.
* Password: type the password you created above.
* Two-factor secret key (32-character code): depending on how your organization enforces log-ins, this field may not apply to you. In these cases, you can leave it blank. This field is optional and if you have questions or concerns, reach out to your engagement manager or to support.
3. Click Save.
### Tip
This article was accurate at the time of writing, but changes happen. If you
find the instructions are outdated, leave a description in the comment field
below and let us know!
#### Related terms
endgame
|
Darktrace direct setup for Workbench | https://support.expel.io/hc/en-us/articles/1500002872742-Darktrace-direct-setup-for-Workbench | 2021-02-17T20:44:51 | Darktrace is an Intrusion Detection Device (IDS) that leverages machine
learning to detect emerging threats, including insider threats, low-and-slow
attacks, and automated viruses.
#### In this article
* Step 1: Enable console access
* Step 2: Generate API credentials
* Step 3: Configure the technology in Workbench
* Step 4: Edit the device to add console access
## Step 1: Enable console access
Expel requires a Darktrace user account to review Alerts and Models within the
console.
Having read-only access to the interface of your technology allows Expel to
dig deeper during incident investigations. Our device health team uses this
access to investigate potential health issues with your tech.
### Note
Expel secures all login information our SOC analysts need about your devices
in a MFA password product. Access to this login information is protected using
our internal MFA processes. To learn more about the IP addresses all Expel
traffic comes from, go here.
1. From the menu located at the top left, select Add New User.
2. Username: Expel.
3. Password: set a temporary password — this is changed on initial login.
4. Account Permissions: select all available permissions, except User Admin or Group Admin. These can be left cleared.
5. Click OK.
## Step 2: Generate API credentials
To integrate the technology with Workbench, we need to create secure
credentials to the API.
### Note
Expel secures all login information our SOC analysts need about your devices
in a MFA password product. Access to this login information is protected using
our internal MFA processes. To learn more about the IP addresses all Expel
traffic comes from, go here.
1. Log into the Darktrace console.
2. Navigate to Admin > System Config.
3. Near the bottom of the page, under API Token, click New.
4. The Darktrace system generates a Token and a Private Token. The Private Token can only be seen 1 time after the token pair is initially generated. Make note of the tokens for onboarding in Workbench. The system can only have 1 token pair, so if one already exists and you don't have a record of this, you must generate another token pair.
### Caution
If a replacement Token pair is generated, other clients using the API must be
reconfigured with the new credentials.
## Step 3: Configure the technology in Workbench
Now that we have the correct access configured and noted the credentials, we
can integrate your tech with Workbench.
1. In a new browser tab, login to https://workbench.expel.io.
2. On the console page, click Settings and click Security Devices.
3. At the top of the page, click Add Security Device.
4. Search for and select your technology.
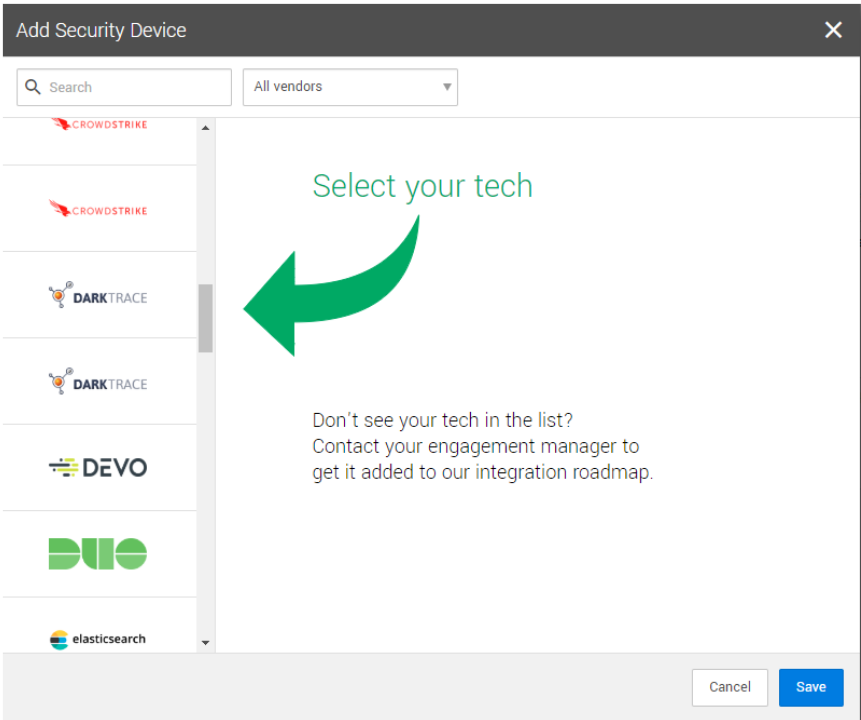
5. Select an Assembler from the list. Select the assembler you set up in Getting connected to Expel Workbench.
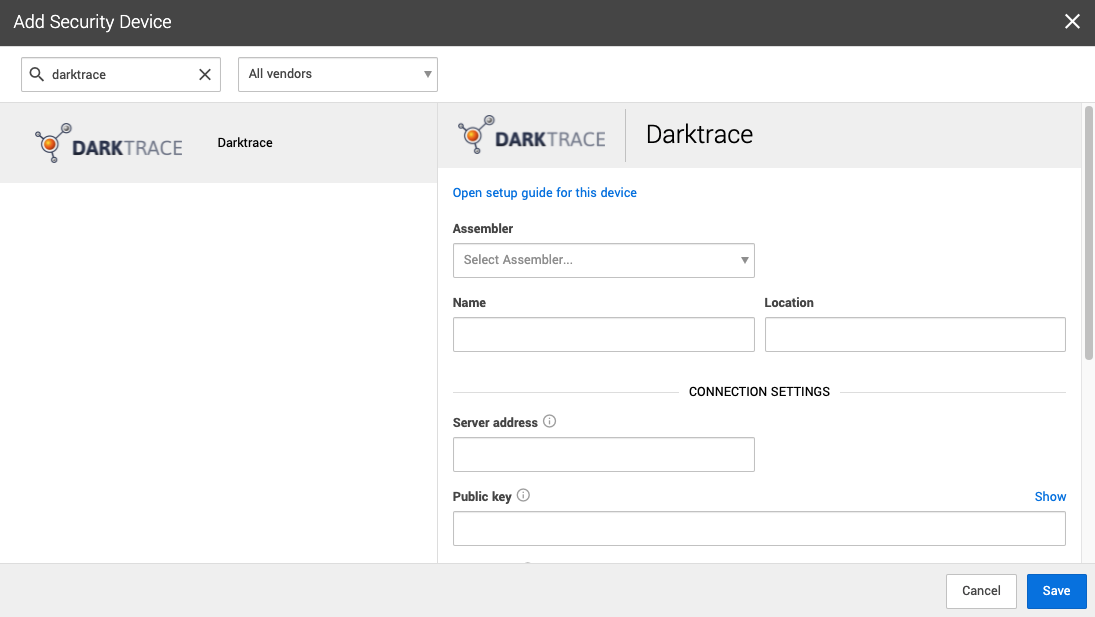
* Type Name and Location.
* For Server address, type the server address of the vendor’s server, which must include the port. For example: https://127.0.0.1:443 or myvendordevice.acme.com:443.
* For Public key, type the API token used to authenticate to the device from Step 2.
* For Private key, type the private token used to authenticate to the device from Step 2.
6. Click Save.
7. You can provide console access now or set it up later. Use the instructions below to set it up later.
You can see if the device is healthy on the Security Devices page. It may take
a few minutes to see the device listed as healthy.
To check if alerts are coming through, navigate to the Alerts Analysis page.
Scroll to the device you want to check and click View alerts. Switch to grid
view, then check the list for device alerts. It can take 36 to 72 hours for
alerts to appear after setup, as we tune your device.
## Step 4: Edit the device to add console access
Expel needs console access to your device to allow our SOC analysts to dig
deeper during incident investigations. Additionally, our engineering teams use
this access to investigate potential health issues, including proper alert
ingestion.
### Note
Expel secures all login information our SOC analysts need about your devices
in a MFA password product. Access to this login information is protected using
our internal MFA processes. To learn more about the IP addresses all Expel
traffic comes from, go here.
1. Open Workbench. Go to Organization Settings > Security Devices. Next to the device you just connected, click the down arrow and click Edit.
2. In the Console Login area, type these details:
* Console URL: type the console URL from the Server address in the Connection Settings area above. At the end of the URL, type **/login**.
* Username: type the user name you created above.
* Password: type the password you created above.
* Two-factor secret key (32-character code): depending on how your organization enforces log-ins, this field may not apply to you. In these cases, you can leave it blank. This field is optional and if you have questions or concerns, reach out to your engagement manager or to support.
3. Click Save.
### Tip
This article was accurate at the time of writing, but changes happen. If you
find the instructions are outdated, leave a description in the comment field
below and let us know!
|
End of preview. Expand
in Dataset Viewer.
- Downloads last month
- 0