
HCSA Field Plot Data
Collection
1 item
•
Updated
• Title: High Carbon Stock Approach (HCSA) Forest Plot Data 2023 • Description: This dataset contains information of forest field plot inventory data collected using the High Carbon Stock Approach (HCSA) methodology. This data was collected to provide validation and training data for large scale indicative HCS forest maps produced with the HCSA Largescale Mapping Framework (https://highcarbonstock.org/wp-content/uploads/2023/02/HCSA-Large-Scale-MAP-FWK-Procedure-1.pdf) under a project funded by the GIZ Fair Forward Initiative • The data includes various parameters related to land cover, carbon content, tree characteristics, and biomass calculations.
• Region: The province in Indonesia where the data was collected.
• X Coordinate: The horizontal position of the plot – WGS 84
• Y Coordinate: The vertical position of the plot – WGS 84
• Land Cover Update: Updated HCS forest class from plot Carbon stock
• Land Cover Indicatives: Indicative HCS forest class from Lang et al., 2021 https://arxiv.org/abs/2107.07431
• Carbon (ton/ha): Carbon content per hectare in the forest field plot.
• Plot Area (Ha): The total area covered by the forest field plot in hectares (See method figure)
• Tree Number: ID of the individual trees in the plot
• DBH (cm): Diameter at Breast Height, measured in centimeters.
• Height (cm): The height of the trees measured in centimeters.
• Height (m): The height of the trees converted to meters.
• Local Name: Common name or local name of the tree species.
• Scientific Name: The scientific name of the tree species.
• Family: Taxonomic family to which the tree species belongs.
• Wood Density (g/cm3): The density of wood in grams per cubic centimeter - (Ketterings et. al, 2001 https://apps.worldagroforestry.org/sea/Products/AFDbases/WD/Index.htm
• Biomass (kg)/pohon: Biomass per tree measured in kilograms (Chave et. al, 2014 https://doi.org/10.1111/gcb.12629).
• Biomass (ton)/pohon: Biomass per tree converted to metric tons.
• Biomass (ton/ha): Total biomass per hectare calculated from the field plot.
• High Carbon Stock Approach (HCSA): The dataset contains forest field plot data collected following the HCSA methodology, a widely recognized approach for assessing and managing forest carbon stocks. A more detailed description of HCSA forest inventory methods can be found in the HCSA Toolkit Module 4 (https://highcarbonstock.org/wp-content/uploads/2017/09/HCSA-Toolkit-v2.0-Module-4-Forest-and-vegetation-stratification-190917-web.pdf).
• Purpose: The dataset is intended for research and analysis related to forest ecology, carbon sequestration, and biodiversity. • Citation: If used in publications or research, please cite the dataset as follows: High Carbon Stock Approach (2023). Forest Field Plot Data for Indicative HCS Mapping, Indonesia.
This data is intended to support identification of indicative HCS forests for HCSA Landscape and Jurisdictional approach implementation, for Smallholder Approaches, or a preliminary step in an HCS assessment process.
This dataset is not to be used for: Sale of carbon credits on community lands without proper FPIC, consent, and mapping exercises. Indicative HCS forest maps are probability maps and do not represent HCS Assessments or final maps from implementation of the HCS Landscape and Jurisdicional Approaches methodologies.
This dataset contains a .csv file of field plot data
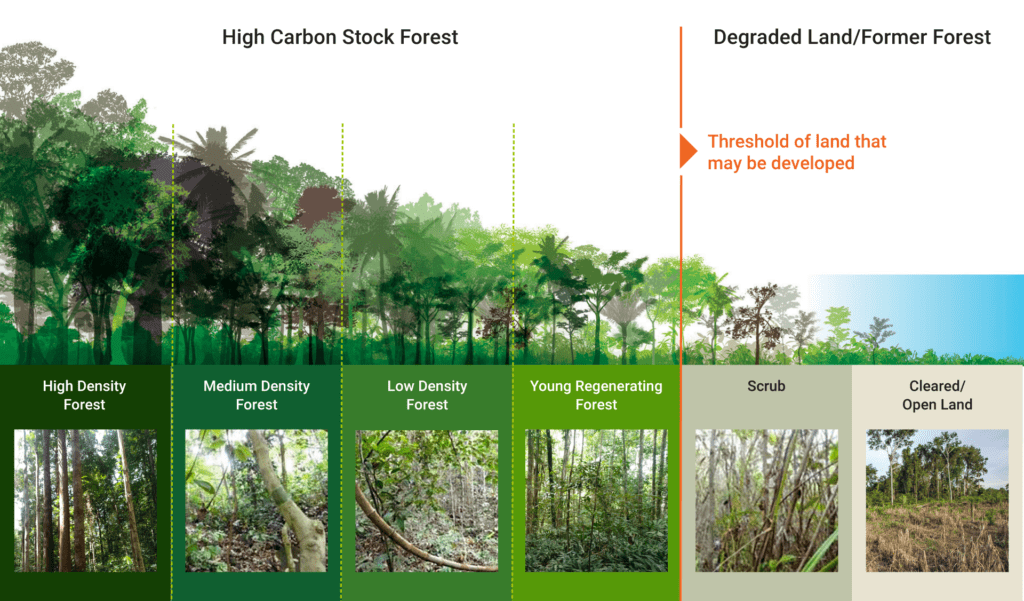
The High Carbon Stock Approach (HCSA) core mission is to halt deforestation resulting from commodity production. It is a tool that identifies and conserves natural forests from degraded lands in tropical landscapes, amplifying the role of forest conservation as a nature-based solution to climate change, while at the same time supporting biodiversity conservation, community rights and benefits, and responsible development. To understand the distribution of High Carbon Stock (HCS) forests throughout the landscape and work to protect them in collaboration with smallholder farmers, communities, as well as local and national governments, it is necessary to accurately map these resources in a regional and national scale. Field plot data is an essential step in landscape and jurisdictional implementation of HCS for commodities including Palm Oil, Rubber, and Cocoa. Developing large scale (country to continent wide) indicative HCS forest maps is valuable for several reasons:
First, the identification and classification of HCS forests plays a major role in prioritizing and guiding conservation efforts. Not all forests have the same carbon stock potential. Carbon stock-based forest classification directs attention to high carbon levels, which have the potential to make a contribution to climate change mitigation when conserved.
Second, data collection serves as a valuable source of knowledge to inform the decision-making process. This information contains sustainable land use management and spatial planning in land use prior to land status confirmation, environmental policy formulation, and promoting green economy strategies. The data directs details of carbon stocks, biological diversity, and socio-cultural impacts on the area, and facilitates data-driven policies for digital transformation.
Third, the focus on HCS forests synergizes with Indonesia's commitment to reduce the emission rate of greenhouse gases, as in strategic plans such as the RPJMN and PRJPP. This commitment is in line with the common goal of the Paris Agreement.
• High Carbon Stock Approach (HCSA): The dataset is collected following the HCSA methodology, a widely recognized approach for assessing and managing forest carbon stocks. A more detailed description of HCSA forest inventory methods can be found in the HCSA Toolkit Module 4 (https://highcarbonstock.org/wp-content/uploads/2017/09/HCSA-Toolkit-v2.0-Module-4-Forest-and-vegetation-stratification-190917-web.pdf).
• Data Collection Methods: Data was collected in partnership with JKPP (https://jkpp.org/), and Indonesian civil society organization focusing on community land rights and mapping. Field Plot locations were identified in advance using GIS software. Transect start points are normally located at convenient positions along roads, rivers, canals or other access routes. The distance between plots is generally dictated by the scale of the study area. Where large forest areas are being sampled and inventory planners seek broader coverage, this distance will be increased. The distance between plots is usually either 75 m or 100 m, but there is no fixed rule (Figure 2)
The same kind of plot is used for random, systematic and transect sampling. The recommended sample plot design is two concentric circles from a centre point with a total area of 500 m 2 or 0.05 ha. Circular plots are preferred to rectangular plots because they minimize the potential for error caused by slope factors and physical obstacles that may skew plot boundary lines.
The focus of vegetation measurement is on large plant species, which usually comprise the large majority of AGB. Other forest carbon pools are not measured because they are either relatively small in size (e.g. forest understory) and do not store much carbon, or are difficult and expensive to assess (e.g. below-ground biomass, deadwood and soil organic matter). Large plant species are defined as those having a diameter at breast height (DBH) greater than or equal to 5 cm. This includes both tree and non-tree species. Breast height for the DBH measurement is defined as 1.3 metres.
Large plant species (referred to as ‘trees’ for simplicity, but also including non-tree species such as some palms) are measured using the following steps:
1. Identification of ‘in’ trees: A tree is defined as an ‘in’ tree if the centre of its stem at DBH is within the boundaries of the plot. Trees on the edge of the plot (borderline trees) must be checked using a nylon rope marked at the correct plot radii (see Figure 12).
2. Flagging tape: Each tree is labelled with flagging tape. The label must indicate the tree number as recorded in the field book.
3. DBH measurement: All trees greater or equal to 15 cm (forest inventory plot) DBH shall be measured in the large plot. In addition to the large trees, all trees greater than or equal to 5 cm (forest inventory plot) and less than 15 cm (forest inventory plot) DBH shall be measured in the small plot (see Figure 13).
4. Height measurement: Depending on the eventual allometric equation used, it may also be necessary to measure total tree heights. Tree heights were measured with the Nikon Forestry Pro II Laser Rangefinder/Hypsometer. These calculate height automatically based on readings taken to the top and bottom of the tree, plus, in some cases, a reading of horizontal distance. Once the user is familiar with their mode of operation, these meters are practical to use and measurements can be carried out by one person (usually the team leader). Height measurement with clinometers is also possible but tends to be slow and more prone to error. Where allometrics require an estimate of total tree height, there are two options for generation of height data: measuring a subset of trees and then deriving a diameter-tree height regression from the measured trees, or direct measurement of all trees.
5. Species: All trees measured in the plot must be identified to genus level and preferably to species level. This information is needed in the allometric equation, and to be able to describe forest composition and structure in a general way. As stated previously, botanists should be part of the field team; local names can be noted in the field book and translated to species names later on. If a genus cannot be identified, photographs and botanical samples must be collected and marked so that experts can identify them later.
Data processing involves using lookup tables to determine specific tree wood density and using the allometric equation from Chave et al (2014) to convert to biomass, and from biomass/plot to biomass/ha (see Chave, Jérôme, et al. "Improved allometric models to estimate the aboveground biomass of tropical trees." Global change biology 20.10 (2014): 3177-3190.)


This data was collected by field teams from JKPP (https://jkpp.org/). Field teams consisted of a team lead, a botanist, and usually 3-5 other members trained in the use of forest measurement tools and methods by JKPP. Teams were not composed of professional foresters but did attend a training in collection techniques before going into the field.
This data does not contain personally identifiable information
Additional field plot data collected using this methodology can be done using the High Carbon Stock Approach Field Data Collection forms in the ODK app.