Interactively explore your Huggingface dataset with one line of code


The Hugging Face datasets library not only provides access to more than 70k publicly available datasets, but also offers very convenient data preparation pipelines for custom datasets.
Renumics Spotlight allows you to create interactive visualizations to identify critical clusters in your data. Because Spotlight understands the data semantics within Hugging Face datasets, you can get started with just one line of code:
import datasets
from renumics import spotlight

ds = datasets.load_dataset('speech_commands', 'v0.01', split='validation')

spotlight.show(ds)
Spotlight allows to leverage model results such as predictions and embeddings to gain a deeper understanding in data segments and model failure modes:
ds_results = datasets.load_dataset('renumics/speech_commands-ast-finetuned-results', 'v0.01', split='validation')
ds = datasets.concatenate_datasets([ds, ds_results], axis=1)

spotlight.show(ds, dtype={'embedding': spotlight.Embedding}, layout=spotlight.layouts.debug_classification(embedding='embedding', inspect={'audio': spotlight.dtypes.audio_dtype}))
Data inspection is a very important task in almost all ML development stages, but it can also be very time consuming.
“Manual inspection of data has probably the highest value-to-prestige ratio of any activity in machine learning.” — Greg Brockman
Spotlight helps you to make data inspection more scalable along two dimensions: Setting up and maintaining custom data inspection workflows and finding relevant data samples and clusters to inspect. In the following sections we show some examples based on Hugging Face datasets.
Spotlight 🤝 Hugging Face datasets
The datasets library has several features that makes it an ideal tool for working with ML datasets: It stores tabular data (e.g. metadata, labels) along with unstructured data (e.g. images, audio) in a common Arrows table. Datasets also describes important data semantics through features (e.g. images, audio) and additional task-specific metadata.
Spotlight directly works on top of the datasets library. This means that there is no need to copy or pre-process the dataset for data visualization and inspection. Spotlight loads the tabular data into memory to allow for efficient, client-side data analytics. Memory-intensive unstructured data samples (e.g. audio, images, video) are loaded lazily on demand. In most cases, data types and label mappings are inferred directly from the dataset. Here, we visualize the CIFAR-100 dataset with one line of code:
ds = datasets.load_dataset('cifar100', split='test')
spotlight.show(ds)
In cases where the data types are ambiguous or not specified, the Spotlight API allows to manually assign them:
label_mapping = dict(zip(ds.features['fine_label'].names, range(len(ds.features['fine_label'].names))))
spotlight.show(ds, dtype={'img': spotlight.Image, 'fine_label': spotlight.dtypes.CategoryDType(categories=label_mapping)})
Leveraging model results for data inspection
Exploring raw unstructured datasets often yield little insights. Leveraging model results such as predictions or embeddings can help to uncover critical data samples and clusters. Spotlight has several visualization options (e.g. similarity map, confusion matrix) that specifically make use of model results.
We recommend storing your prediction results directly in a Hugging Face dataset. This not only allows you to take advantage of the batch processing capabilities of the datasets library, but also keeps label mappings.
We can use the transformers library to compute embeddings and predictions on the CIFAR-100 image classification problem. We install the libraries via pip:
pip install renumics-spotlight datasets transformers[torch]
Now we can compute the enrichment:
import torch
import transformers

device = torch.device("cuda:0" if torch.cuda.is_available() else "cpu")
model_name = "Ahmed9275/Vit-Cifar100"
processor = transformers.ViTImageProcessor.from_pretrained(model_name)
cls_model = transformers.ViTForImageClassification.from_pretrained(model_name).to(device)
fe_model = transformers.ViTModel.from_pretrained(model_name).to(device)

def infer(batch):
    images = [image.convert("RGB") for image in batch]
    inputs = processor(images=images, return_tensors="pt").to(device)
    with torch.no_grad():
        outputs = cls_model(**inputs)
        probs = torch.nn.functional.softmax(outputs.logits, dim=-1).cpu().numpy()
        embeddings = fe_model(**inputs).last_hidden_state[:, 0].cpu().numpy()
    preds = probs.argmax(axis=-1)
    return {"prediction": preds, "embedding": embeddings}

features = datasets.Features({**ds.features, "prediction": ds.features["fine_label"], "embedding": datasets.Sequence(feature=datasets.Value("float32"), length=768)})
ds_enriched = ds.map(infer, input_columns="img", batched=True, batch_size=2, features=features)
If you don’t want to perform the full inference run, you can alternatively download pre-computed model results for CIFAR-100 to follow this tutorial:
ds_results = datasets.load_dataset('renumics/spotlight-cifar100-enrichment', split='test')
ds_enriched = datasets.concatenate_datasets([ds, ds_results], axis=1)
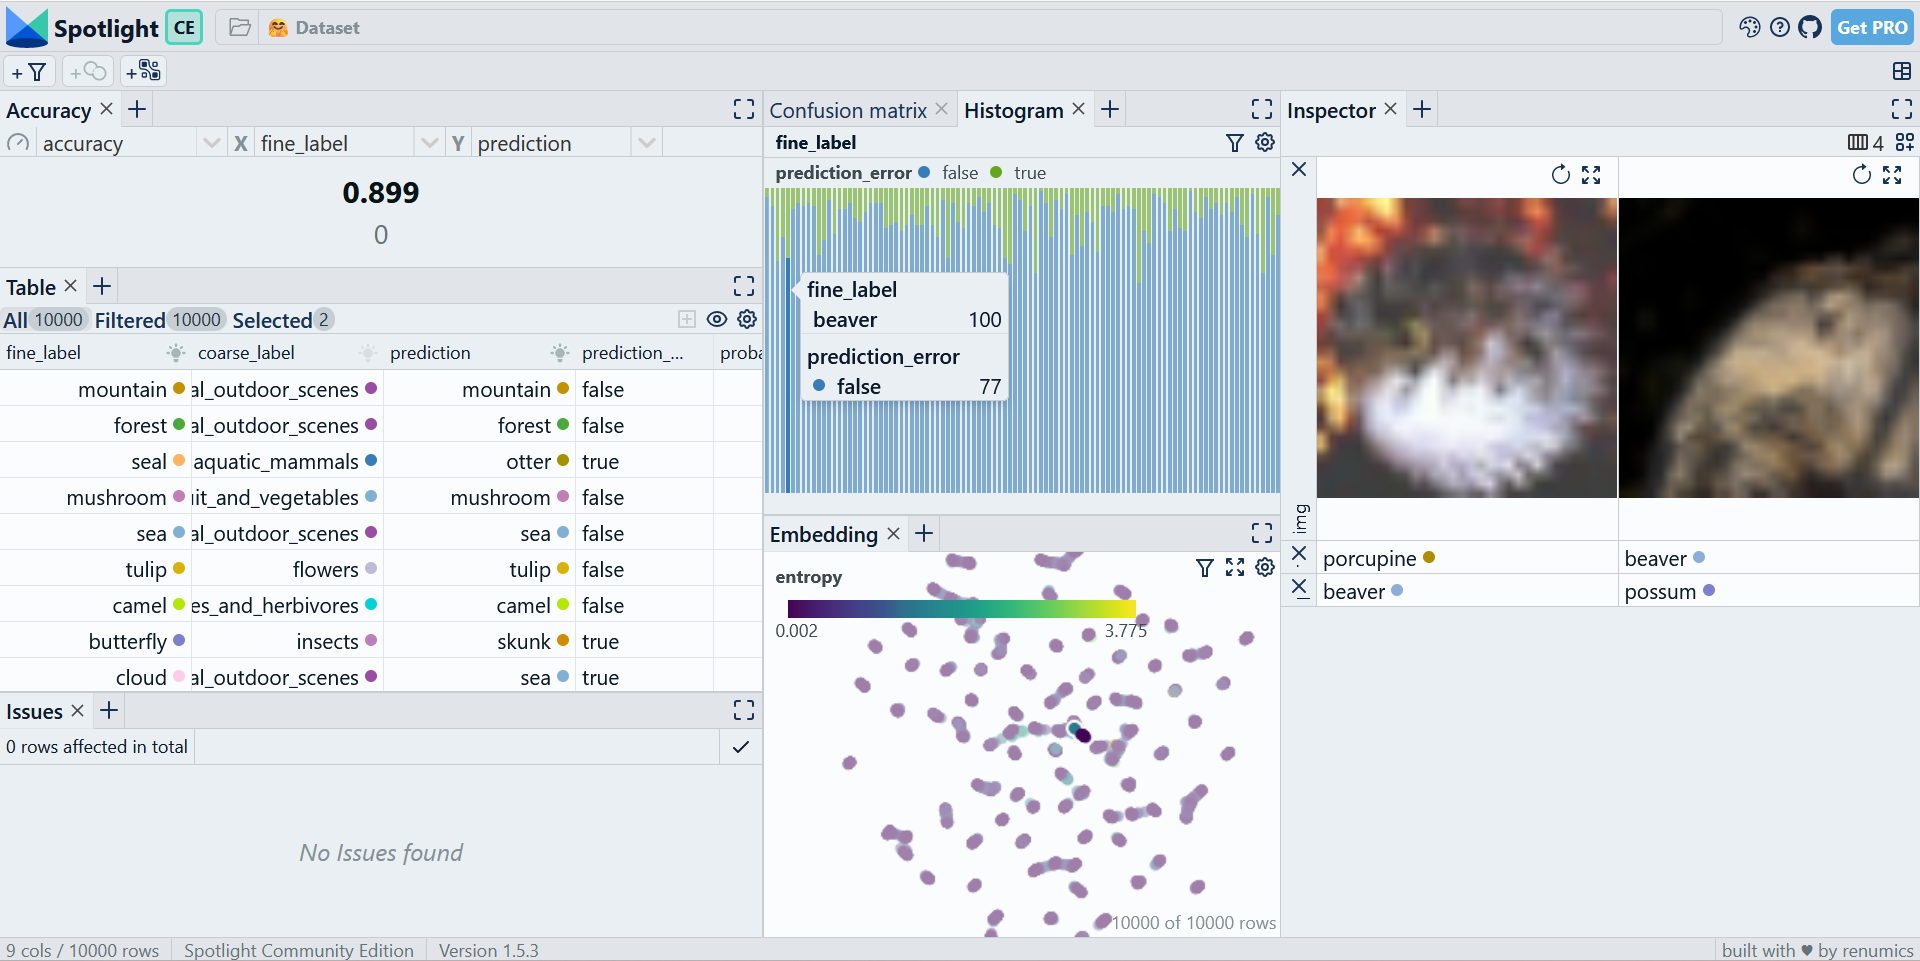
We can now use the results to interactively explore relevant data samples and clusters in Spotlight:
layout = spotlight.layouts.debug_classification(label='fine_label', embedding='embedding', inspect={'img': spotlight.dtypes.image_dtype})
spotlight.show(ds_enriched, dtype={'embedding': spotlight.Embedding}, layout=layout)
Customizing data inspection workflows
Visualization layouts can be interactively changed, saved and loaded in the GUI: You can select different widget types and configurations. The Inspector widget allows to represent multimodal data samples including text, image, audio, video and time series data.
You can also define layouts through the Python API. This option is especially useful for building custom data inspection and curation workflows including EDA, model debugging and model monitoring tasks.
In combination with the data issues widget, the Python API offers a great way to integrate the results of existing scripts (e.g. data quality checks or model monitoring) into a scalable data inspection workflow.
Using Spotlight on the Hugging Face hub
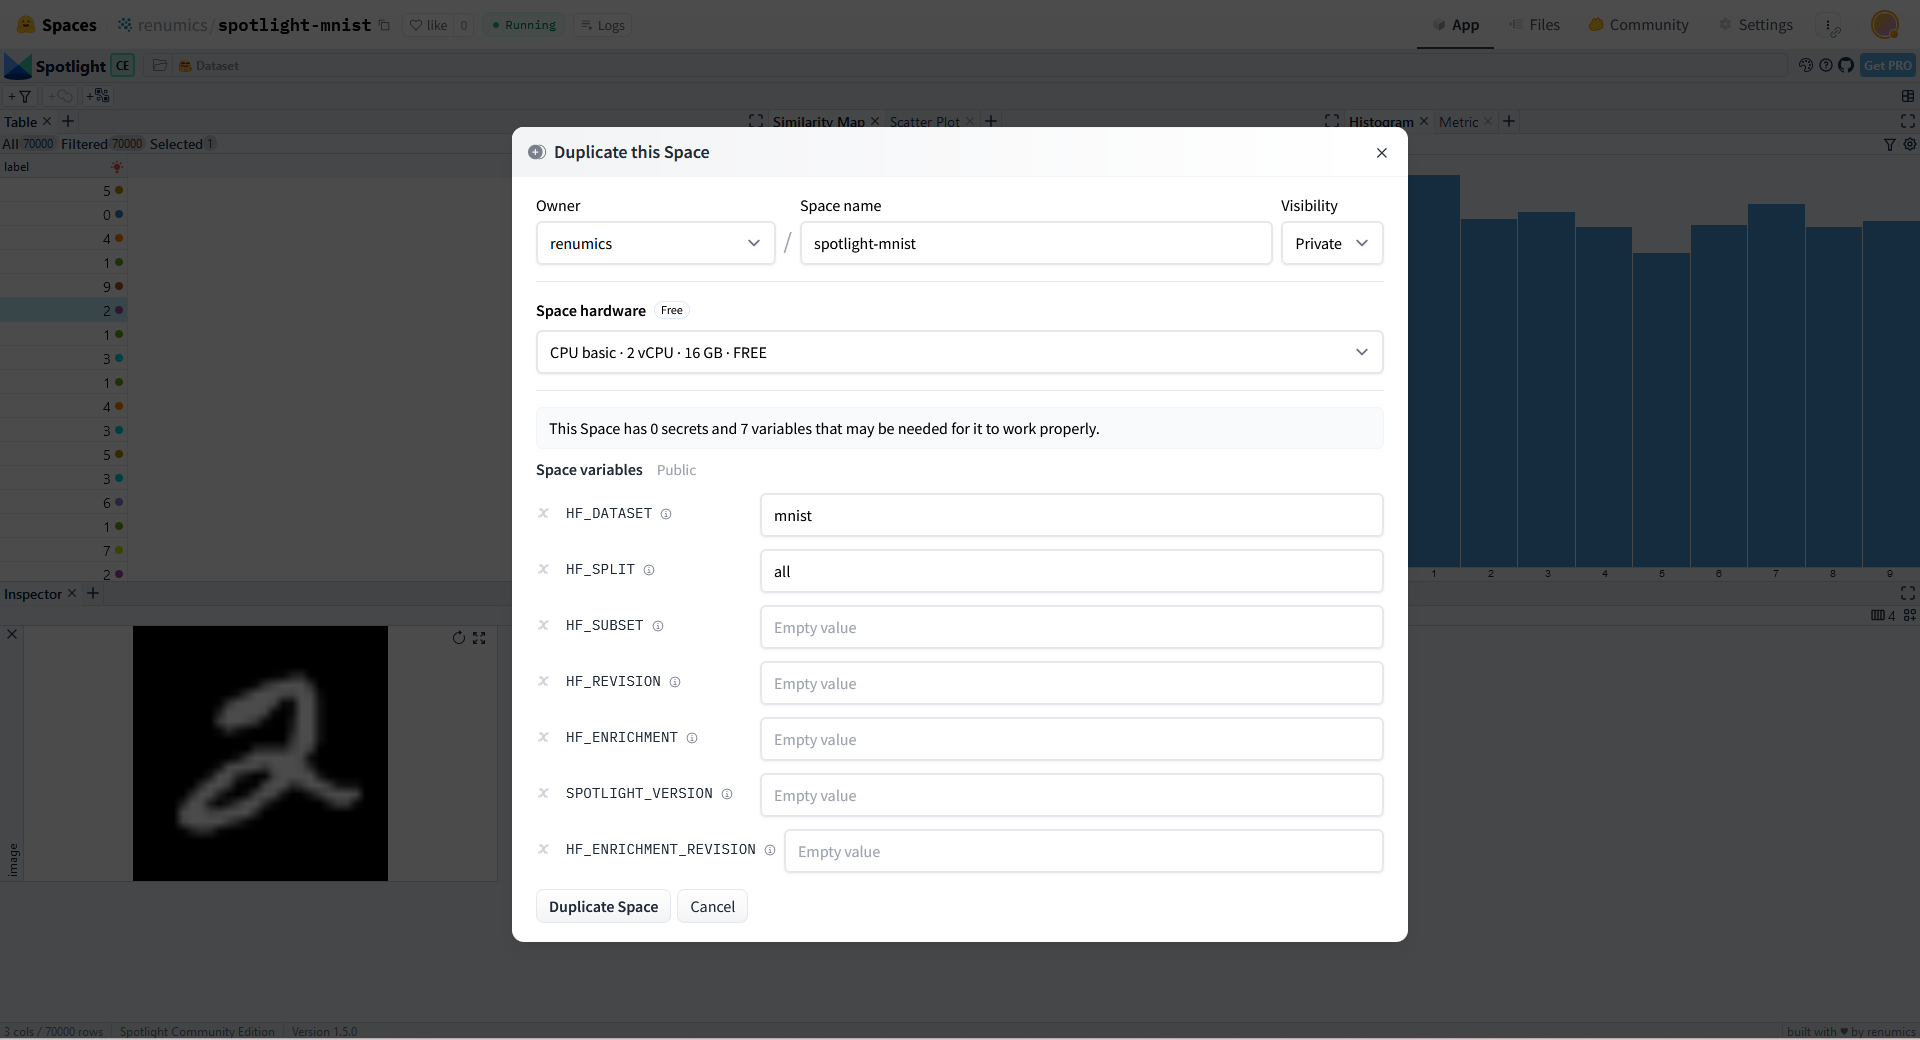
You can use Spotlight directly on your local NLP, audio, CV or multimodal dataset. If you would like to showcase your dataset or model results on the Hugging Face hub, you can use Hugging Face spaces to launch a Spotlight visualization for it.
We have already prepared example spaces for many popular NLP, audio and CV datasets on the hub. You can simply duplicate one of these spaces and specify your dataset in the HF_DATASET variable.
You can optionally choose a dataset that contains model results and other configuration options such as splits, subsets or dataset revisions.
What’s next?
With Spotlight you can create interactive visualizations and leverage data enrichments to identify critical clusters in your Hugging Face datasets. In this blog, we have seen both an audio ML and a computer vision example.
You can use Spotlight directly to explore and curate your NLP, audio, CV or multimodal dataset:
- Install Spotlight: pip install renumics-spotlight
- Check out the documentation or open an issue on Github
- Join the Spotlight community on Discord
- Follow us on Twitter and LinkedIn