Introducing the 🤗 Data Measurements Tool: an Interactive Tool for Looking at Datasets


tl;dr: We made a tool you can use online to build, measure, and compare datasets.
Click to access the 🤗 Data Measurements Tool here.
As developers of a fast-growing unified repository for Machine Learning datasets (Lhoest et al. 2021), the 🤗 Hugging Face team has been working on supporting good practices for dataset documentation (McMillan-Major et al., 2021). While static (if evolving) documentation represents a necessary first step in this direction, getting a good sense of what is actually in a dataset requires well-motivated measurements and the ability to interact with it, dynamically visualizing different aspects of interest.
To this end, we introduce an open-source Python library and no-code interface called the 🤗 Data Measurements Tool, using our Dataset and Spaces Hubs paired with the great Streamlit tool. This can be used to help understand, build, curate, and compare datasets.
What is the 🤗 Data Measurements Tool?
The Data Measurements Tool (DMT) is an interactive interface and open-source library that lets dataset creators and users automatically calculate metrics that are meaningful and useful for responsible data development.
Why have we created this tool?
Thoughtful curation and analysis of Machine Learning datasets is often overlooked in AI development. Current norms for “big data” in AI (Luccioni et al., 2021, Dodge et al., 2021) include using data scraped from various websites, with little or no attention paid to concrete measurements of what the different data sources represent, nor the nitty-gritty details of how they may influence what a model learns. Although dataset annotation approaches can help to curate datasets that are more in line with a developer’s goals, the methods for “measuring” different aspects of these datasets are fairly limited (Sambasivan et al., 2021).
A new wave of research in AI has called for a fundamental paradigm shift in how the field approaches ML datasets (Paullada et al., 2020, Denton et al., 2021). This includes defining fine-grained requirements for dataset creation from the start (Hutchinson et al., 2021), curating datasets in light of problematic content and bias concerns (Yang et al., 2020, Prabhu and Birhane, 2020), and making explicit the values inherent in dataset construction and maintenance (Scheuerman et al., 2021, Birhane et al., 2021). Although there is general agreement that dataset development is a task that people from many different disciplines should be able to inform, in practice there is often a bottleneck in interfacing with the raw data itself, which tends to require complex coding skills in order to analyze and query the dataset.
Despite this, there are few tools openly available to the public to enable people from different disciplines to measure, interrogate, and compare datasets. We aim to help fill this gap. We learn and build from recent tools such as Know Your Data and Data Quality for AI, as well as research proposals for dataset documentation such as Vision and Language Datasets (Ferraro et al., 2015), Datasheets for Datasets (Gebru et al, 2018), and Data Statements (Bender & Friedman 2019). The result is an open-source library for dataset measurements, and an accompanying no-code interface for detailed dataset analysis.
When can I use the 🤗 Data Measurements Tool?
The 🤗 Data Measurements Tool can be used iteratively for exploring one or more existing NLP datasets, and will soon support iterative development of datasets from scratch. It provides actionable insights informed by research on datasets and responsible dataset development, allowing users to hone in on both high-level information and specific items.
What can I learn using the 🤗 Data Measurements Tool?
Dataset Basics
For a high-level overview of the dataset
This begins to answer questions like “What is this dataset? Does it have missing items?”. You can use this as “sanity checks” that the dataset you’re working with is as you expect it to be.
A description of the dataset (from the Hugging Face Hub)
Number of missing values or NaNs
Descriptive Statistics
To look at the surface characteristics of the dataset
This begins to answer questions like “What kind of language is in this dataset? How diverse is it?”
The dataset vocabulary size and word distribution, for both open- and closed-class words.
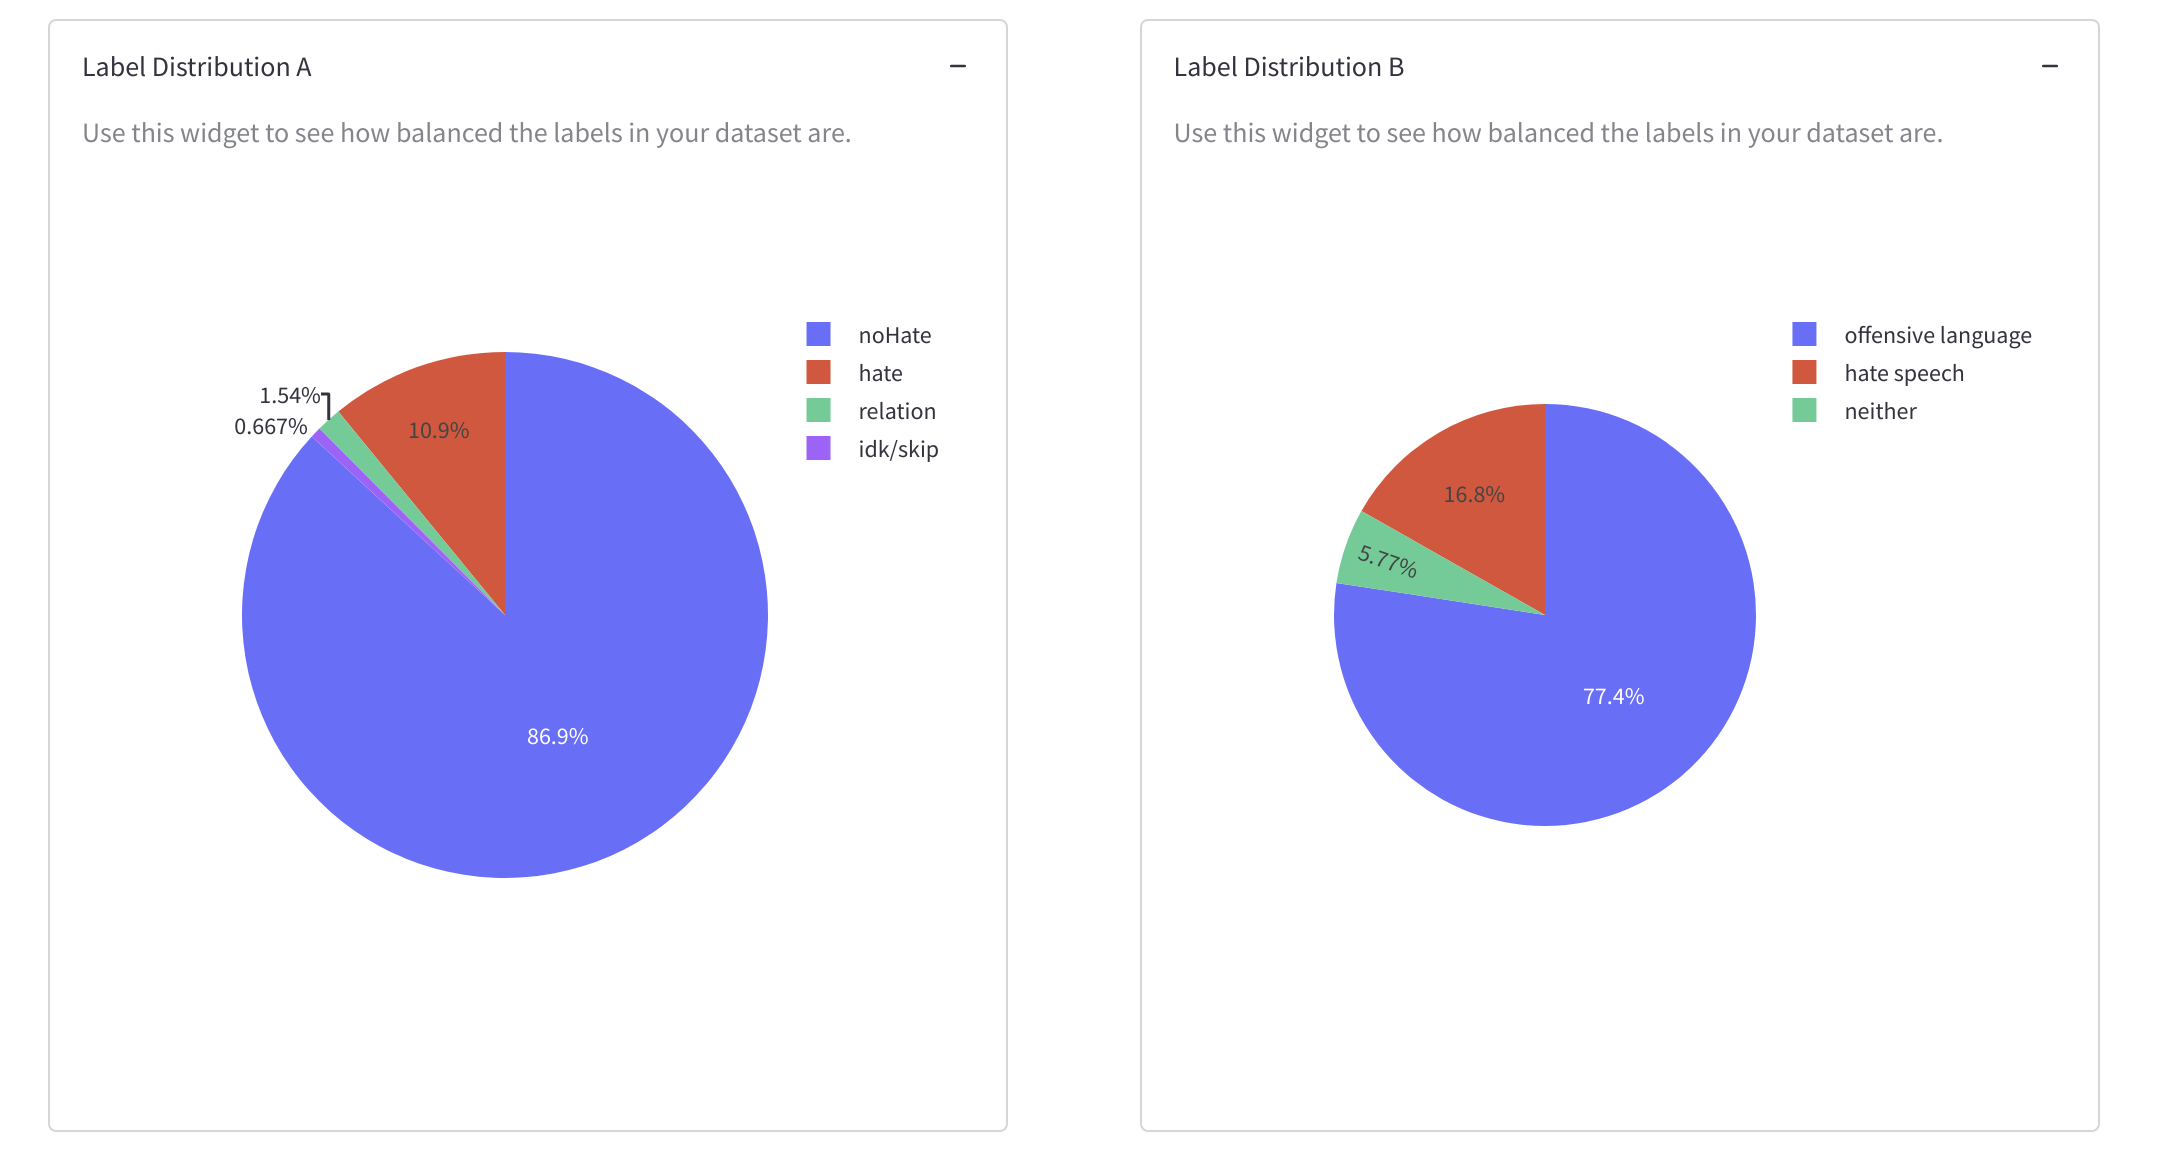
The dataset label distribution and information about class (im)balance.
The mean, median, range, and distribution of instance lengths.
The number of duplicates in the dataset and how many times they are repeated.
You can use these widgets to check whether what is most and least represented in the dataset make sense for the goals of the dataset. These measurements are intended to inform whether the dataset can be useful in capturing a variety of contexts or if what it captures is more limited, and to measure how ''balanced'' the labels and instance lengths are. You can also use these widgets to identify outliers and duplicates you may want to remove.
Distributional Statistics
To measure the language patterns in the dataset
This begins to answer questions like “How does the language behave in this dataset?”
- Adherence to Zipf’s law, which provides measurements of how closely the distribution over words in the dataset fits to the expected distribution of words in natural language.
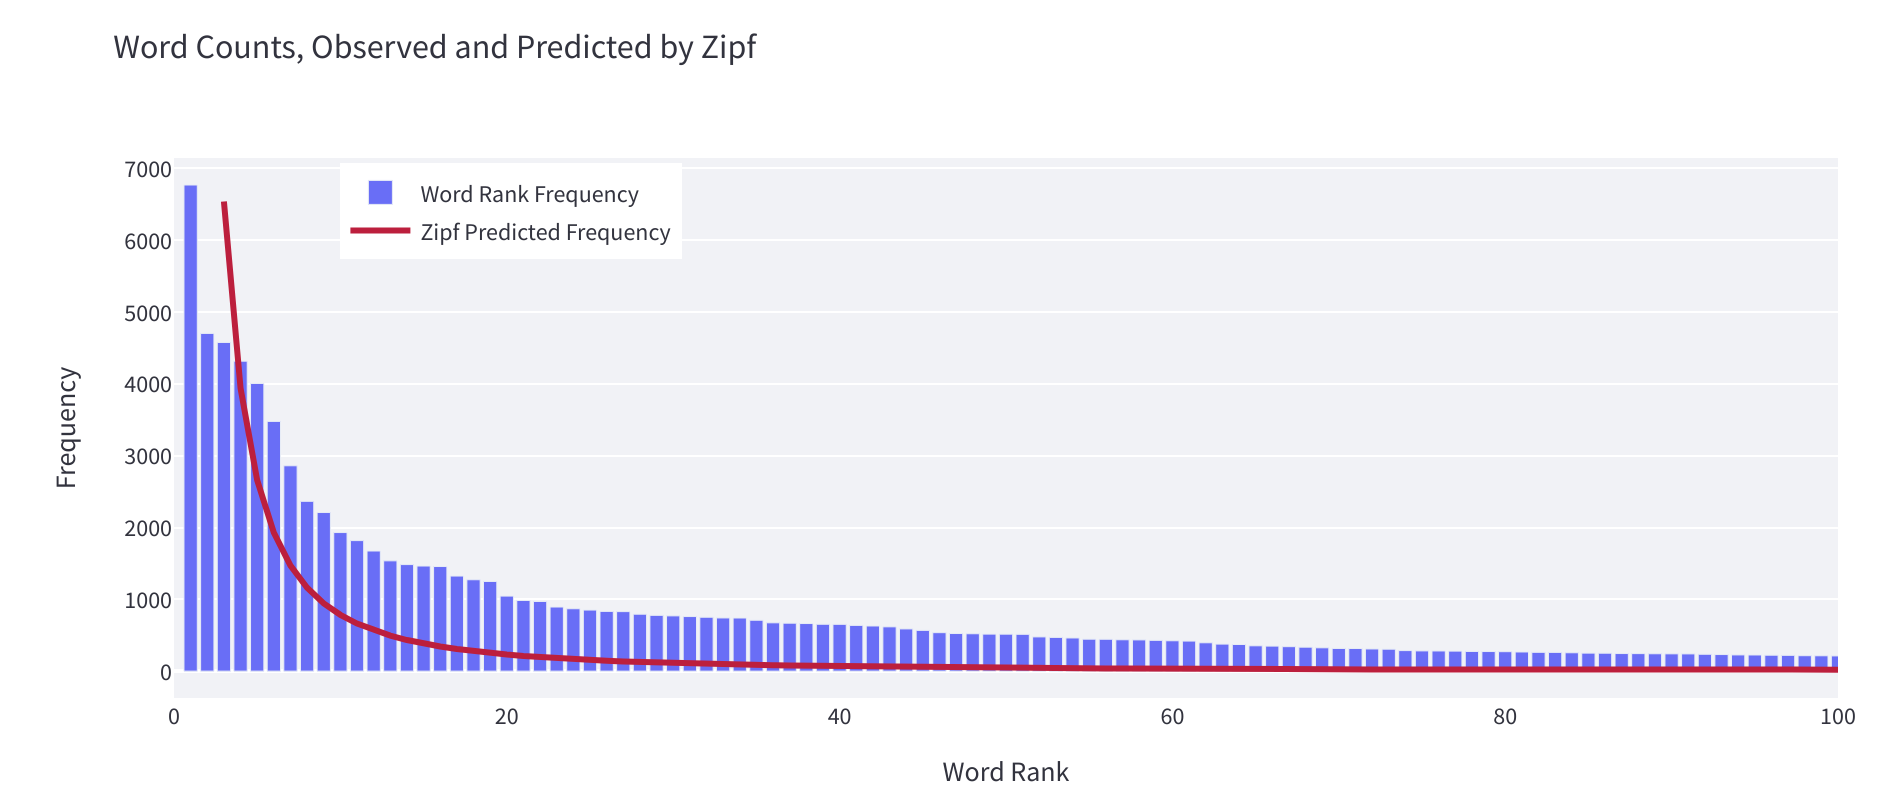
You can use this to figure out whether your dataset represents language as it tends to behave in the natural world or if there are things that are more unnatural about it. If you’re someone who enjoys optimization, then you can view the alpha value this widget calculates as a value to get as close as possible to 1 during dataset development. Further details on alpha values following Zipf’s law in different languages is available here.
In general, an alpha greater than 2 or a minimum rank greater than 10 (take with a grain of salt) means that your distribution is relatively unnatural for natural language. This can be a sign of mixed artefacts in the dataset, such as HTML markup. You can use this information to clean up your dataset or to guide you in determining how further language you add to the dataset should be distributed.
Comparison statistics
This begins to answer questions like “What kinds of topics, biases, and associations are in this dataset?”
Embedding clusters to pinpoint any clusters of similar language in the dataset. Taking in the diversity of text represented in a dataset can be challenging when it is made up of hundreds to hundreds of thousands of sentences. Grouping these text items based on a measure of similarity can help users gain some insights into their distribution. We show a hierarchical clustering of the text fields in the dataset based on a Sentence-Transformer model and a maximum dot product single-linkage criterion. To explore the clusters, you can:
- hover over a node to see the 5 most representative examples (deduplicated)
- enter an example in the text box to see which leaf clusters it is most similar to
- select a cluster by ID to show all of its examples
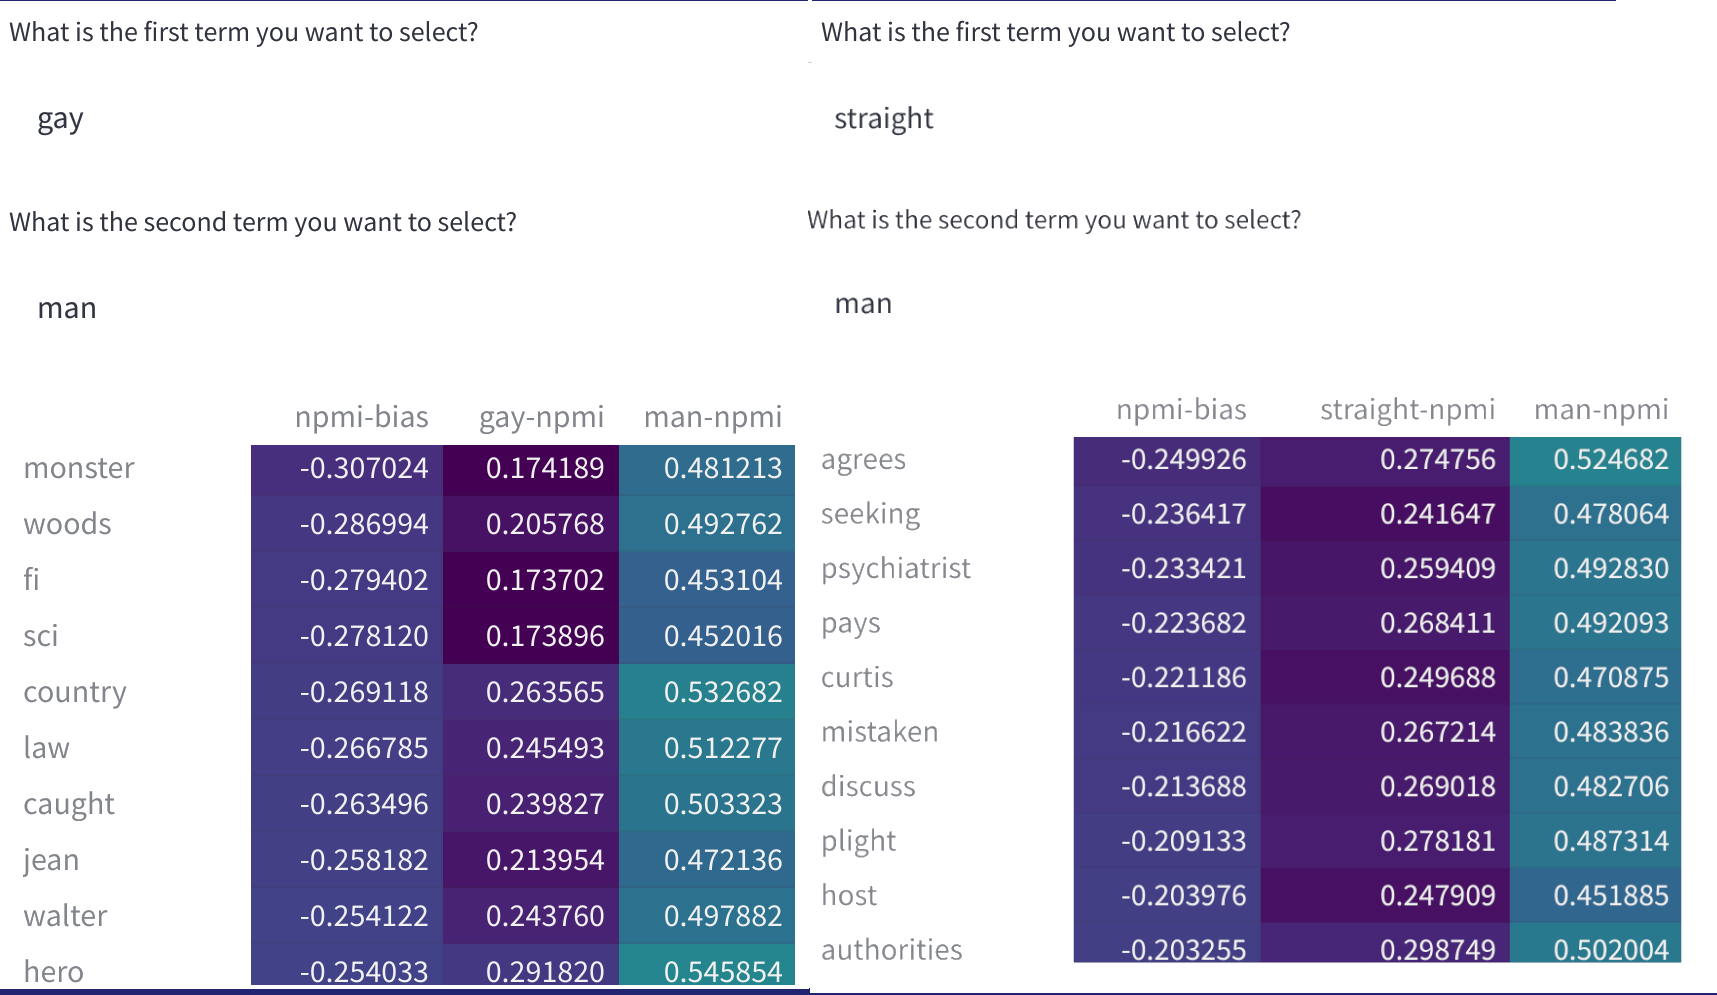
The normalized pointwise mutual information (nPMI) between word pairs in the dataset, which may be used to identify problematic stereotypes. You can use this as a tool in dealing with dataset “bias”, where here the term “bias” refers to stereotypes and prejudices for identity groups along the axes of gender and sexual orientation. We will add further terms in the near future.
What is the status of 🤗 Data Measurements Tool development?
We currently present the alpha version (v0) of the tool, demonstrating its usefulness on a handful of popular English-language datasets (e.g. SQuAD, imdb, C4, ...) available on the Dataset Hub, with the functionalities described above. The words that we selected for nPMI visualization are a subset of identity terms that came up frequently in the datasets that we were working with.
In coming weeks and months, we will be extending the tool to:
- Cover more languages and datasets present in the 🤗 Datasets library.
- Provide support for user-provided datasets and iterative dataset building.
- Add more features and functionalities to the tool itself. For example, we will make it possible to add your own terms for the nPMI visualization so you can pick the words that matter most to you.
Acknowledgements
Thank you to Thomas Wolf for initiating this work, as well as other members of the 🤗 team (Quentin, Lewis, Sylvain, Nate, Julien C., Julien S., Clément, Omar, and many others!) for their help and support.