Exploring a Public Domain dataset with Visual Topic Modeling


Tl;dr
How to explore information before training LLMs ? Exploring textual datasets in order to potentially remove biased or inaccurate content is a complex manual task that requires a lot of time, resources and good practices. Using techniques such as Visual Topic Modeling and Frame analysis help improve our understanding of datasets and create new meta-categories. We explore a public-domain dataset containing French books using a topic modeling package. We show that the new categories represent in a better way the content, that visualization helps make better sense of the information and that it allows a quicker and better data alignment.
You can find a visual representation of the French-PD-Books dataset collected by PleIAs on this space. You can find a Google colab reproducting the map.

Table of Contents
- Enhancing the transparency of datasets
- 1.1 What are the issues associated with training data?
- 1.2 The French Public Domain Dataset: a unique public domain dataset
- 1.3 Limits of the Dewey Decimal Classification for French Books
- Creating a new representation of the corpus’ content
- 2.1 Topic modeling on the corpus
- 2.2 Comparing the new categories with the Dewey Decimal categories
- 2.3 Enhancing sensemaking thought active exploration
- Exploring bias in the data
- Conclusion
1.Enhancing the transparency of datasets
What are the issues associated with training data?
In the Large Language Models’ world, it seems as if the quantity of information is synonymous with quality. Creators of AI models highlight the huge amounts of (private) data they train their model on as a proxy for intelligence. Limits of this approach are starting to emerge: flawed results stemming from messy data, illegal training from private data, bias in the training sets, lack of transparency and the environmentally damaging effects of heavy computing make it difficult to keep things as they are. The cost of unbiasing and correcting flawed models to align with society’s values and new regulation increases drastically.
To fix those issues, a new emphasis has been made on the quality of data ingested by the models: efficiently cleaned datasets (Côté, 2023), aligning models through fine-tuning (Guo, 2024) and creating synthetic data (Li, 2024) have emerged as ways to create better data to train or fine-tune the AIs. New methods leveraging two-dimensional representations of embeddings have also contributed to push forward our understanding of complex data (McInnes, 2018).
This post shows how to explore a public-domain dataset containing French books using Visual Topic Modeling and Frame analysis. We then compare the newly created categories to the existing ones, showing improvement in the categories.
The French Public Domain Dataset: a unique public domain dataset
A new initiative led by PleIAs aims to train LLMs on public-domain data. In order to achieve this goal, they released the French-PD-Books dataset, a collection initially compiled by Pierre-Carl Langlais, on the basis of a corpus curated by Benoît de Courson and Benjamin Azoulay for Gallicagram. It contains 289,000 french books coming from the French National Library spanning from 1600 to the mid 20th century (see Fig 1). This unique collection contains texts from Literature, Philosophy, History, Politics, Arts etc. and represents a great step towards the need for better transparency of training data.

Fig 1 - Distribution of a sample of the dataset (10%).
But in order to be fully transparent, one should not only be transparent about the origins of the corpus but also about its content. During their training and fine-tuning, autonomous agents learn a specific representation of the world and acquire a mix of basic knowledge and potential emerging abilities (like reasoning) based on the specific content they ingests. Controlling the world representation of models is synonymous with understanding what values and knowledge they learn. Given the different issues that AI arises (Birhane, 2021), aligning models with society’s values has recently become the next big challenge (Wynn, 2023).
Public-domain data like the the French-PD-Books dataset are challenging as they come from a different time period (because you need to wait decades before books are accessible by falling into the public domain): as a result, some of the content could be irrelevant or outdated: for instance, not all scientific ideas of that time have been kept (and this is a good thing) and the models should not learn that specific content.
Limits of the Dewey Decimal Classification for French Books
The first approach to understanding the content of a dataset is to look at existing classification systems. New systems for classifying and standardizing information was a key feature of the 18th century's scientific revolution. This type of classification started in biology and expanded in all the fields of art and knowledge. The French National Library is using the Dewey Decimal Classification DDC to allocate books into broad categories. The system created by the American librarian Melvil Dewey in 1876 assigns a numerical classification to each book or item based on ten main categories (Fig 2), which were later subdivided in sub-categories. The system has been initially designed to help individuals and librarians quickly find information in dense physical libraries. However, when describing the content, values, and ideas in a dataset, this system could be improved.
Four issues are identified:
- 1- Some categories may not be relevant today (the Language category is too vague and only makes sense in a world where speaking a foreign language is rare).
- 2- Categories are unbalanced: the Literature category represents ⅓ of the books.
- 3- Documents fall in a unique category: technically, a book could belong to an infinite number of categories (While not being in the database, isn't Harry Potter also as much about solving mysteries as it is about wizards?).
- 4- The reasons behind book classification in such or such categories are not transparent.

Fig 2 - Number of books by category in the top level Dewey Decimal Classification.

Fig 3 - Distribution of books in the top level Dewey Decimal Classification in time.
2.Creating a new representation of the corpus’ content
Topic modeling on the corpus
We create new categories using a topic modeling approach and visualize the results using two-dimensional visualization. We use the Bunkatopics package which brings a layer of advanced visualization to existing methods. Topic modeling works by first embedding documents using a top-french embedder model Solon-embeddings-large-0.1. We then compute topics by finding clusters within the latent space. A topic is essentially a group of documents that relate to the same subjects, meaning they share common structures, common expressions, common references and common words. We chose KMeans to create a fixed number of topics (10) and compare it to the Dewey Decimal Classification. We remove some outliers and remove documents between two topics to avoid uncertainty at the frontier of two clusters (One document could fall into one of the other cluster by luck).Every topic is initially summarized by its more specific terms (Grootendorst, 2022). We then manually annotate the clusters to make the visualization more clear.
!pip install bunkatopics # install the package

from datasets import load_dataset
dataset = load_dataset("bunkalab/French-PD-Books-title-sample")['train']

docs = list(dataset['title']) # 'docs' is a list of text [text1, text2, ..., textN]

from bunkatopics import Bunka
from langchain_community.embeddings import HuggingFaceEmbeddings

embedding_model = HuggingFaceEmbeddings(model_name="OrdalieTech/Solon-embeddings-large-0.1",
                                        model_kwargs={"device": "cpu"},
                                        encode_kwargs={"show_progress_bar": True})

bunka = Bunka(embedding_model=embedding_model, language='french') # You can
bunka.fit(docs) # fit bunka top documents
We compute the topics:
>>> bunka.get_topics(n_clusters=10, name_length=5)# Specify the number of terms
We then display the map:
>>> bunka.visualize_topics(width=800, height=800, colorscale='Portland')

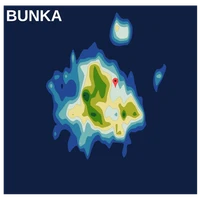
Fig 4 - Map of the topics. The density comes from the number of documents. The areas in dotted gray surrounds every topic. The topics’ labels are located at the centroids of every topic area.
The structure of the map (Fig 4) shows that two clusters detach from the rest: Medicine and Arts & Collectible. The Bibliography cluster is at the middle of the map given the fact that it gathers information about individuals who are likely to share semantic similarities with other clusters (This can be the bibliography of doctors, historical figures, artists etc).
Comparing the new categories with the Dewey Decimal categories
We then count the number of documents that intersect the former and new categories. The new categories are about the same size because KMeans splits the latent space into similarly sized parts.
Three points can be drawn from this comparison:
- The new categories overlap with the former categories but not completely. New categories like Medicine overlap consistently with the Techniques category which contains specialized books related to medicine as well. The Social Affairs category is distributed among different older categories.
- Other new categories can be distributed in many different old categories: For instance, the new category Social Affairs is almost distributed equally in all the former categories, highlighting the diversity of the books it contains in the eyes of the former system.
- We can also spot some mistakes: the new category Arts & Collectible overlaps with the former Literature category. While this can be debatable whether or not Art Catalogs belong to French Literature or not, this is certainly not the best box to put them in.

Fig 5 - Number of common documents between the new categories (y-axis) and the DCC categories (x-axis) normalized by y axis.
What we are really testing here is how much the former ontology categories contain documents that share similar semantic structure. Our results go against that statement indicating the need for categories that best represent the data.
Enhancing sensemaking thought active exploration
Transparency also means that the information is easily available for our human cognition. If information is buried and hard to find, we can’t hardly talk about transparency. We present new interfaces to help individuals make sense quickly and intuitively of the data (Kodagoda, 2013). The design is inspired from topography in order to help users understand the notion of distances between topics (closer topics share a closer meaning that distant ones). Documents have also been ranked in every cluster from the most specific to the least specific. Our rule is that a highly specific document contains a lot of specific terms of the cluster.
You can discover the full space here:https://huggingface.co/spaces/bunkalab/French-PD-Books-Exploration
3.Exploring bias in the data
To explore biases in the data, we use tools from the Frame Analysis literature (Kwak, 2020). For instance, we display how the data is represented in different supervised dimensions: Arts vs Politics, Future vs Past and Individuals vs Society. Any other continuum could be chosen. Of course, the assumption is that such continuums exist (indeed some things can be both Arts and Politics or both refer to the Past and the Future but we took the decision to separate them for the example). We compute the cosine distance between all embeddings and the difference between the continuums (Kozlowski, 2019).
We also add a void circle at the center to remove False Positives. As Frame Analysis is based on semantic similarity between the names of the axis and the documents, not all similarity scores are relevant: for instance of cosine similarity of 0.3 does not mean much. In order for similarity to be significant we manually set a threshold.
# Change manually the name of axis to be displayed in the figure
manual_axis_name = {'y_top_name':'Arts',
                    'y_bottom_name':'Politics',
                    'x_left_name':'Indvidual',
                    'x_right_name':'Society & Groups'}
## Bourdieu Fig
bourdieu_fig = bunka.visualize_bourdieu(
        llm=None, # Set to None if you don't need  GenAI summarization
        x_left_words=["c'est à propos d'un individu unique"], # original names are in French
        x_right_words=["c'est à propos de la société"],
        y_top_words=["c'est artistique"],
        y_bottom_words=["c'est politique"],
        height=1000,
        width=1000,
        clustering=False,
        topic_n_clusters=12,
        density=False,
        convex_hull=True,
        radius_size=0.3,
        manual_axis_name = manual_axis_name,
        label_size_ratio_clusters=80)

# Display the Bourdieu map
bourdieu_fig.show()
| Figure A | Figure B |
|---|---|
 |
 |
Fig 6 - Framing Analysis for different continnumm. The % indicated the content for the data that intersect in two categories.
We can get new insights! We find that data about Arts are more related to unique individuals than to the concept of Society (51.1% of the data within those continuum)(Fig 6a) and are more related to the Past (66.4% within those continuum)(Fig 6b). This is primarily because 19th-century art is connected to Antiquity and the creator's name is often included in the title.
With this method, you can understand your data and map them into controlled dimensions.
Conclusion
In summary, we created new categories using Visual Topic Modeling that gives us a more accurate overview of the data, whether it's about the content of the topics or how to to visualize them. Framing Analysis along specific supervised axes also uncovered new insights about the data.
If you are interested by the the topic of transparenecy, topic modeling and LLM, please check other Use Cases:
- Bunkatopics package: https://github.com/charlesdedampierre/BunkaTopics?tab=readme-ov-file
- Colab on Visual Topic Modeling: https://colab.research.google.com/drive/11K5bKs4y6snEFEZhKFNuNVRRSAsq9b7p#scrollTo=uxQ5qCIVar1u
- Colab on Cleaning Dataset for LLM: https://colab.research.google.com/drive/1KedB5FqJ62sF7Gb5qSsA5kbeTeJDw2Mo#scrollTo=-bEv2hrvakW4
- OASST2 Dataset Summary:https://huggingface.co/spaces/bunkalab/visualisation-oasst2
- Wikidedia Dataset: https://huggingface.co/spaces/bunkalab/wikipedia-en