Spaces:
Running

Running
File size: 6,945 Bytes
a52e8a5 |
1 2 3 4 5 6 7 8 9 10 11 12 13 14 15 16 17 18 19 20 21 22 23 24 25 26 27 28 29 30 31 32 33 34 35 36 37 38 39 40 41 42 43 44 45 46 47 48 49 50 51 52 53 54 55 56 57 58 59 60 61 62 63 64 65 66 67 68 69 70 71 72 73 74 75 76 77 78 79 80 81 82 83 84 85 86 87 88 89 90 91 92 93 94 95 96 97 98 99 100 101 102 103 104 105 106 107 108 109 110 111 112 113 114 115 116 117 118 119 120 121 122 123 124 125 126 127 128 129 130 131 132 133 134 135 136 137 138 139 140 141 142 143 144 145 146 147 148 149 150 151 152 153 154 155 156 157 158 159 160 161 162 163 164 165 166 167 168 |
---
title: Detection Metrics
emoji: 📈
colorFrom: green
colorTo: indigo
sdk: static
app_file: README.md
pinned: true
---

This project implements object detection **Average Precision** metrics using COCO style.
With `Detection Metrics` you can easily compute all 12 COCO metrics given the bounding boxes output by your object detection model:
### Average Precision (AP):
1. **AP**: AP at IoU=.50:.05:.95
2. **AP<sup>IoU=.50</sup>**: AP at IoU=.50 (similar to mAP PASCAL VOC metric)
3. **AP<sup>IoU=.75%</sup>**: AP at IoU=.75 (strict metric)
### AP Across Scales:
4. **AP<sup>small</sup>**: AP for small objects: area < 322
5. **AP<sup>medium</sup>**: AP for medium objects: 322 < area < 962
6. **AP<sup>large</sup>**: AP for large objects: area > 962
### Average Recall (AR):
7. **AR<sup>max=1</sup>**: AR given 1 detection per image
8. **AR<sup>max=10</sup>**: AR given 10 detections per image
9. **AR<sup>max=100</sup>**: AR given 100 detections per image
### AR Across Scales:
10. **AR<sup>small</sup>**: AR for small objects: area < 322
11. **AR<sup>medium</sup>**: AR for medium objects: 322 < area < 962
12. **AR<sup>large</sup>**: AR for large objects: area > 962
## How to use detection metrics?
Basically, you just need to create your ground-truth data and prepare your evaluation loop to output the boxes, confidences and classes in the required format. Follow these steps:
### Step 1: Prepare your ground-truth dataset
Convert your ground-truth annotations in JSON following the COCO format.
COCO ground-truth annotations are represented in a dictionary containing 3 elements: "images", "annotations" and "categories".
The snippet below shows an example of the dictionary, and you can find [here](https://towardsdatascience.com/how-to-work-with-object-detection-datasets-in-coco-format-9bf4fb5848a4).
```
{
"images": [
{
"id": 212226,
"width": 500,
"height": 335
},
...
],
"annotations": [
{
"id": 489885,
"category_id": 1,
"iscrowd": 0,
"image_id": 212226,
"area": 12836,
"bbox": [
235.6300048828125, # x
84.30999755859375, # y
158.08999633789062, # w
185.9499969482422 # h
]
},
....
],
"categories": [
{
"supercategory": "none",
"id": 1,
"name": "person"
},
...
]
}
```
You do not need to save the JSON in disk, you can keep it in memory as a dictionary.
### Step 2: Load the object detection evaluator:
Install Hugging Face's `Evaluate` module (`pip install evaluate`) to load the evaluator. More instructions [here](https://huggingface.co/docs/evaluate/installation).
Load the object detection evaluator passing the JSON created on the previous step through the argument `json_gt`:
`evaluator = evaluate.load("rafaelpadilla/detection_metrics", json_gt=ground_truth_annotations, iou_type="bbox")`
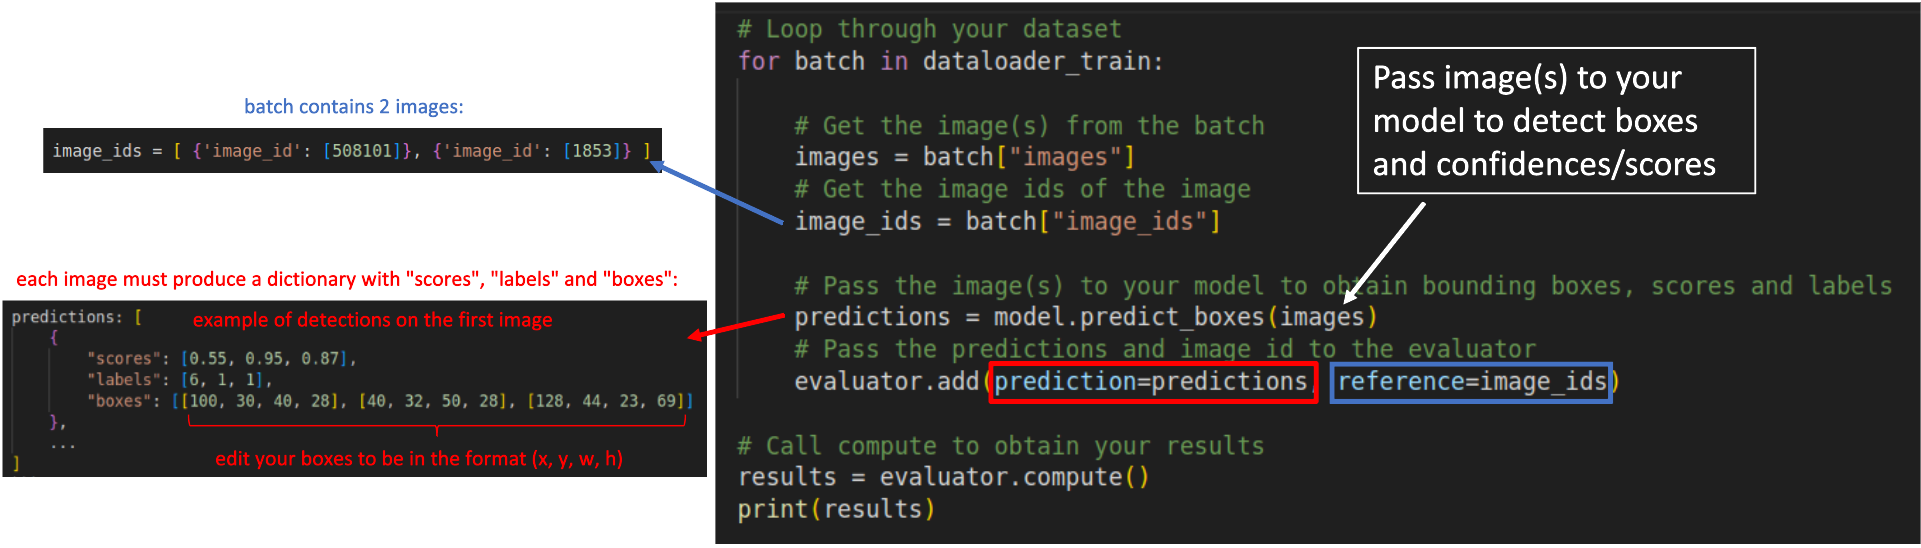
### Step 3: Loop through your dataset samples to obtain the predictions:
```python
# Loop through your dataset
for batch in dataloader_train:
# Get the image(s) from the batch
images = batch["images"]
# Get the image ids of the image
image_ids = batch["image_ids"]
# Pass the image(s) to your model to obtain bounding boxes, scores and labels
predictions = model.predict_boxes(images)
# Pass the predictions and image id to the evaluator
evaluator.add(prediction=predictions, reference=image_ids)
# Call compute to obtain your results
results = evaluator.compute()
print(results)
```
Regardless your model's architecture, your predictions must be converted to a dictionary containing 3 fields as shown below:
```python
predictions: [
{
"scores": [0.55, 0.95, 0.87],
"labels": [6, 1, 1],
"boxes": [[100, 30, 40, 28], [40, 32, 50, 28], [128, 44, 23, 69]]
},
...
]
```
* `scores`: List or torch tensor containing the confidences of your detections. A confidence is a value between 0 and 1.
* `labels`: List or torch tensor with the indexes representing the labels of your detections.
* `boxes`: List or torch tensors with the detected bounding boxes in the format `x,y,w,h`.
The `reference` added to the evaluator in each loop is represented by a list of dictionaries containing the image id of the image in that batch.
For example, in a batch containing two images, with ids 508101 and 1853, the `reference` argument must receive `image_ids` in the following format:
```python
image_ids = [ {'image_id': [508101]}, {'image_id': [1853]} ]
```
After the loop, you have to call `evaluator.compute()` to obtain your results in the format of a dictionary. The metrics can also be seen in the prompt as:
```
IoU metric: bbox
Average Precision (AP) @[ IoU=0.50:0.95 | area= all | maxDets=100 ] = 0.415
Average Precision (AP) @[ IoU=0.50 | area= all | maxDets=100 ] = 0.613
Average Precision (AP) @[ IoU=0.75 | area= all | maxDets=100 ] = 0.436
Average Precision (AP) @[ IoU=0.50:0.95 | area= small | maxDets=100 ] = 0.209
Average Precision (AP) @[ IoU=0.50:0.95 | area=medium | maxDets=100 ] = 0.449
Average Precision (AP) @[ IoU=0.50:0.95 | area= large | maxDets=100 ] = 0.601
Average Recall (AR) @[ IoU=0.50:0.95 | area= all | maxDets= 1 ] = 0.333
Average Recall (AR) @[ IoU=0.50:0.95 | area= all | maxDets= 10 ] = 0.531
Average Recall (AR) @[ IoU=0.50:0.95 | area= all | maxDets=100 ] = 0.572
Average Recall (AR) @[ IoU=0.50:0.95 | area= small | maxDets=100 ] = 0.321
Average Recall (AR) @[ IoU=0.50:0.95 | area=medium | maxDets=100 ] = 0.624
Average Recall (AR) @[ IoU=0.50:0.95 | area= large | maxDets=100 ] = 0.794
```
The scheme below illustrates how your `for` loop should look like:
-----------------------
## References and further readings:
1. [COCO Evaluation Metrics](https://cocodataset.org/#detection-eval)
2. [A Survey on performance metrics for object-detection algorithms](https://www.researchgate.net/profile/Rafael-Padilla/publication/343194514_A_Survey_on_Performance_Metrics_for_Object-Detection_Algorithms/links/5f1b5a5e45851515ef478268/A-Survey-on-Performance-Metrics-for-Object-Detection-Algorithms.pdf)
3. [A Comparative Analysis of Object Detection Metrics with a Companion Open-Source Toolkit](https://www.mdpi.com/2079-9292/10/3/279/pdf)
4. [COCO ground-truth annotations for your datasets in JSON](https://towardsdatascience.com/how-to-work-with-object-detection-datasets-in-coco-format-9bf4fb5848a4) |