File size: 7,518 Bytes
30b11c6 6498440 f144f21 026a3b5 e218e4c 30b11c6 916b870 e218e4c f144f21 916b870 e218e4c 916b870 ab855e2 e218e4c 026a3b5 e218e4c 916b870 e218e4c f144f21 916b870 f144f21 916b870 f5292db 916b870 4dcca22 916b870 e218e4c 916b870 e218e4c 916b870 e218e4c 916b870 e218e4c 916b870 e218e4c 916b870 |
1 2 3 4 5 6 7 8 9 10 11 12 13 14 15 16 17 18 19 20 21 22 23 24 25 26 27 28 29 30 31 32 33 34 35 36 37 38 39 40 41 42 43 44 45 46 47 48 49 50 51 52 53 54 55 56 57 58 59 60 61 62 63 64 65 66 67 68 69 70 71 72 73 74 75 76 77 78 79 80 81 82 83 84 85 86 87 88 89 90 91 92 93 94 95 96 97 98 99 100 101 102 103 104 105 106 107 108 109 110 111 112 113 114 115 116 117 118 119 120 121 122 123 124 125 126 127 128 129 130 131 132 133 134 135 136 137 138 139 140 141 142 143 144 145 146 147 148 149 150 151 152 153 154 155 156 157 158 159 160 161 162 163 164 165 166 167 168 169 170 171 172 173 174 175 176 177 178 179 180 181 182 183 184 185 186 187 188 189 190 191 192 193 194 195 196 197 198 199 200 201 202 203 204 205 206 207 208 209 210 211 212 213 214 215 216 217 218 219 220 221 |
import streamlit as st
from PIL import Image
import os
import pandas as pd
import tomli
pd.options.mode.chained_assignment = None
st.set_page_config(layout="wide")
st.markdown(
"<div style='background-color: lightblue; text-align: center; padding: 10px;'><h1 style='font-size: 70px;'>Our History in Data</h1></div>",
unsafe_allow_html=True,
)
@st.cache_data
def load_data():
df_ind = pd.read_csv("data/df_individuals_score.csv", index_col=[0])
df_ind = df_ind.drop("region_code", axis=1)
df_ind["productive_year"] = df_ind["productive_year"].astype(int)
df_ind["individual_wikidata_id"] = "https://www.wikidata.org/wiki/" + df_ind[
"individual_wikidata_id"
].astype(str)
df_ind = df_ind[df_ind["productive_year"] <= 1800]
return df_ind
df_ind = load_data()
def load_region_descriptions():
with open("regions.toml", "rb") as toml_file:
data = tomli.load(toml_file)
return data
# Function to get description based on selected region
def get_region_description(region_data, selected_region):
return region_data[selected_region]["description"]
region_data = load_region_descriptions()
# page = st.sidebar.selectbox("Navigate to:", ["Home", "Methodology", "Team"])
page = st.sidebar.radio(
"Menu",
["Home", "Methodology", "Team", "About"],
key="navigation_radio",
)
st.sidebar.success(
"This project is led by Charles de Dampierre, Folgert Karsdorp, Mike Kestemont, Valentin Thouzeau and Nicolas Baumard"
)
# Test change
if page == "Home":
# Set the global index path
global_index_path = "data/immaterial_index/figures_trends_R/results"
global_index_path_per_capita = (
"data/immaterial_index/figures_trends_R/results_capita"
)
unseen_index_path = "data/immaterial_index/figures_trends_R/results_unseen"
unseen_capita_index_path = (
"data/immaterial_index/figures_trends_R/results_unseen_capita"
)
population_path = "data/population"
maps_path = "data/map_figures"
from region_list import region_list
region_filtered = list(region_list.keys())
index_paths = {}
for region_key in region_list:
# Create the index paths for the current region
index_paths[region_key] = {
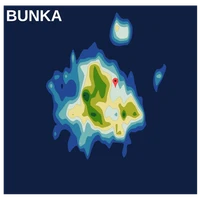
"map": f"{maps_path}/map_{region_key}.png",
"global_index": f"{global_index_path}/{region_key}.png",
"global_index_per_capita": f"{global_index_path_per_capita}/{region_key}.png",
"unseen_index": f"{unseen_index_path}/{region_key}.png",
"unseen_index_capita": f"{unseen_capita_index_path}/{region_key}.png",
"population_index": f"{population_path}/{region_key}.png",
}
# Get the region names (keys) from the index_paths dictionary
regions = list(index_paths.keys())
# Allow the user to select a region
selected_region = st.sidebar.selectbox(
"Region:", regions, index=regions.index("Japan")
)
# Display the selected region's images vertically
if selected_region in index_paths:
st.markdown(
f"<h1 style='text-align: left; font-size: 50px;'>{selected_region}</h1>",
unsafe_allow_html=True,
)
try:
st.image(
f"image/{selected_region}.jpeg",
caption="Japan",
use_column_width=False,
width=1000,
)
except:
pass
col1, col2, col3 = st.columns([8, 1, 8])
# Display the data in the left column
with col1:
for key, path in index_paths[selected_region].items():
if os.path.exists(path):
if key == "global_index":
st.subheader("Cultural Index")
st.image(
Image.open(path),
caption=key.capitalize(),
use_column_width=True,
)
elif key == "global_index_per_capita":
st.subheader("Cultural Index per capita")
st.image(
Image.open(path),
caption=key.capitalize(),
use_column_width=True,
)
elif key == "unseen_index":
st.subheader(
"Cultural Index corrected by the unseen-species model"
)
st.image(
Image.open(path),
caption=key.capitalize(),
use_column_width=True,
)
elif key == "unseen_index_capita":
st.subheader(
"Cultural Index per capita corrected by the unseen-species model"
)
st.image(
Image.open(path),
caption=key.capitalize(),
use_column_width=True,
)
else:
st.write(f"File for {key.capitalize()} does not exist.")
with col3:
try:
st.image(
Image.open(f"data/map_figures/map_{selected_region}.png"),
use_column_width=True,
width=1000,
)
except:
pass
st.subheader("Analysis")
try:
region_description = get_region_description(
region_data, selected_region
)
st.write(f"{region_description}")
except:
st.write("Analysis not ready yet")
st.subheader("Cultural Producers in Wikidata")
df = df_ind[df_ind["region_name"] == selected_region]
df = df.drop(["region_name", "decade"], axis=1)
df = df[
[
"individual_name",
"productive_year",
"score",
"individual_wikidata_id" "",
]
]
df = df.sort_values("score", ascending=False)
df = df.rename(columns={"score": "Number of Catalogs"})
min_date = region_list[selected_region]["time_range"][0]
max_date = region_list[selected_region]["time_range"][1]
df = df[df["productive_year"] >= min_date]
df = df[df["productive_year"] <= max_date]
df["productive_year"] = df["productive_year"].astype(int)
df = df.reset_index(drop=True)
st.dataframe(df)
st.write(f"Number of Cultural producers active before 1800: {len(df)}")
try:
st.subheader("Population")
st.image(
Image.open(path),
caption=key.capitalize(),
use_column_width=True,
)
except:
pass
elif page == "Methodology":
# Add content for the Methodology section here
st.markdown("<h2>Methodology</h2>", unsafe_allow_html=True)
st.write("Here you can describe the methodology used in your project.")
|