Spaces:
Runtime error
Runtime error
File size: 11,610 Bytes
b68f453 |
1 2 3 4 5 6 7 8 9 10 11 12 13 14 15 16 17 18 19 20 21 22 23 24 25 26 27 28 29 30 31 32 33 34 35 36 37 38 39 40 41 42 43 44 45 46 47 48 49 50 51 52 53 54 55 56 57 58 59 60 61 62 63 64 65 66 67 68 69 70 71 72 73 74 75 76 77 78 79 80 81 82 83 84 85 86 87 88 89 90 91 92 93 94 95 96 97 98 99 100 101 102 103 104 105 106 107 108 109 110 111 112 113 114 115 116 117 118 119 120 121 122 123 124 125 126 127 128 129 130 131 132 133 134 135 136 137 138 139 140 141 142 143 144 145 146 147 148 149 150 151 152 153 154 155 156 157 158 159 160 161 162 163 164 165 166 167 168 169 170 171 172 173 174 175 176 177 178 179 180 181 182 183 184 185 186 187 188 189 190 191 192 193 194 195 196 197 198 199 200 201 202 203 204 205 206 207 208 209 210 211 212 213 214 215 216 217 218 219 220 221 222 223 224 225 226 227 228 229 230 231 232 233 234 235 236 237 238 239 240 241 242 243 244 245 246 247 248 249 250 251 252 253 254 255 256 257 258 259 260 261 262 263 264 265 266 267 268 269 270 271 272 273 274 275 276 277 278 279 280 281 282 283 284 285 286 287 288 289 290 291 292 293 294 295 296 297 298 299 300 301 302 303 304 305 306 307 308 309 310 311 312 313 314 315 316 317 318 319 320 321 322 323 324 325 326 327 328 329 330 331 332 333 334 335 |
import { Backdrop, CircularProgress, Button, Box } from "@mui/material";
import HelpIcon from '@mui/icons-material/Help';
import Tooltip, { tooltipClasses } from '@mui/material/Tooltip';
import Typography from '@mui/material/Typography';
import RepeatIcon from '@mui/icons-material/Repeat';
import { styled } from '@mui/material/styles';
import * as d3 from "d3";
import * as d3Contour from "d3-contour";
import React, { useContext, useEffect, useRef, useState } from "react";
import TextContainer, { topicsSizeFraction } from "./TextContainer";
import { TopicsContext } from "./UploadFileContext";
import QueryView from "./QueryView";
const bunkaDocs = "bunka_docs.json";
const bunkaTopics = "bunka_topics.json";
const { REACT_APP_API_ENDPOINT } = process.env;
/**
* Generic tooltip
*/
export const HtmlTooltip = styled(({ className, ...props }) => (
<Tooltip {...props} classes={{ popper: className }} />
))(({ theme }) => ({
[`& .${tooltipClasses.popper}`]: {
backgroundColor: '#fff',
color: 'rgba(0, 0, 0, 0.87)',
maxWidth: 220,
fontSize: theme.typography.pxToRem(12),
},
}));
function MapView() {
const [selectedDocument, setSelectedDocument] = useState(null);
const [mapLoading, setMapLoading] = useState(false);
const [topicsCentroids, setTopicsCentroids] = useState([])
const { data: apiData, isLoading: isFileProcessing } = useContext(TopicsContext);
const svgRef = useRef(null);
const scatterPlotContainerRef = useRef(null);
const createScatterPlot = (data) => {
const margin = {
top: 20,
right: 20,
bottom: 50,
left: 50,
};
const plotWidth = window.innerWidth * 0.6;
const plotHeight = window.innerHeight - document.getElementById("top-banner").clientHeight - 50; // Adjust the height as desired
d3.select(svgRef.current).selectAll("*").remove();
const svg = d3
.select(svgRef.current)
.attr("width", "100%")
.attr("height", plotHeight);
/**
* SVG canvas group on which transforms apply.
*/
const g = svg.append("g")
.classed("canvas", true)
.attr("transform", `translate(${margin.left}, ${margin.top})`);
/**
* TODO Zoom.
*/
const zoom = d3.zoom()
.scaleExtent([1, 3])
.translateExtent([[0, 0], [1000, 1000]])
.on("zoom", function ({ transform }) {
g.attr(
"transform",
`translate(${transform.x ?? 0}, ${transform.y ?? 0}) scale(${transform.k ?? 1})`
)
//positionLabels()
// props.setTransform?.({
// x: transform.x,
// y: transform.y,
// k: transform.k
// })
});
svg.call(zoom);
/**
* Initial zoom.
*/
// const defaultTransform = { k: 1 };
// const initialTransform = defaultTransform?.k != null
// ? new ZoomTransform(
// defaultTransform.k ?? 1,
// defaultTransform.x ?? 0,
// defaultTransform.y ?? 0
// )
// : d3.zoomIdentity;
// svg.call(zoom.transform, initialTransform);
const xMin = d3.min(data, (d) => d.x);
const xMax = d3.max(data, (d) => d.x);
const yMin = d3.min(data, (d) => d.y);
const yMax = d3.max(data, (d) => d.y);
const xScale = d3
.scaleLinear()
.domain([xMin, xMax]) // Use the full range of your data
.range([0, plotWidth]);
const yScale = d3
.scaleLinear()
.domain([yMin, yMax]) // Use the full range of your data
.range([plotHeight, 0]);
// Add contours
const contourData = d3Contour
.contourDensity()
.x((d) => xScale(d.x))
.y((d) => yScale(d.y))
.size([plotWidth, plotHeight])
.bandwidth(30)(
// Adjust the bandwidth as needed
data,
);
// Define a custom color for the contour lines
const contourLineColor = "rgb(94, 163, 252)";
// Append the contour path to the SVG with a custom color
g
.selectAll("path.contour")
.data(contourData)
.enter()
.append("path")
.attr("class", "contour")
.attr("d", d3.geoPath())
.style("fill", "none")
.style("stroke", contourLineColor) // Set the contour line color to the custom color
.style("stroke-width", 1);
/*
const circles = svg.selectAll('circle')
.data(data)
.enter()
.append('circle')
.attr('cx', (d) => xScale(d.x))
.attr('cy', (d) => yScale(d.y))
.attr('r', 5)
.style('fill', 'lightblue')
.on('click', (event, d) => {
// Show the content and topic name of the clicked point in the text container
setSelectedDocument(d);
// Change the color to pink on click
circles.style('fill', (pointData) => (pointData === d) ? 'pink' : 'lightblue');
});
*/
const centroids = data.filter((d) => d.x_centroid && d.y_centroid);
setTopicsCentroids(centroids);
g
.selectAll("circle.topic-centroid")
.data(centroids)
.enter()
.append("circle")
.attr("class", "topic-centroid")
.attr("cx", (d) => xScale(d.x_centroid))
.attr("cy", (d) => yScale(d.y_centroid))
.attr("r", 8) // Adjust the radius as needed
.style("fill", "red") // Adjust the fill color as needed
.style("stroke", "black")
.style("stroke-width", 2)
.on("click", (event, d) => {
// Show the content and topic name of the clicked topic centroid in the text container
setSelectedDocument(d);
});
// Add text labels for topic names
g
.selectAll("text.topic-label")
.data(centroids)
.enter()
.append("text")
.attr("class", "topic-label")
.attr("x", (d) => xScale(d.x_centroid))
.attr("y", (d) => yScale(d.y_centroid) - 12) // Adjust the vertical position
.text((d) => d.name) // Use the 'name' property for topic names
.style("text-anchor", "middle"); // Center-align the text
const convexHullData = data.filter((d) => d.convex_hull);
for (const d of convexHullData) {
const hull = d.convex_hull;
const hullPoints = hull.x_coordinates.map((x, i) => [xScale(x), yScale(hull.y_coordinates[i])]);
g
.append("path")
.datum(d3.polygonHull(hullPoints))
.attr("class", "convex-hull-polygon")
.attr("d", (d1) => `M${d1.join("L")}Z`)
.style("fill", "none")
.style("stroke", "rgba(255, 255, 255, 0.5)") // White with 50% transparency
.style("stroke-width", 2);
}
// Add polygons for topics. Delete if no clicking on polygons
const topicsPolygons = g
.selectAll("polygon.topic-polygon")
.data(centroids)
.enter()
.append("polygon")
.attr("class", "topic-polygon")
.attr("points", (d) => {
const hull = d.convex_hull;
const hullPoints = hull.x_coordinates.map((x, i) => [xScale(x), yScale(hull.y_coordinates[i])]);
return hullPoints.map((point) => point.join(",")).join(" ");
})
.style("fill", "transparent")
.style("stroke", "transparent")
.style("stroke-width", 2); // Adjust the border width as needed
let currentlyClickedPolygon = null;
topicsPolygons.on("click", (event, d) => {
// Reset the fill color of the previously clicked polygon to transparent light grey
if (currentlyClickedPolygon !== null) {
currentlyClickedPolygon.style("fill", "transparent");
currentlyClickedPolygon.style("stroke", "transparent");
}
// Set the fill color of the clicked polygon to transparent light grey and add a red border
const clickedPolygon = d3.select(event.target);
clickedPolygon.style("fill", "rgba(200, 200, 200, 0.4)");
clickedPolygon.style("stroke", "red");
currentlyClickedPolygon = clickedPolygon;
// Display the topic name and content from top_doc_content with a scroll system
if (d.top_doc_content) {
// Render the TextContainer component with topic details
setSelectedDocument(d);
}
});
};
useEffect(() => {
if (REACT_APP_API_ENDPOINT === "local" || apiData === undefined) {
setMapLoading(true);
// Fetch the JSON data locally
fetch(`/${bunkaDocs}`)
.then((response) => response.json())
.then((localData) => {
// Fetch the local topics data and merge it with the existing data
fetch(`/${bunkaTopics}`)
.then((response) => response.json())
.then((topicsData) => {
// Merge the topics data with the existing data
const mergedData = localData.concat(topicsData);
// Call the function to create the scatter plot after data is loaded
createScatterPlot(mergedData);
})
.catch((error) => {
console.error("Error fetching topics data:", error);
})
.finally(() => {
setMapLoading(false);
});
})
.catch((error) => {
console.error("Error fetching JSON data:", error);
})
.finally(() => {
setMapLoading(false);
});
} else {
// Call the function to create the scatter plot with the data provided by TopicsContext
createScatterPlot(apiData.docs.concat(apiData.topics));
}
// After the data is loaded, set the default topic
if (apiData && apiData.topics && apiData.topics.length > 0) {
// Set the default topic to the first topic in the list
setSelectedDocument(apiData.topics[0]);
}
}, [apiData]);
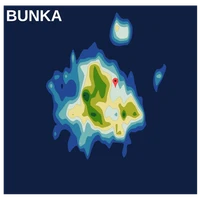
const mapDescription = "This map is created by embedding documents in a two-dimensional space. Two documents are close to each other if they share similar semantic features, such as vocabulary, expressions, and language. The documents are not directly represented on the map; instead, they are grouped into clusters. A cluster is a set of documents that share similarities. A cluster is automatically described by a few words that best describes it.";
return (
<div className="json-display">
{(isFileProcessing || mapLoading) ? (
<Backdrop open={isFileProcessing || mapLoading} style={{ zIndex: 9999 }}>
<CircularProgress color="primary" />
</Backdrop>
) : (
<div className="scatter-plot-and-text-container">
<div className="scatter-plot-container" ref={scatterPlotContainerRef}>
<HtmlTooltip
title={
<React.Fragment>
<Typography color="inherit">{mapDescription}</Typography>
</React.Fragment>
}
followCursor
>
<HelpIcon style={{
position: "relative",
top: 10,
left: 40,
border: "none"
}} />
</HtmlTooltip>
<svg ref={svgRef} />
</div>
<div className="text-container" >
{selectedDocument !== null ? (
<>
{/* <Box sx={{ marginBottom: "1em" }}>
<Button sx={{ width: "100%" }} component="label" variant="outlined" startIcon={<RepeatIcon />} onClick={() => setSelectedDocument(null)}>
Upload another CSV file
</Button>
</Box> */}
<TextContainer topicName={selectedDocument.name} topicSizeFraction={topicsSizeFraction(topicsCentroids, selectedDocument.size)} content={selectedDocument.top_doc_content} />
</>
) : <QueryView />}
</div>
</div>
)}
</div>
);
}
export default MapView;
|