Spaces:
Sleeping
Sleeping
File size: 2,831 Bytes
2999286 |
1 2 3 4 5 6 7 8 9 10 11 12 13 14 15 16 17 18 19 20 21 22 23 24 25 26 27 28 29 30 31 32 33 34 35 36 37 38 39 40 41 42 43 44 45 46 47 48 49 50 51 52 53 54 55 56 57 58 59 60 61 62 63 64 65 66 67 68 69 70 71 72 73 74 75 76 77 78 79 80 81 82 83 84 85 86 87 88 89 90 91 92 93 94 95 96 97 98 99 100 101 102 103 104 105 106 107 108 109 110 111 112 113 |
#!/usr/bin/env python
# coding: utf-8
# # Overlapping Celltype annotation with GNN
# Droplet based single cell transcriptomics has recently enabled parallel screening of tens of thousands of single cells. Clustering methods that scale for such high dimensional data without compromising accuracy are scarce.
#
# This tutorial focuses on how to cluster the cell with overlapping and identify the cell with multi-fate
#
# Colab_Reproducibility:https://colab.research.google.com/drive/1l7iHdVmTQcv9YmpIjhK_UzLuHbJ1Jv9E?usp=sharing
#
# <div class="admonition warning">
# <p class="admonition-title">Warning</p>
# <p>
# NOCD's development is still in progress. The current version may not fully reproduce the original implementation’s results.
# </p>
# </div>
# ## Part.1 Data preprocess
#
# In this part, we perform preliminary processing of the data, such as normalization and logarithmization, in order to make the data more interpretable
# In[1]:
import omicverse as ov
import anndata
import scanpy as sc
import matplotlib.pyplot as plt
import numpy as np
import pandas as pd
get_ipython().run_line_magic('matplotlib', 'inline')
# In[2]:
#param for visualization
sc.settings.verbosity = 3 # verbosity: errors (0), warnings (1), info (2), hints (3)
sc.settings.set_figure_params(dpi=80, facecolor='white')
# In[3]:
from matplotlib.colors import LinearSegmentedColormap
sc_color=['#7CBB5F','#368650','#A499CC','#5E4D9A','#78C2ED','#866017', '#9F987F','#E0DFED',
'#EF7B77', '#279AD7','#F0EEF0', '#1F577B', '#A56BA7', '#E0A7C8', '#E069A6', '#941456', '#FCBC10',
'#EAEFC5', '#01A0A7', '#75C8CC', '#F0D7BC', '#D5B26C', '#D5DA48', '#B6B812', '#9DC3C3', '#A89C92', '#FEE00C', '#FEF2A1']
sc_color_cmap = LinearSegmentedColormap.from_list('Custom', sc_color, len(sc_color))
# In[4]:
adata = anndata.read('sample/rna.h5ad')
adata
# In[5]:
adata=ov.single.scanpy_lazy(adata)
# ## Part.2 Overlapping Community Detection
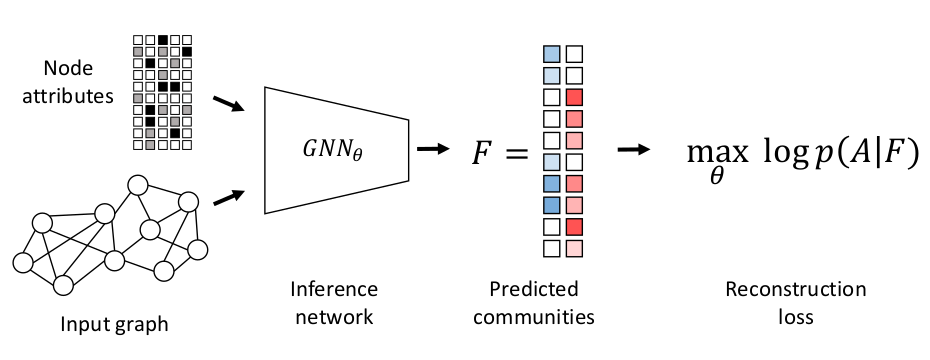
# In this part, we perform a graph neural network (GNN) basedmodel for overlapping community detection in scRNA-seq.
#
# 
# In[6]:
scbrca=ov.single.scnocd(adata)
scbrca.matrix_transform()
scbrca.matrix_normalize()
scbrca.GNN_configure()
scbrca.GNN_preprocess()
scbrca.GNN_model()
scbrca.GNN_result()
scbrca.GNN_plot()
#scbrca.calculate_nocd()
scbrca.cal_nocd()
# In[8]:
scbrca.calculate_nocd()
# ## Part.3 Visualization
# In this part, we visualized the overlapping and non-overlapping cell.
# In[9]:
sc.pl.umap(scbrca.adata, color=['leiden','nocd'],wspace=0.4,palette=sc_color)
# zero means the cell related to overlap
# In[10]:
sc.pl.umap(scbrca.adata, color=['leiden','nocd_n'],wspace=0.4,palette=sc_color)
# In[ ]:
|