
File size: 1,690 Bytes
6255c84 460c7a2 6255c84 b88be4d 6255c84 49e4b88 6255c84 460c7a2 |
1 2 3 4 5 6 7 8 9 10 11 12 13 14 15 16 17 18 19 20 21 22 23 24 25 26 27 28 29 30 31 32 33 34 35 36 37 38 39 40 41 42 43 44 45 46 47 48 49 50 51 52 53 54 55 56 |
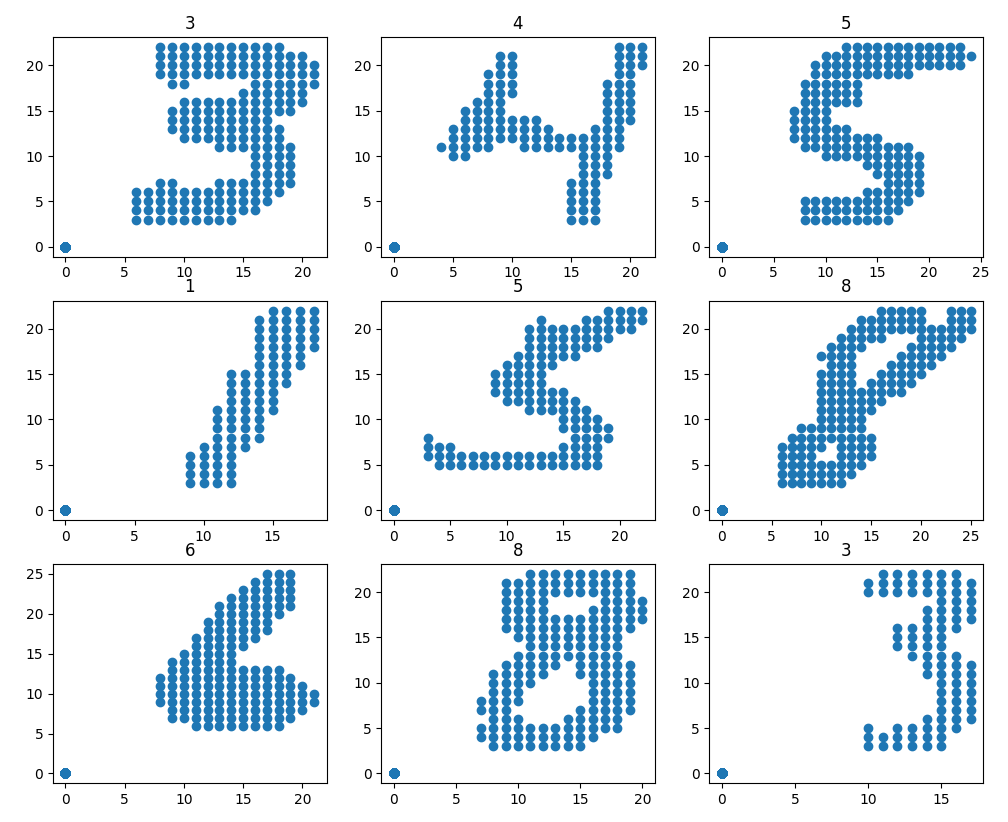
# Point CLoud MNIST
A point cloud version of the original MNIST.
## Getting Started
```python
import matplotlib.pyplot as plt
import numpy as np
from datasets import load_dataset
# load dataset
dataset = load_dataset("cgarciae/point-cloud-mnist")
dataset.set_format("np")
# get numpy arrays
X_train = dataset["train"]["points"]
y_train = dataset["train"]["label"]
X_test = dataset["test"]["points"]
y_test = dataset["test"]["label"]
# plot some training samples
figure = plt.figure(figsize=(10, 10))
for i in range(3):
for j in range(3):
k = 3 * i + j
plt.subplot(3, 3, k + 1)
idx = np.random.randint(0, len(X_train))
plt.title(f"{y_train[idx]}")
plt.scatter(X_train[idx, :, 0], X_train[idx, :, 1])
plt.show()
```
## Format
* `points`: `(batch, point, 3)` array of uint8.
* `label`: `(batch, 1)` array of uint8.
Where `point` is the number of points in the point cloud. Points have no order and were shuffled when creating the data. Each point has the structure `[x, y, v]` where:
* `x`: is the x coordinate of the point in the image.
* `y`: is the y coordinate of the point in the image.
* `v`: is the value of the pixel at the point in the image.
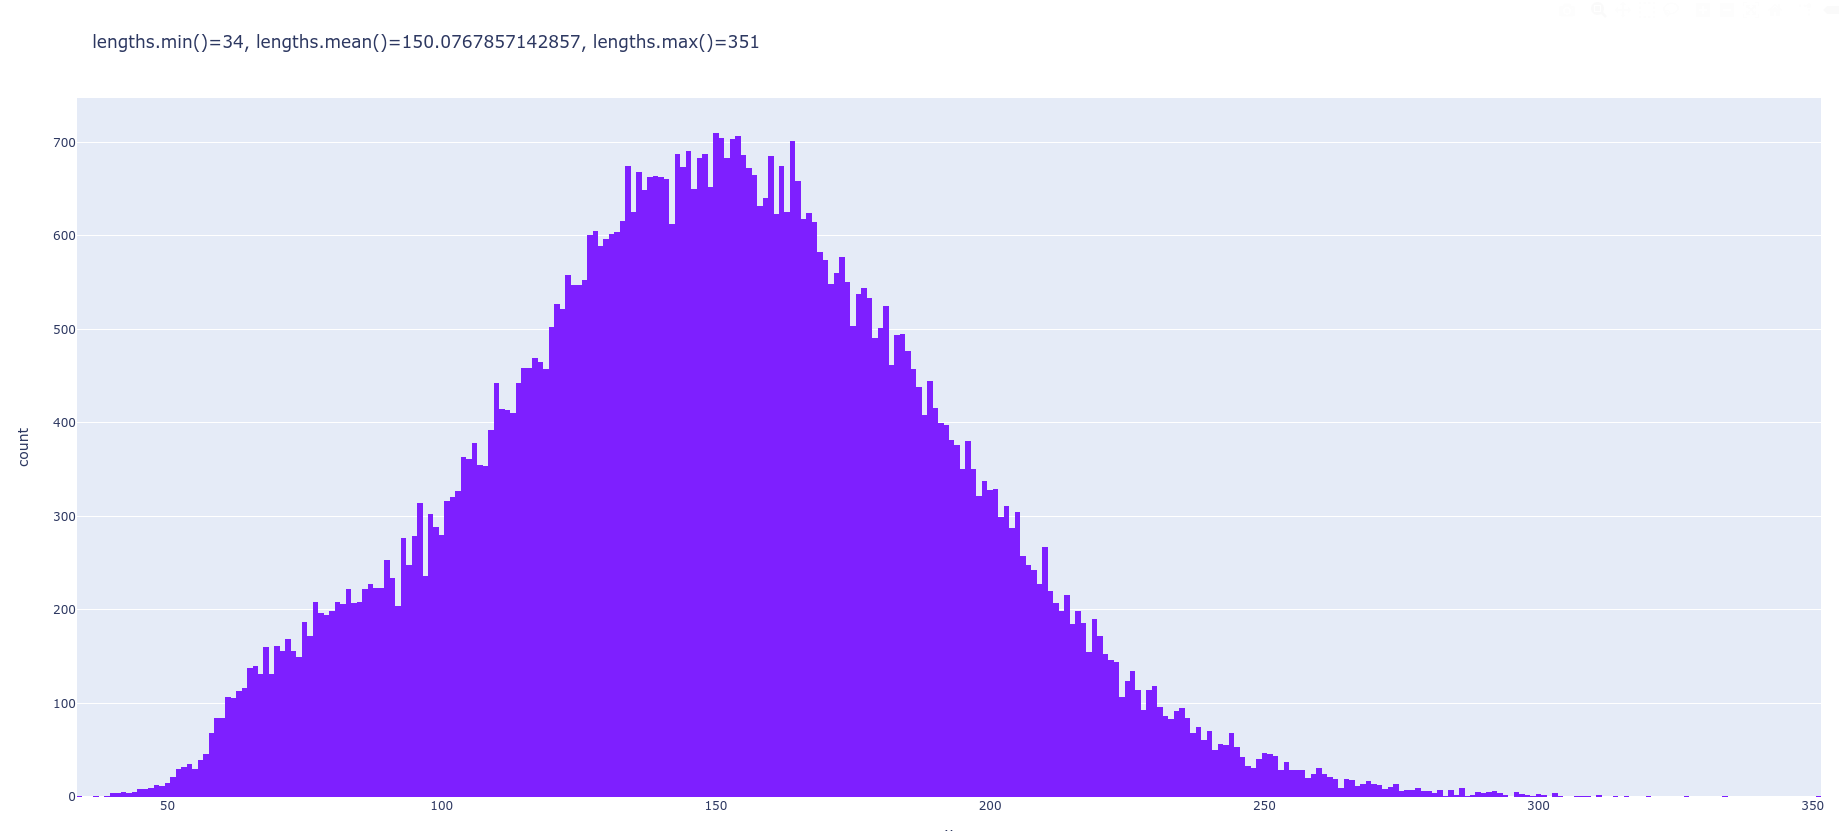
Samples are padded with `0`s such that `point = 351` since its the largest number of non-zero pixels per image in the original dataset. You can tell apart padding point because they are the only ones where `v = 0`.
Here is the distribution of non-zero pixels in the MNIST:
 |