Spaces:
Running


title: MAE
emoji: 🤗
colorFrom: blue
colorTo: red
sdk: gradio
sdk_version: 3.19.1
app_file: app.py
pinned: false
tags:
  - evaluate
  - metric
description: >-
  Mean Absolute Error (MAE) is the mean of the magnitude of difference between
  the predicted and actual values.
Metric Card for MAE
Metric Description
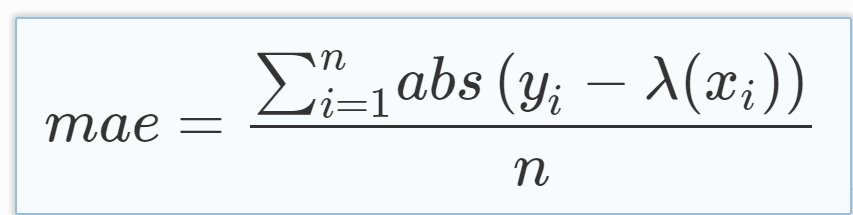
Mean Absolute Error (MAE) is the mean of the magnitude of difference between the predicted and actual numeric values:
How to Use
At minimum, this metric requires predictions and references as inputs.
>>> mae_metric = evaluate.load("mae")
>>> predictions = [2.5, 0.0, 2, 8]
>>> references = [3, -0.5, 2, 7]
>>> results = mae_metric.compute(predictions=predictions, references=references)
Inputs
Mandatory inputs:
predictions: numeric array-like of shape (n_samples,) or (n_samples,n_outputs), representing the estimated target values.references: numeric array-like of shape (n_samples,) or (n_samples,n_outputs), representing the ground truth (correct) target values.
Optional arguments:
sample_weight: numeric array-like of shape (n_samples,) representing sample weights. The default isNone.multioutput:raw_values,uniform_averageor numeric array-like of shape (n_outputs,), which defines the aggregation of multiple output values. The default value isuniform_average.raw_valuesreturns a full set of errors in case of multioutput input.uniform_averagemeans that the errors of all outputs are averaged with uniform weight.- the array-like value defines weights used to average errors.
Output Values
This metric outputs a dictionary, containing the mean absolute error score, which is of type:
float: if multioutput isuniform_averageor an ndarray of weights, then the weighted average of all output errors is returned.- numeric array-like of shape (
n_outputs,): if multioutput israw_values, then the score is returned for each output separately.
Each MAE float value ranges from 0.0 to +inf, with the best value being 0.0.
Output Example(s):
{'mae': 0.5}
If multioutput="raw_values":
{'mae': array([0.5, 1. ])}
Values from Popular Papers
Examples
Example with the uniform_average config:
>>> mae_metric = evaluate.load("mae")
>>> predictions = [2.5, 0.0, 2, 8]
>>> references = [3, -0.5, 2, 7]
>>> results = mae_metric.compute(predictions=predictions, references=references)
>>> print(results)
{'mae': 0.5}
Example with multi-dimensional lists, and the raw_values config:
>>> mae_metric = evaluate.load("mae", "multilist")
>>> predictions = [[0.5, 1], [-1, 1], [7, -6]]
>>> references = [[0, 2], [-1, 2], [8, -5]]
>>> results = mae_metric.compute(predictions=predictions, references=references)
>>> print(results)
{'mae': 0.75}
>>> results = mae_metric.compute(predictions=predictions, references=references, multioutput='raw_values')
>>> print(results)
{'mae': array([0.5, 1. ])}
Limitations and Bias
One limitation of MAE is that the relative size of the error is not always obvious, meaning that it can be difficult to tell a big error from a smaller one -- metrics such as Mean Absolute Percentage Error (MAPE) have been proposed to calculate MAE in percentage terms.
Also, since it calculates the mean, MAE may underestimate the impact of big, but infrequent, errors -- metrics such as the Root Mean Square Error (RMSE) compensate for this by taking the root of error values.
Citation(s)
@article{scikit-learn,
  title={Scikit-learn: Machine Learning in {P}ython},
  author={Pedregosa, F. and Varoquaux, G. and Gramfort, A. and Michel, V.
         and Thirion, B. and Grisel, O. and Blondel, M. and Prettenhofer, P.
         and Weiss, R. and Dubourg, V. and Vanderplas, J. and Passos, A. and
         Cournapeau, D. and Brucher, M. and Perrot, M. and Duchesnay, E.},
  journal={Journal of Machine Learning Research},
  volume={12},
  pages={2825--2830},
  year={2011}
}
@article{willmott2005advantages,
  title={Advantages of the mean absolute error (MAE) over the root mean square error (RMSE) in assessing average model performance},
  author={Willmott, Cort J and Matsuura, Kenji},
  journal={Climate research},
  volume={30},
  number={1},
  pages={79--82},
  year={2005}
}