Spaces:
Runtime error
A newer version of the Streamlit SDK is available:
1.39.0
title: Electricity Price
emoji: 🦀
colorFrom: yellow
colorTo: indigo
sdk: streamlit
sdk_version: 1.34.0
app_file: app.py
pinned: false
Msc. BDS Module - Data Engineering and Machine Learning Operations in Business (MLOPs) - EXAM ASSIGMENT
Expectation for the Assignment:
What is expected for the technical part of the project:
- A form of prediction system.
- Should be able to be retrained over time.
- Should be able to add on new data.
- Should be able to end up in a dashboard/interface.
Objectives:
This repository contains all notebooks and local data files for the final assignment in the module Data Engineering and Machine Learning Operations in Business ("MLOPs" in short).
The objective of this assignment is to build a prediction system that predicts the electricity prices in Denmark (area DK1) based on weather conditions, previous prices, and the Danish calendar.
Structure:
There are four notebooks in the folder "notebooks":
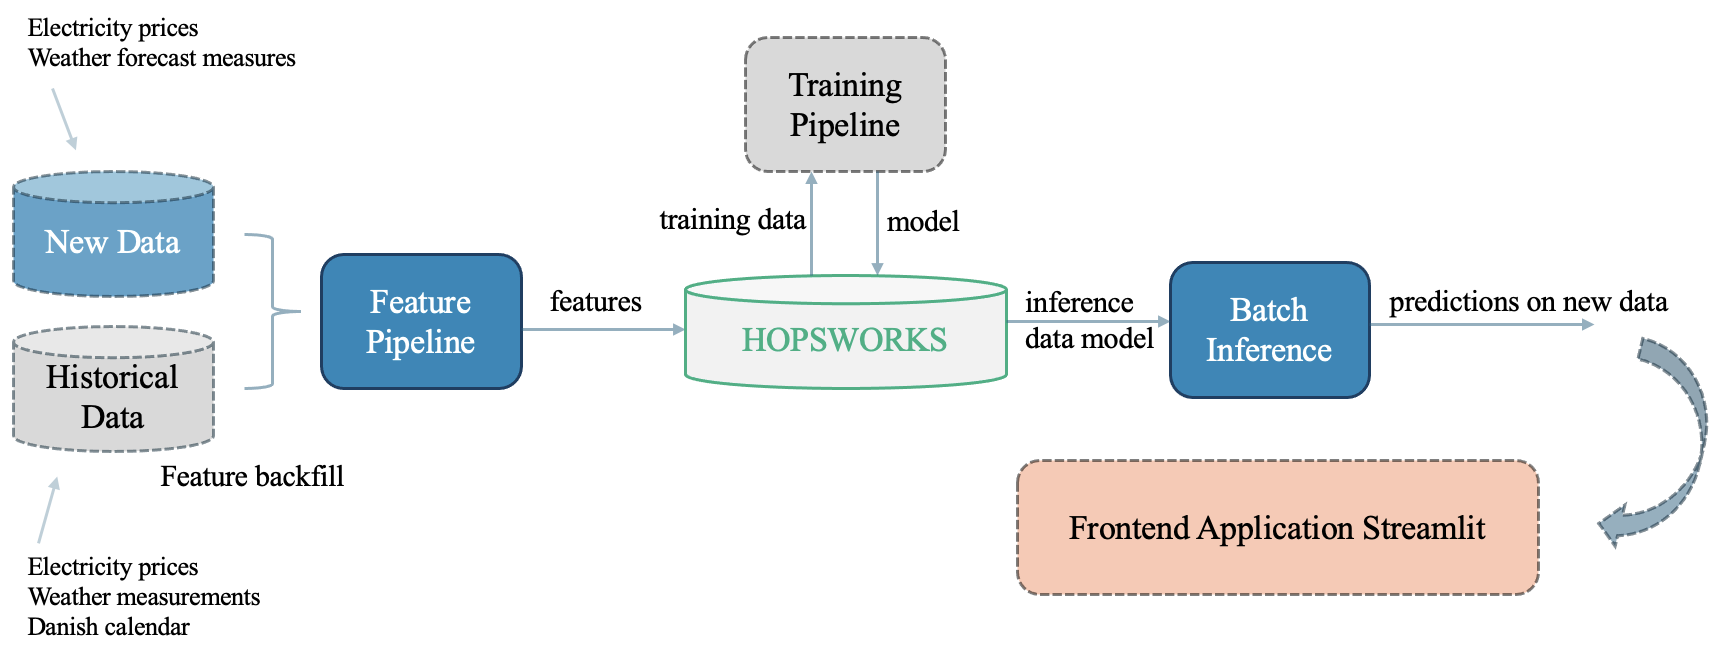
- Feature Backfill: Historical data is loaded and we engineer and create feature groups in Hopswork.
- Feature Pipeline: New data are parsed and inserted into the feature groups.
- Training Pipeline: Building feature view, training dataset split, training a model, and saving it in the Model Registry.
- Inference Pipeline: The trained model is retrieved from the model registry and used for batch inference and electricity price predictions on weather forecast measures.
The structure of the notebooks is largely inspired by Hopsworks tutorials. Inspiration for code snippets has been taken from the following advanced tutorials air_quality, electricity, and timeseries.
Hopsworks is used as the platform to store features in the Hopworks Feature Store and save a trained model in Hopworks Model Registry. Daily instance generation is done through Github Actions. Feature pipeline and batch inference are scheduled to run at 01:55 UTC everyday and then scheduled to sync to Huggingface Spaces at 02:01 UTC everyday.
Data Pipeline:
The overall architecture of the Electricity Pipeline is illustrated below. Inspiration is taken from MLOPs Lecture 2.
Data:
The data used comes from the following sources:
- Hourly electricity prices in Denmark per day from Energinet/Energidataservice.
- Different meteorological observations based on Aalborg Denmark from Open Meteo.
- Weather Forecast based on Aalborg Denmark also from Open Meteo.
- Danish calendar that categorizes dates into types based on whether it is a workday or not. This file is made manually by the group and is located in the "data" folder inside this repository.
See corresponding functions in the folder features. The functions include the initial API call and the following data preprocessing of the data.
Model Performance:
We initialize the XGBoost Regressor as the model used for training and prediction. The model is fitted to the train data and further evaluated using validation metric functions from the sklearn library.
| Validation metrics | Value |
|---|---|
| MSE | 0.059 |
| R^2 | 0.933 |
| MAE | 0.166 |
Frontend Application on 🤗 Hugging Face Spaces:
We have made a functional frontend application that visually demonstrates the project’s application in real-world scenarios (Streamlit app hosted on Huggingface)
