Transformers documentation
Keypoint Detection
Keypoint Detection
Keypoint detection identifies and locates specific points of interest within an image. These keypoints, also known as landmarks, represent meaningful features of objects, such as facial features or object parts. These models take an image input and return the following outputs:
- Keypoints and Scores: Points of interest and their confidence scores.
- Descriptors: A representation of the image region surrounding each keypoint, capturing its texture, gradient, orientation and other properties.
In this guide, we will show how to extract keypoints from images.
For this tutorial, we will use SuperPoint, a foundation model for keypoint detection.
from transformers import AutoImageProcessor, SuperPointForKeypointDetection
processor = AutoImageProcessor.from_pretrained("magic-leap-community/superpoint")
model = SuperPointForKeypointDetection.from_pretrained("magic-leap-community/superpoint")
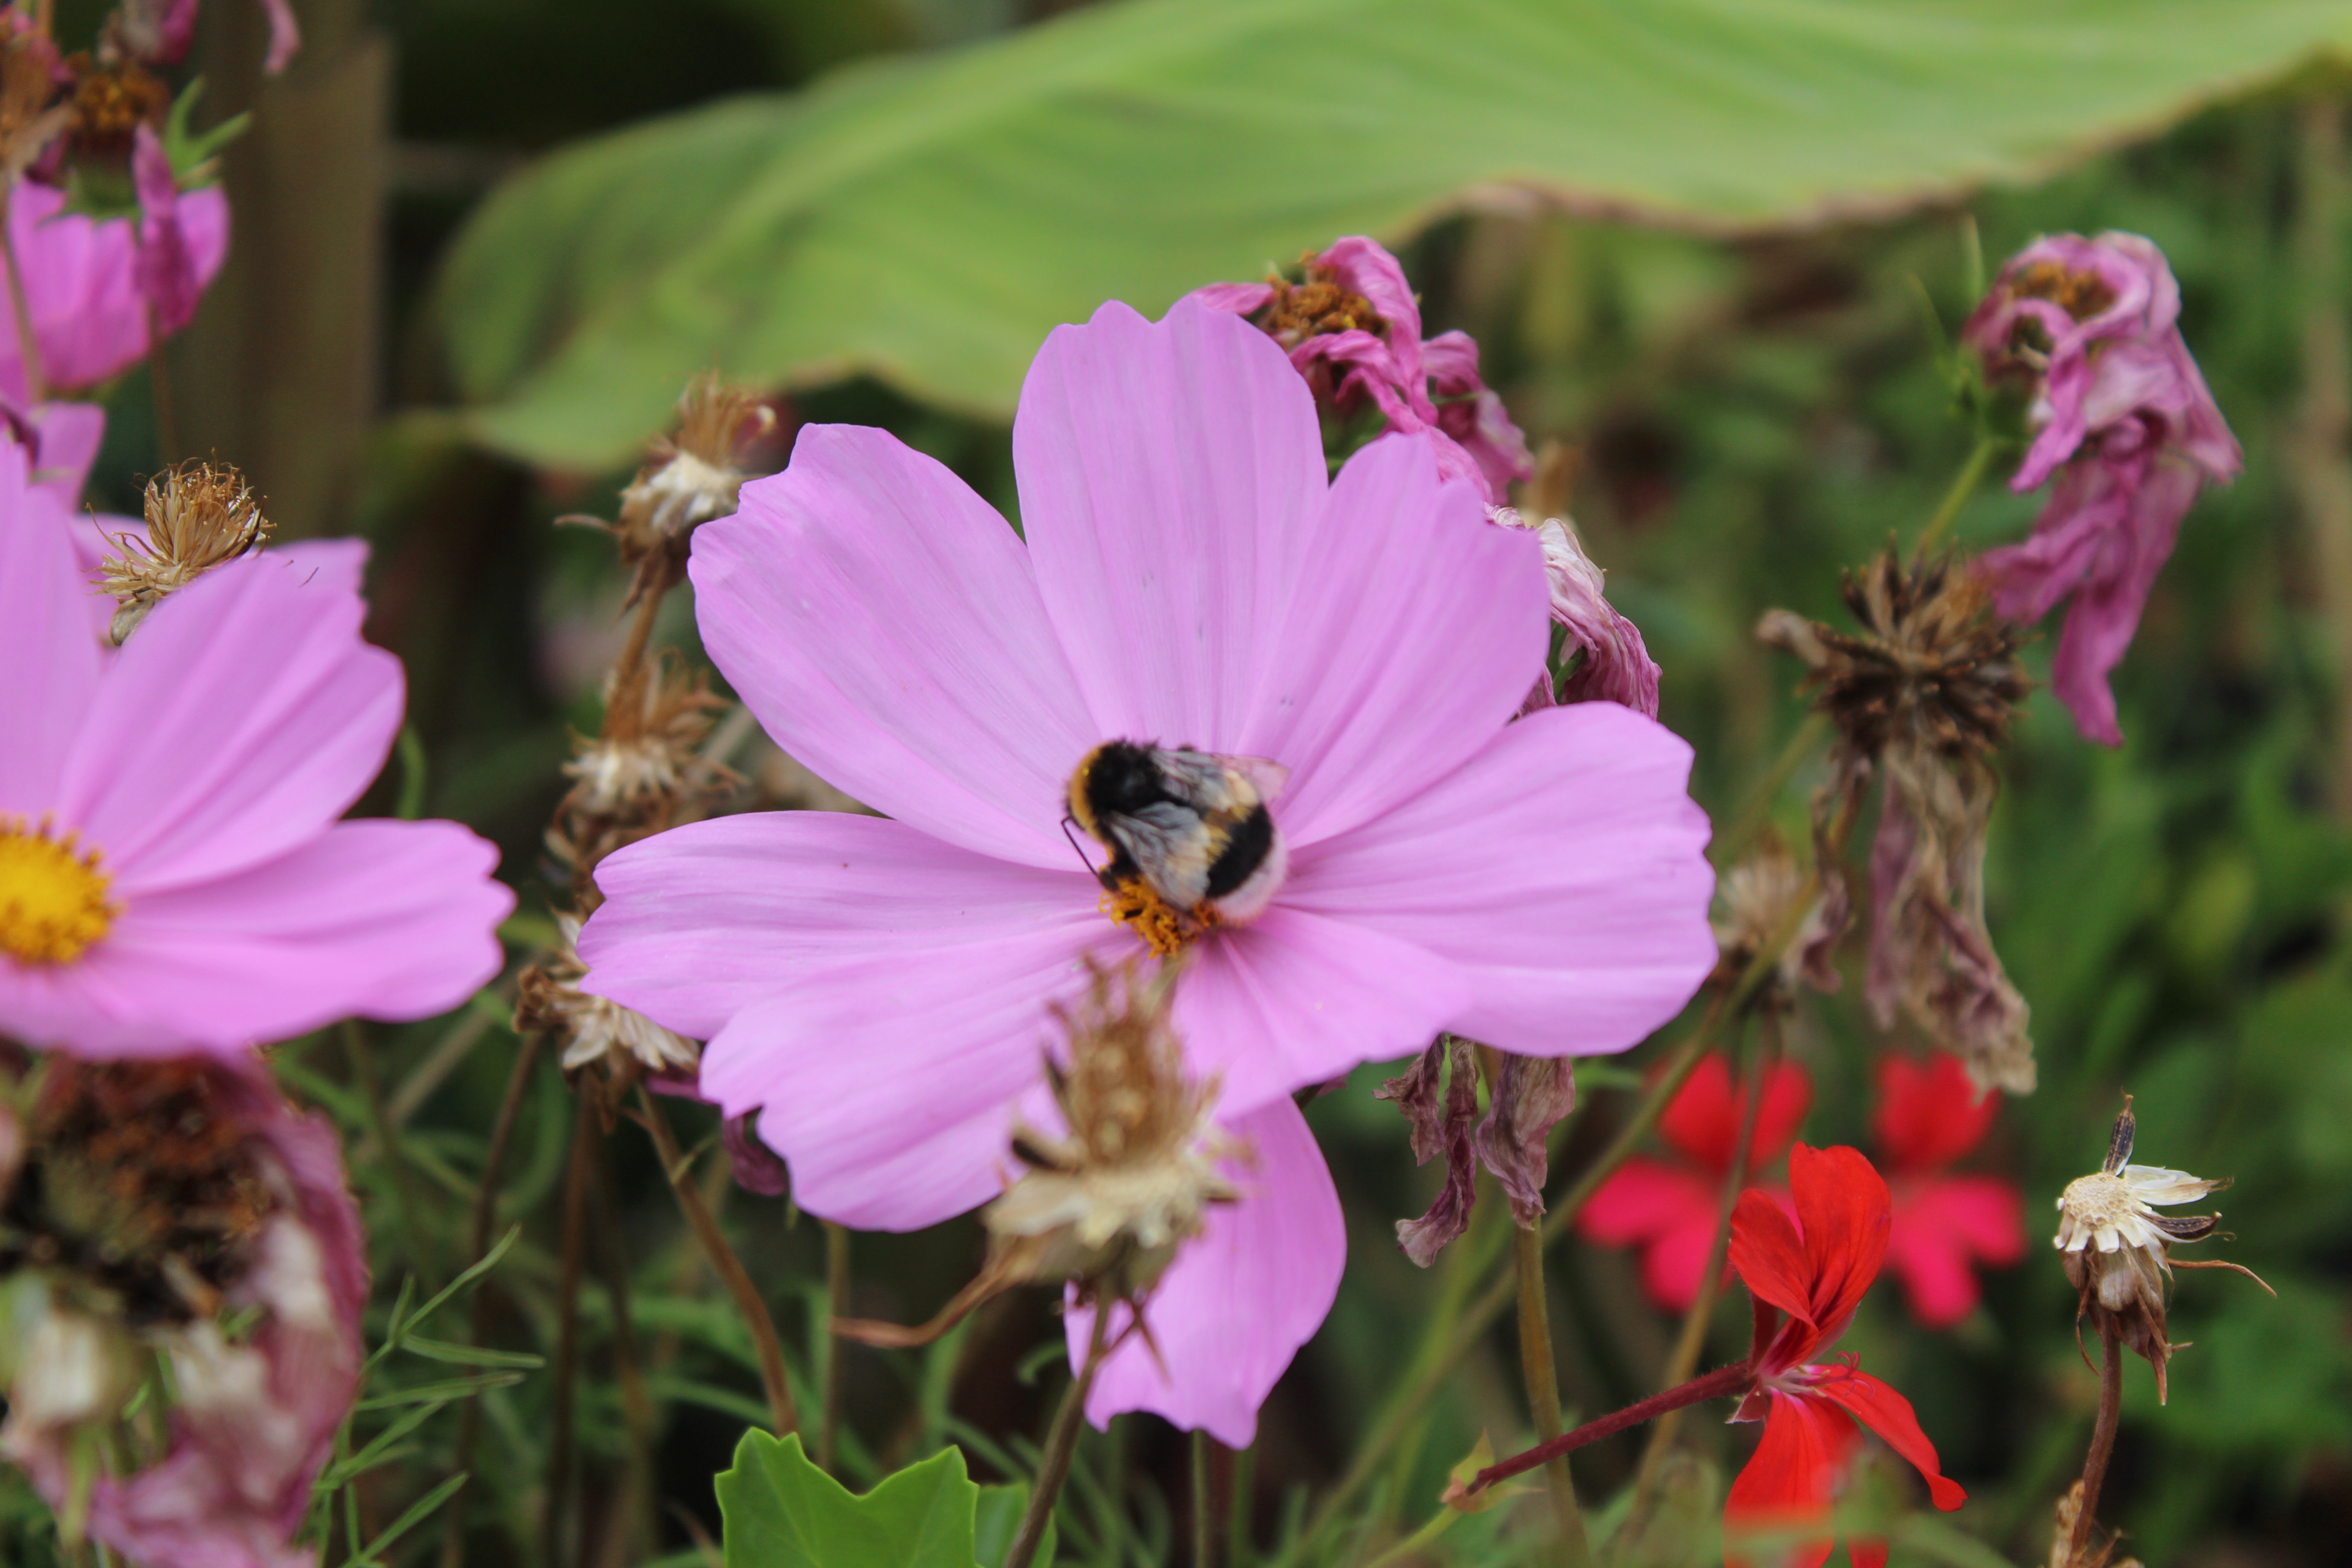
Let’s test the model on the images below.


import torch
from PIL import Image
import requests
import cv2


url_image_1 = "https://huggingface.co/datasets/huggingface/documentation-images/resolve/main/bee.jpg"
image_1 = Image.open(requests.get(url_image_1, stream=True).raw)
url_image_2 = "https://huggingface.co/datasets/huggingface/documentation-images/resolve/main/cats.png"
image_2 = Image.open(requests.get(url_image_2, stream=True).raw)

images = [image_1, image_2]
We can now process our inputs and infer.
inputs = processor(images,return_tensors="pt").to(model.device, model.dtype)
outputs = model(**inputs)
The model output has relative keypoints, descriptors, masks and scores for each item in the batch. The mask highlights areas of the image where keypoints are present.
SuperPointKeypointDescriptionOutput(loss=None, keypoints=tensor([[[0.0437, 0.0167],
         [0.0688, 0.0167],
         [0.0172, 0.0188],
         ...,
         [0.5984, 0.9812],
         [0.6953, 0.9812]]]),
         scores=tensor([[0.0056, 0.0053, 0.0079,  ..., 0.0125, 0.0539, 0.0377],
        [0.0206, 0.0058, 0.0065,  ..., 0.0000, 0.0000, 0.0000]],
       grad_fn=<CopySlices>), descriptors=tensor([[[-0.0807,  0.0114, -0.1210,  ..., -0.1122,  0.0899,  0.0357],
         [-0.0807,  0.0114, -0.1210,  ..., -0.1122,  0.0899,  0.0357],
         [-0.0807,  0.0114, -0.1210,  ..., -0.1122,  0.0899,  0.0357],
         ...],
       grad_fn=<CopySlices>), mask=tensor([[1, 1, 1,  ..., 1, 1, 1],
        [1, 1, 1,  ..., 0, 0, 0]], dtype=torch.int32), hidden_states=None)
To plot actual keypoints in the image, we need to postprocess the output. To do so, we have to pass the actual image sizes to post_process_keypoint_detection along with outputs.
image_sizes = [(image.size[1], image.size[0]) for image in images]
outputs = processor.post_process_keypoint_detection(outputs, image_sizes)
The outputs are now a list of dictionaries where each dictionary is a processed output of keypoints, scores and descriptors.
[{'keypoints': tensor([[ 226,   57],
          [ 356,   57],
          [  89,   64],
          ...,
          [3604, 3391]], dtype=torch.int32),
  'scores': tensor([0.0056, 0.0053, ...], grad_fn=<IndexBackward0>),
  'descriptors': tensor([[-0.0807,  0.0114, -0.1210,  ..., -0.1122,  0.0899,  0.0357],
          [-0.0807,  0.0114, -0.1210,  ..., -0.1122,  0.0899,  0.0357]],
         grad_fn=<IndexBackward0>)},
    {'keypoints': tensor([[ 46,   6],
          [ 78,   6],
          [422,   6],
          [206, 404]], dtype=torch.int32),
  'scores': tensor([0.0206, 0.0058, 0.0065, 0.0053, 0.0070, ...,grad_fn=<IndexBackward0>),
  'descriptors': tensor([[-0.0525,  0.0726,  0.0270,  ...,  0.0389, -0.0189, -0.0211],
          [-0.0525,  0.0726,  0.0270,  ...,  0.0389, -0.0189, -0.0211]}]
We can use these to plot the keypoints.
import matplotlib.pyplot as plt
import torch

for i in range(len(images)):
  keypoints = outputs[i]["keypoints"]
  scores = outputs[i]["scores"]
  descriptors = outputs[i]["descriptors"]
  keypoints = outputs[i]["keypoints"].detach().numpy()
  scores = outputs[i]["scores"].detach().numpy()
  image = images[i]
  image_width, image_height = image.size

  plt.axis('off')
  plt.imshow(image)
  plt.scatter(
      keypoints[:, 0],
      keypoints[:, 1],
      s=scores * 100,
      c='cyan',
      alpha=0.4
  )
  plt.show()
Below you can see the outputs.

