Inference Endpoints (dedicated) documentation
Analytics and Metrics
Analytics and Metrics
The Analytics page is like the control center for your deployed models. It tells you in real-time what’s going on, how many users are calling your models, about hardware usage, latencies, and much more. In this documentation we’ll dive into what each metric means and how to analyze the graphs.
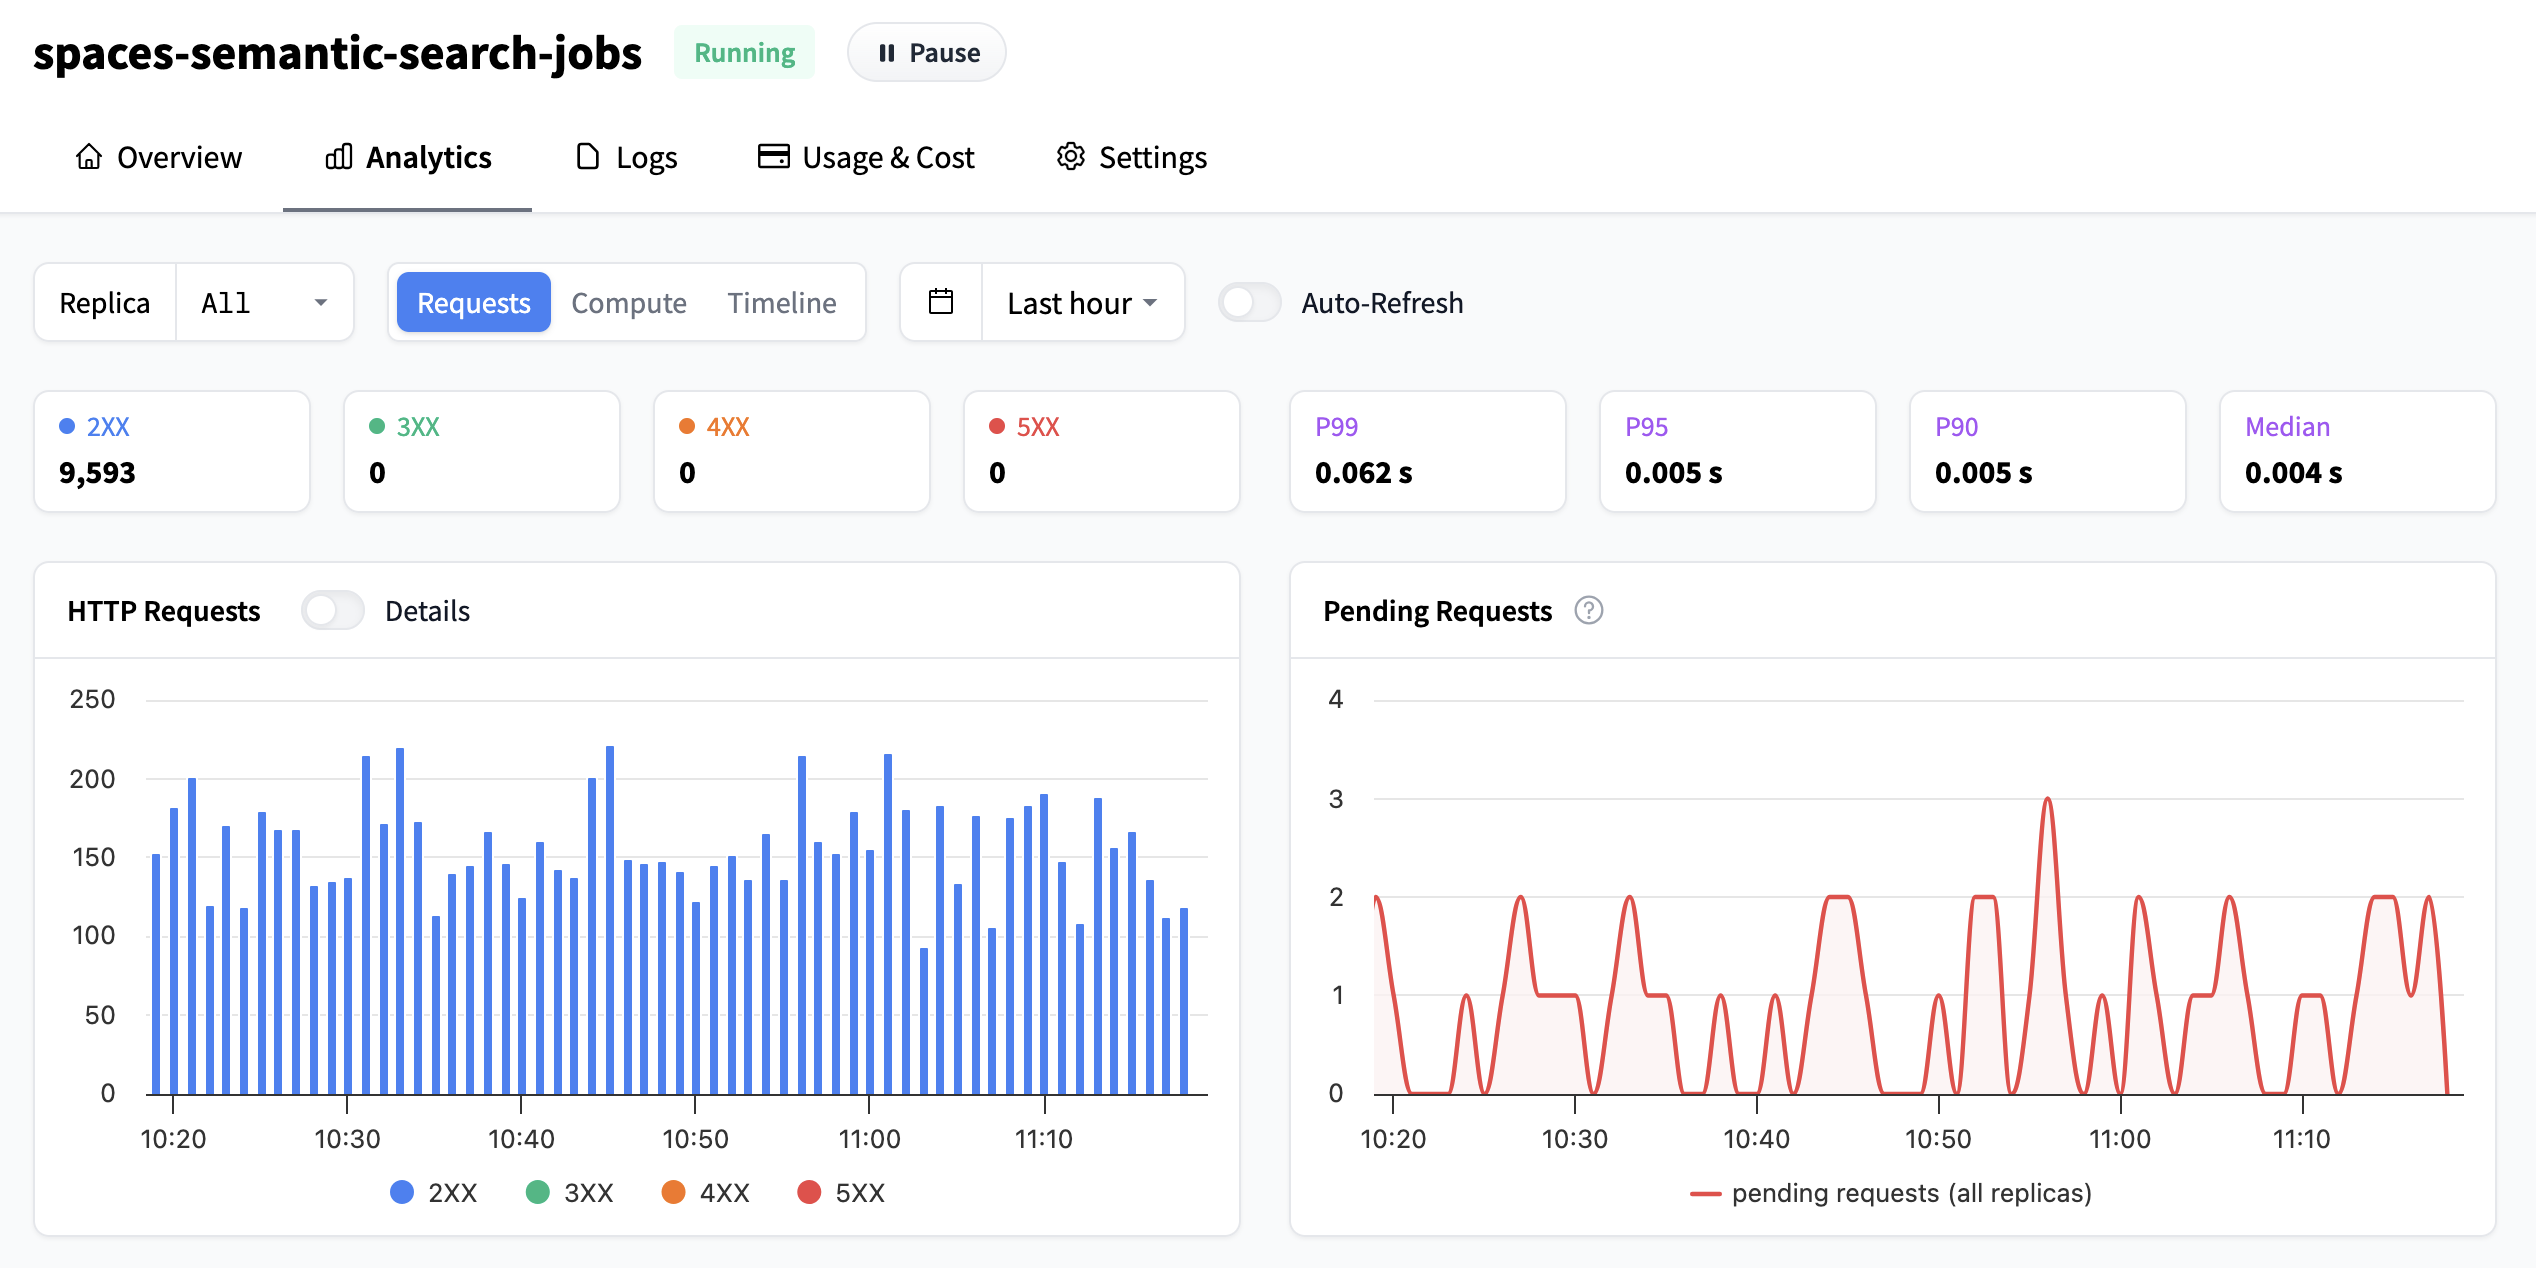
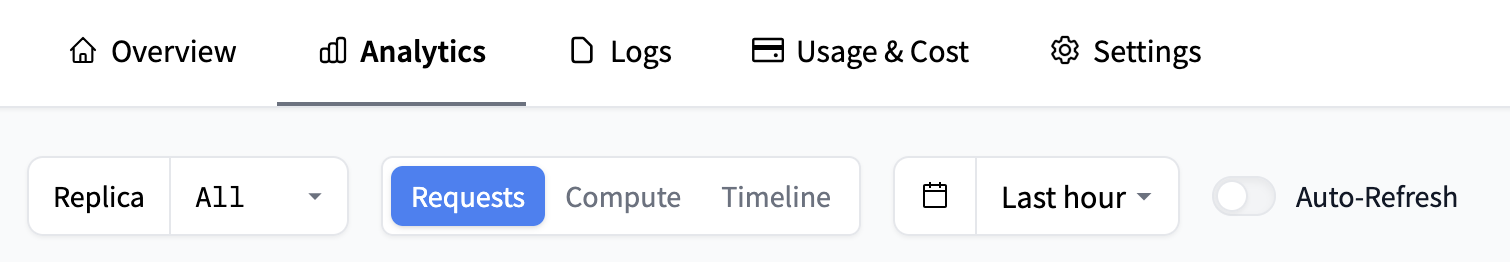
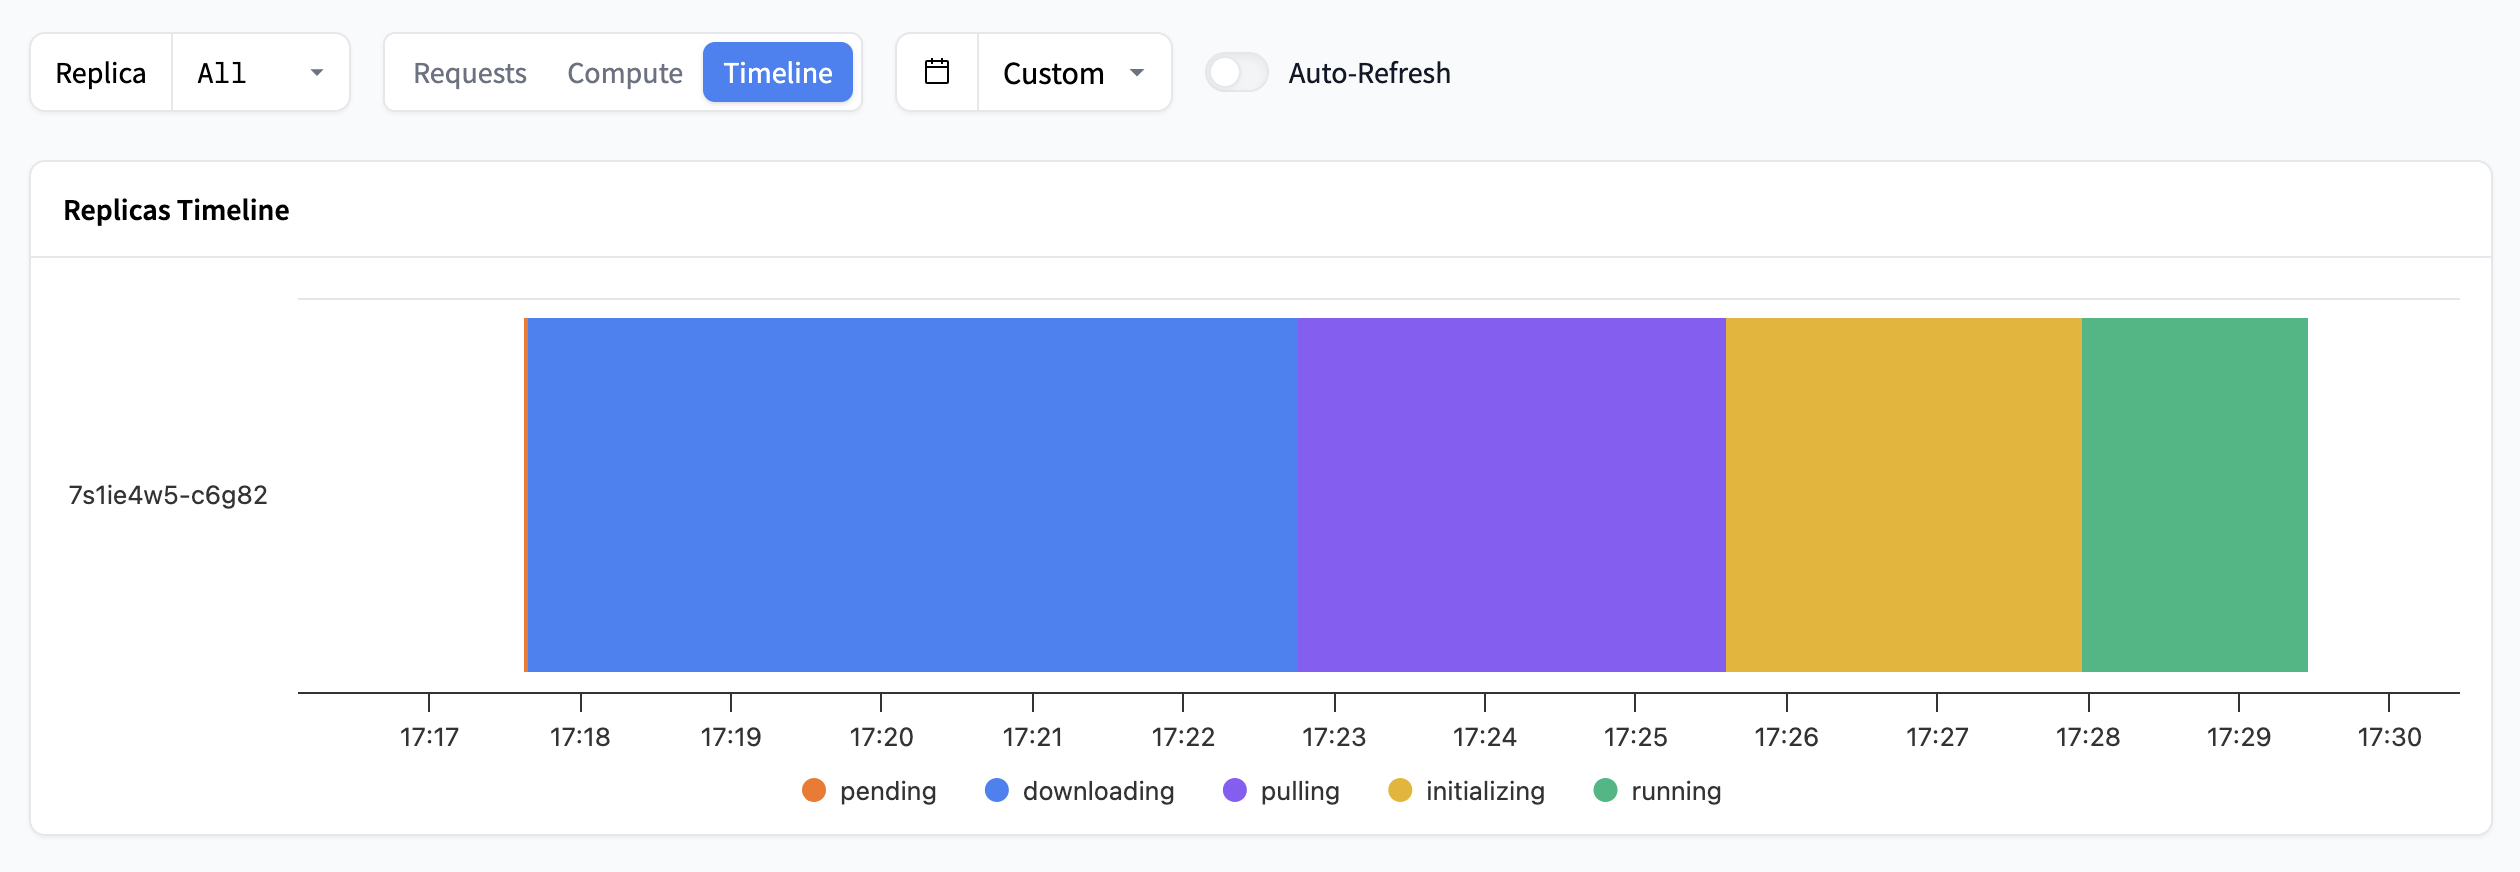
In the top bar, you can configure the high level view:
- Which replica to view metrics from: either an individual replica or all.
- If you want to view metrics related to requests, hardware, or timeline of replicas.
- Which time frame you’ll inspect the metrics, and this setting affects all graphs on the page. You can choose between any of the existing settings from the dropdown, or click-and-drag over any graph for a custom timeframe. You can also enable/disable auto refresh or view the metrics per replica or all.
Understanding the graphs
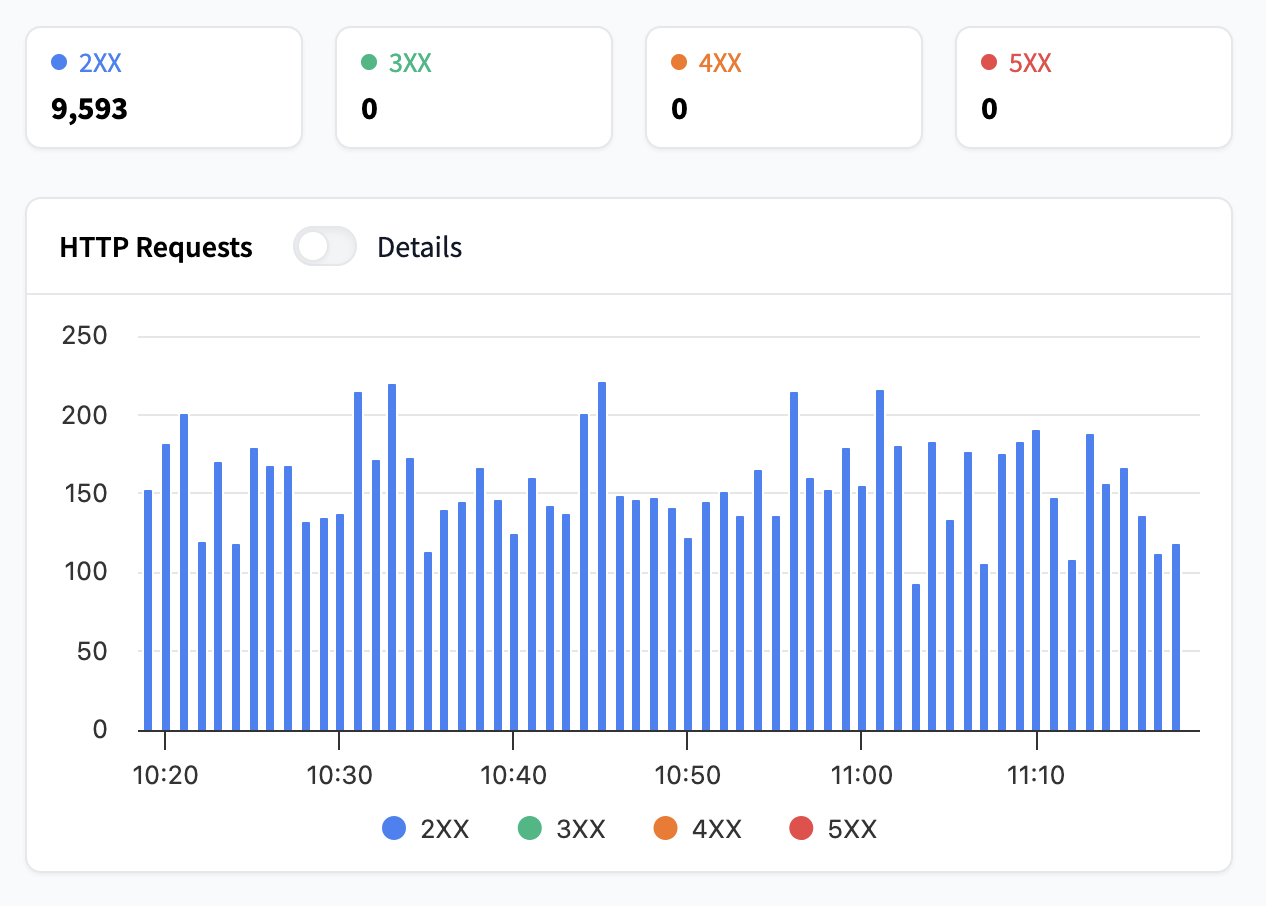
Number of (HTTP) Requests
The first graph at the top left shows you how many requests your Inference Endpoint has received. By default they are grouped by HTTP response classes, but by switching the toggle you can view them by individual status. As a reminder the HTTP response classes are:
- Informational responses (100-199): The server has received your request and is working on it. For example,
102 Processingmeans the server is still handling your request. - Successful responses (200-299): Your request was received and completed successfully. For example,
200 OKmeans everything worked as expected. - Redirection messages (300-399): The server is telling your client to look somewhere else for the information or to take another action. For example,
301 Moved Permanentlymeans the resource has a new address. - Client error responses (400-499): There was a problem with the request sent by your client (like a typo in the URL or missing data). For example,
404 Not Foundmeans the server couldn’t find what you asked for. - Server error responses (500-599): The server ran into an issue while trying to process your request. For example,
502 Bad Gatewaymeans the server got an invalid response from another server it tried to contact.
We recommend checking the MDN web docs for more information on individual status codes.
The boxes above the graph also show the % of requests in the respective response class.
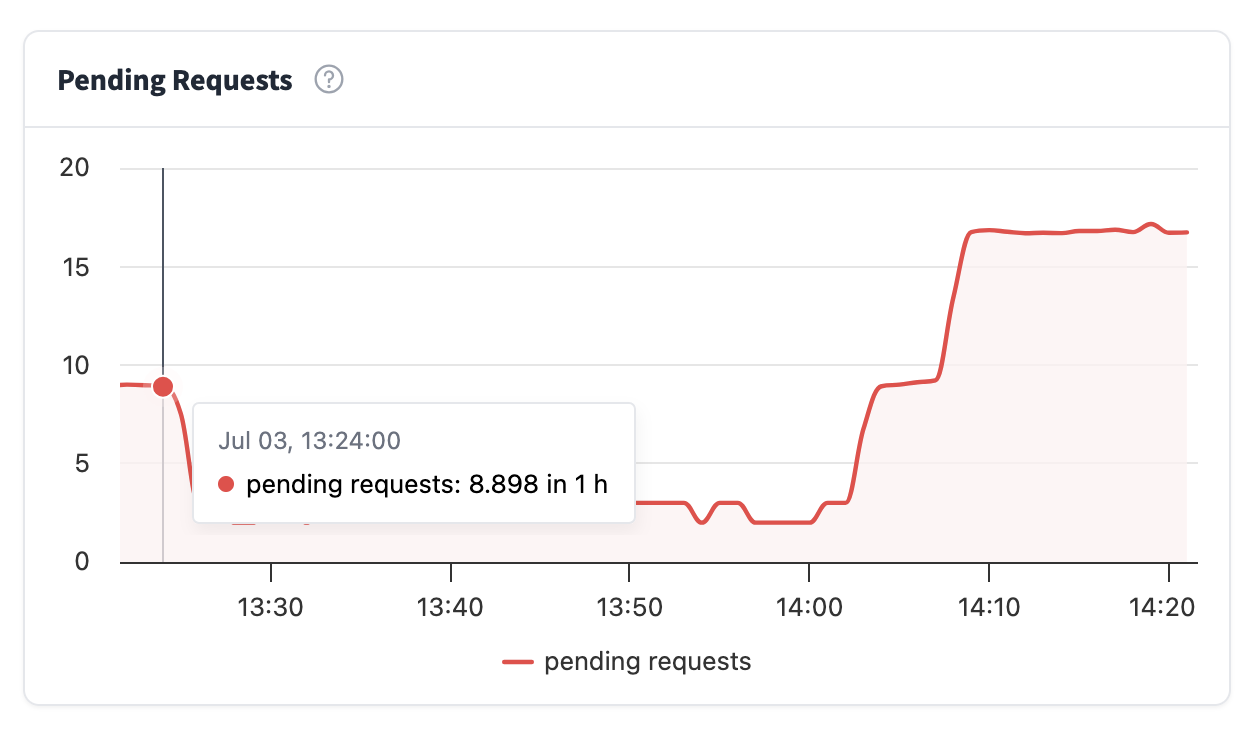
Pending Requests
Pending requests are requests that have not yet received an HTTP status, meaning they include in-flight requests and requests currently being processed. If this metric increases too much, it means that your requests are queuing up, and your users have to wait for requests to finish. In this case you should consider increasing your number of replicas or alternatively use autoscaling, you can read more about it in the autoscaling guide
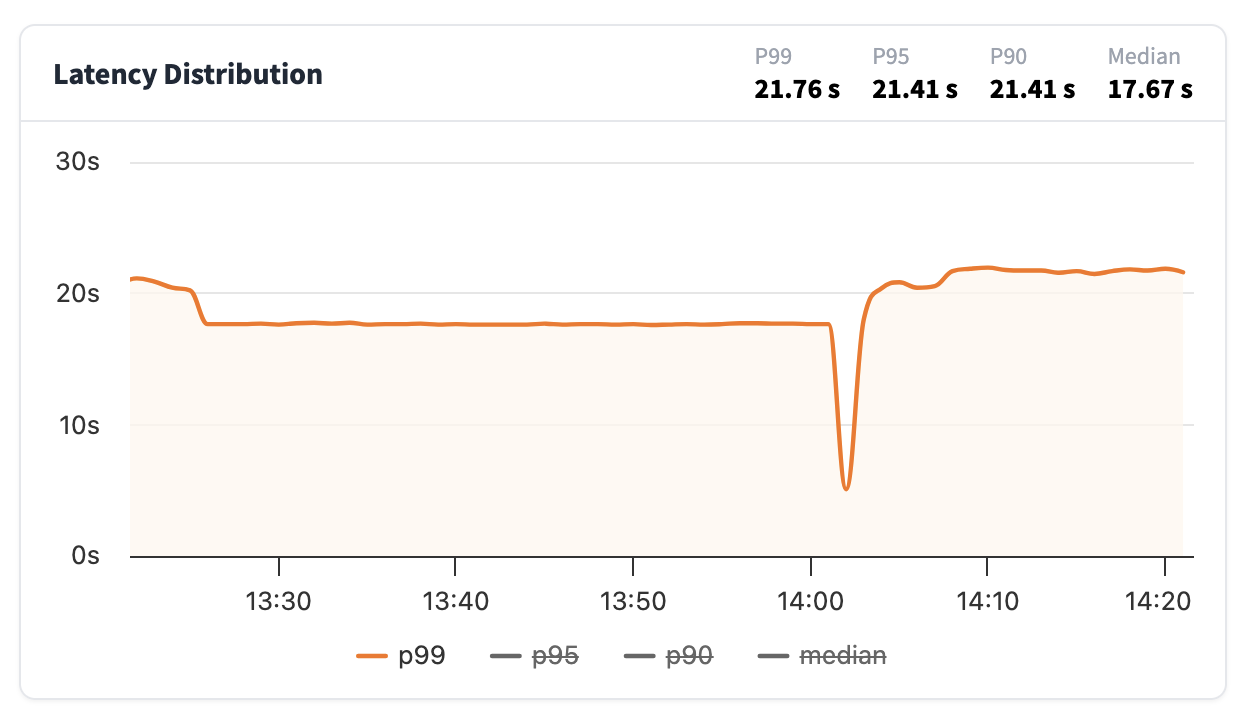
Latency Distribution
From this graph you’ll be able to see how long it takes for your Inference Endpoint to generate a response. Latency is reported as:
- p99: meaning that 99% of all requests were faster than this value
- p95: meaning that 95% of all requests were faster than this value
- p90: meaning that 90% of all requests were faster than this value
- median: meaning that 50% of all requests were faster than this value
Usually a good metric is also to look at how big the difference is between the median and p99. The closer the values are to each other, the more uniform the latency is, whereas if the difference is large, it means that the users of your Inference Endpoint have in general a fast response but the worst case latencies can be long.
Running Replicas
In the running replica graph, you’ll see how many running replicas you have during a point in time. The red line shows your current maximum replicas setting.
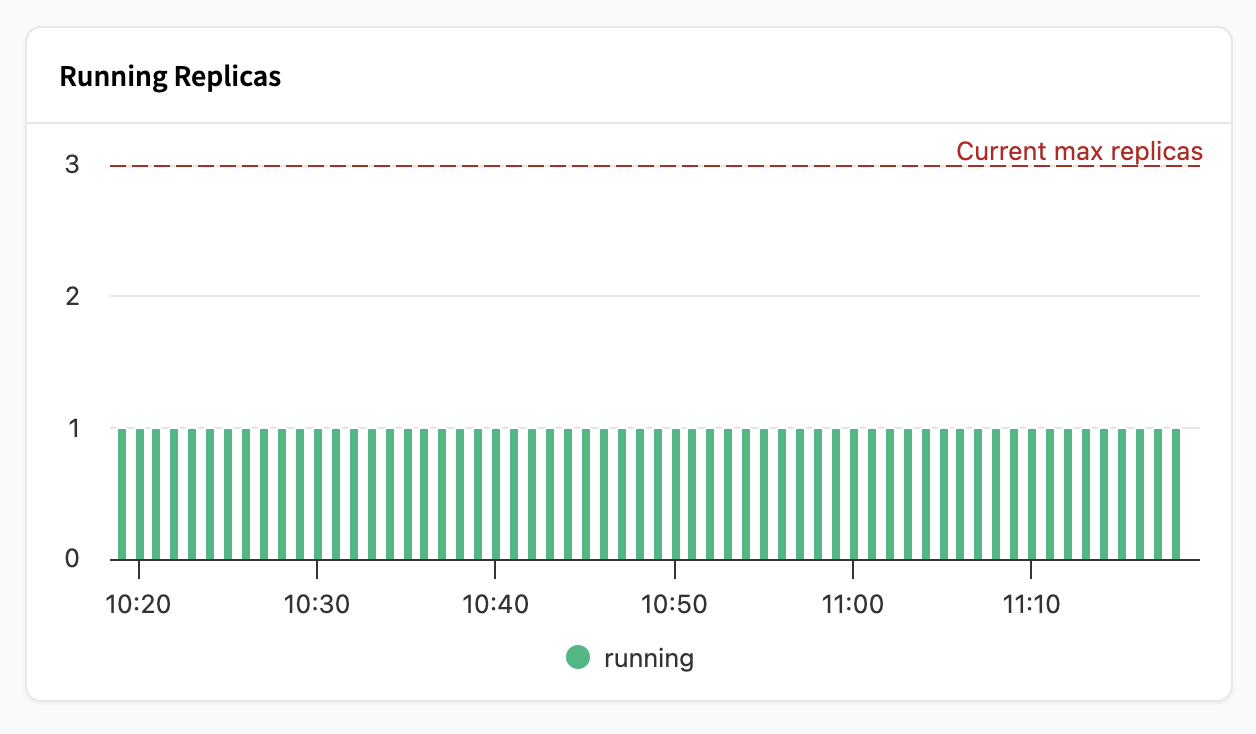
For a more advanced view of different statuses for individual replicas, going from pending all the way to running, you can toggle to the Timeline section. This is very useful to get a sense of how long it takes an Endpoint to become ready to serve requests.
Compute
These four graphs are dedicated to hardware usage. You’ll find:
- CPU usage: How much processing power is being used.
- Memory usage: How much RAM is being used.
- GPU usage: How much of the GPU’s processing power is being used.
- GPU Memory (VRAM) usage: How much GPU memory is being used.
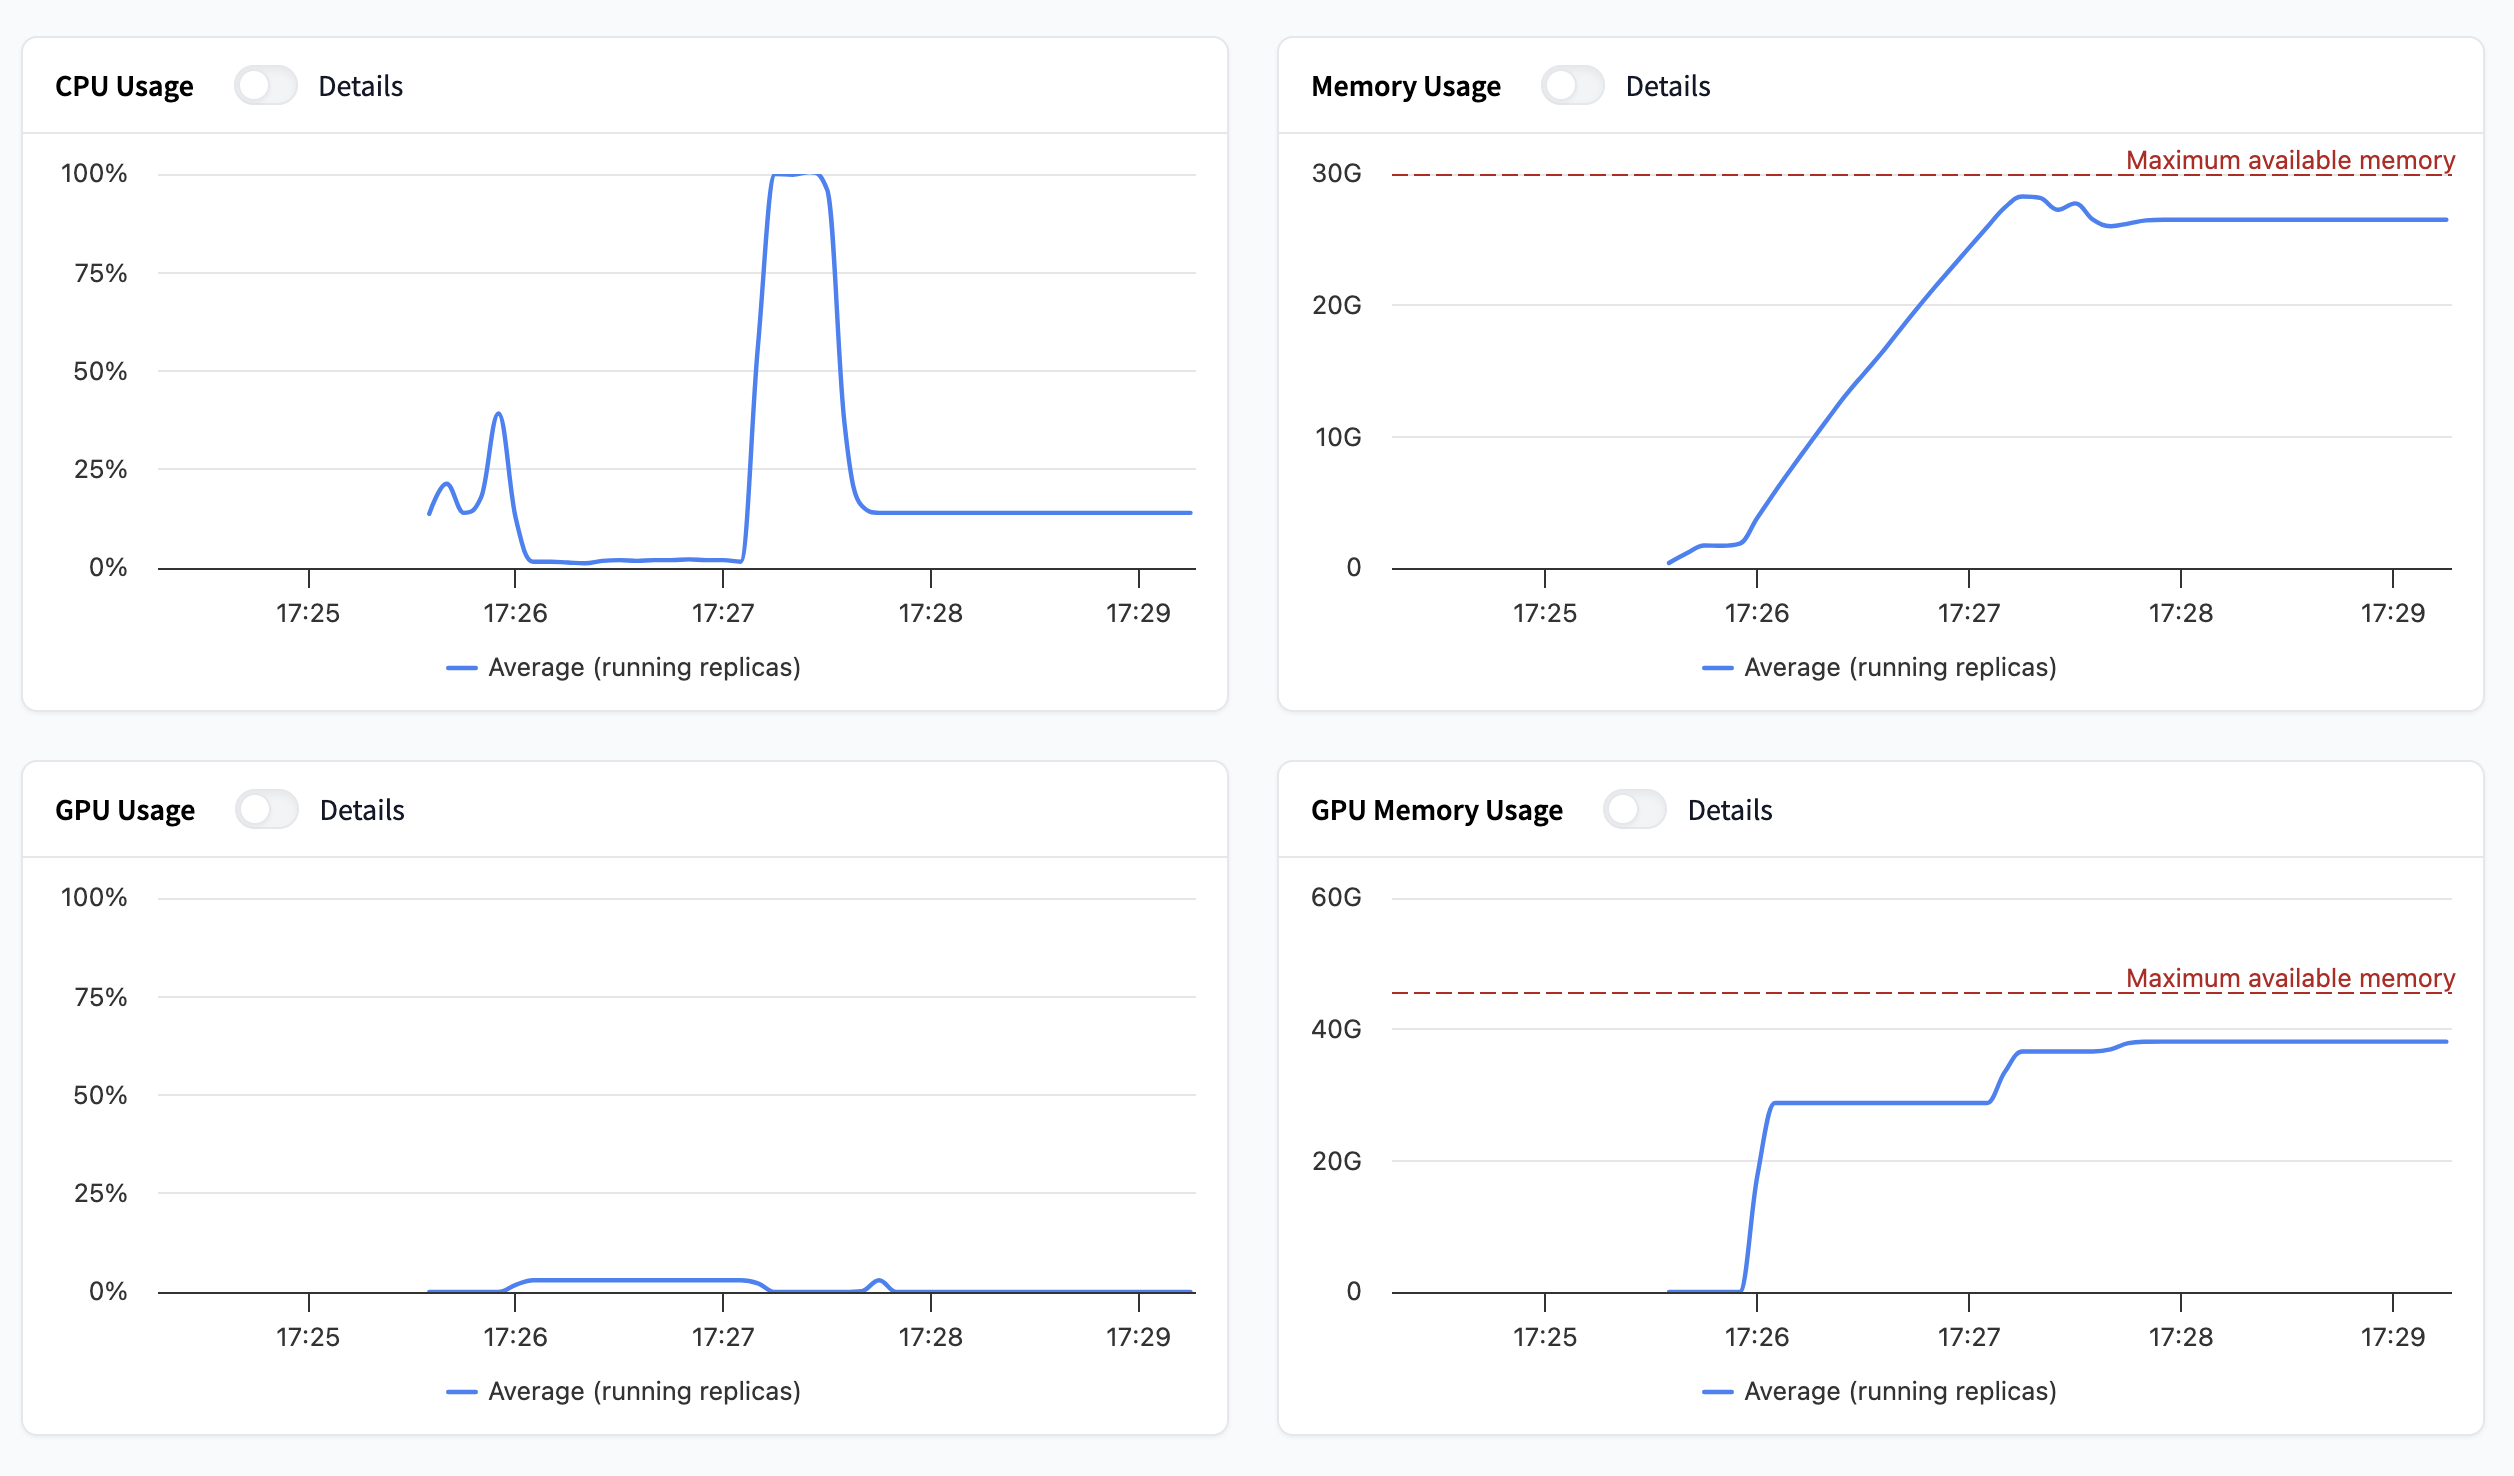
By toggling “details” you can either view the average or per replica value for the metric in question.
If you have autoscaling based on hardware utilization enabled, these are the metrics that determine your autoscaling behaviour. You can read more about autoscaling here
Create an integration with the Inference Endpoints OpenMetrics API
This feature is currently in Beta. You will need to be subscribed to Team or Enterprise to take advantage of this feature.
You can export real-time metrics from your Inference Endpoints into your own monitoring stack. The Metrics API exposes metrics in the OpenMetrics format, which is widely supported by observability tools such as Prometheus, Grafana, and Datadog.
This allows you to monitor in near real-time:
- Requests grouped by replica
- Latency distributions (p50, p95, etc.)
- Hardware metrics (CPU, GPU, memory, accelerator utilization)
Query metrics manually
You can use curl to query the metrics endpoint directly and inspect the raw data:
curl -X GET "https://api.endpoints.huggingface.cloud/v2/endpoint/{namespace}/{endpoint-name}/open-metrics" \
  -H "Authorization: Bearer YOUR_AUTH_TOKEN"
This will return metrics in OpenMetrics text format:
# HELP latency_distribution Latency distribution
# TYPE latency_distribution summary
latency_distribution{quantile="0.5"} 0.006339203
latency_distribution{quantile="0.9"} 0.007574241
latency_distribution{quantile="0.95"} 0.007994495
latency_distribution{quantile="0.99"} 0.020140918
latency_distribution_count 4
latency_distribution_sum 0.042048857
# HELP http_requests HTTP requests by code and replicas
# TYPE http_requests counter
http_requests{replica_id="fqwg7eri-hskoj",status_code="200"} 1152
http_requests{replica_id="q9cv26ut-3vo4s",status_code="200"} 1
# HELP cpu_usage_percent CPU percent
# TYPE cpu_usage_percent gauge
# UNIT cpu_usage_percent percent
Connect with your observability tools
OpenMetrics is widely supported across monitoring ecosystems. A few common options:
From there, you can set up dashboards, alerts, and reports to monitor endpoint performance.
Subscribe to Team or Enterprise
Your organization can sign up for the Team or Enterprise plan here 🚀 For any questions or feature requests, please email us at api-enterprise@huggingface.co
Update on GitHub