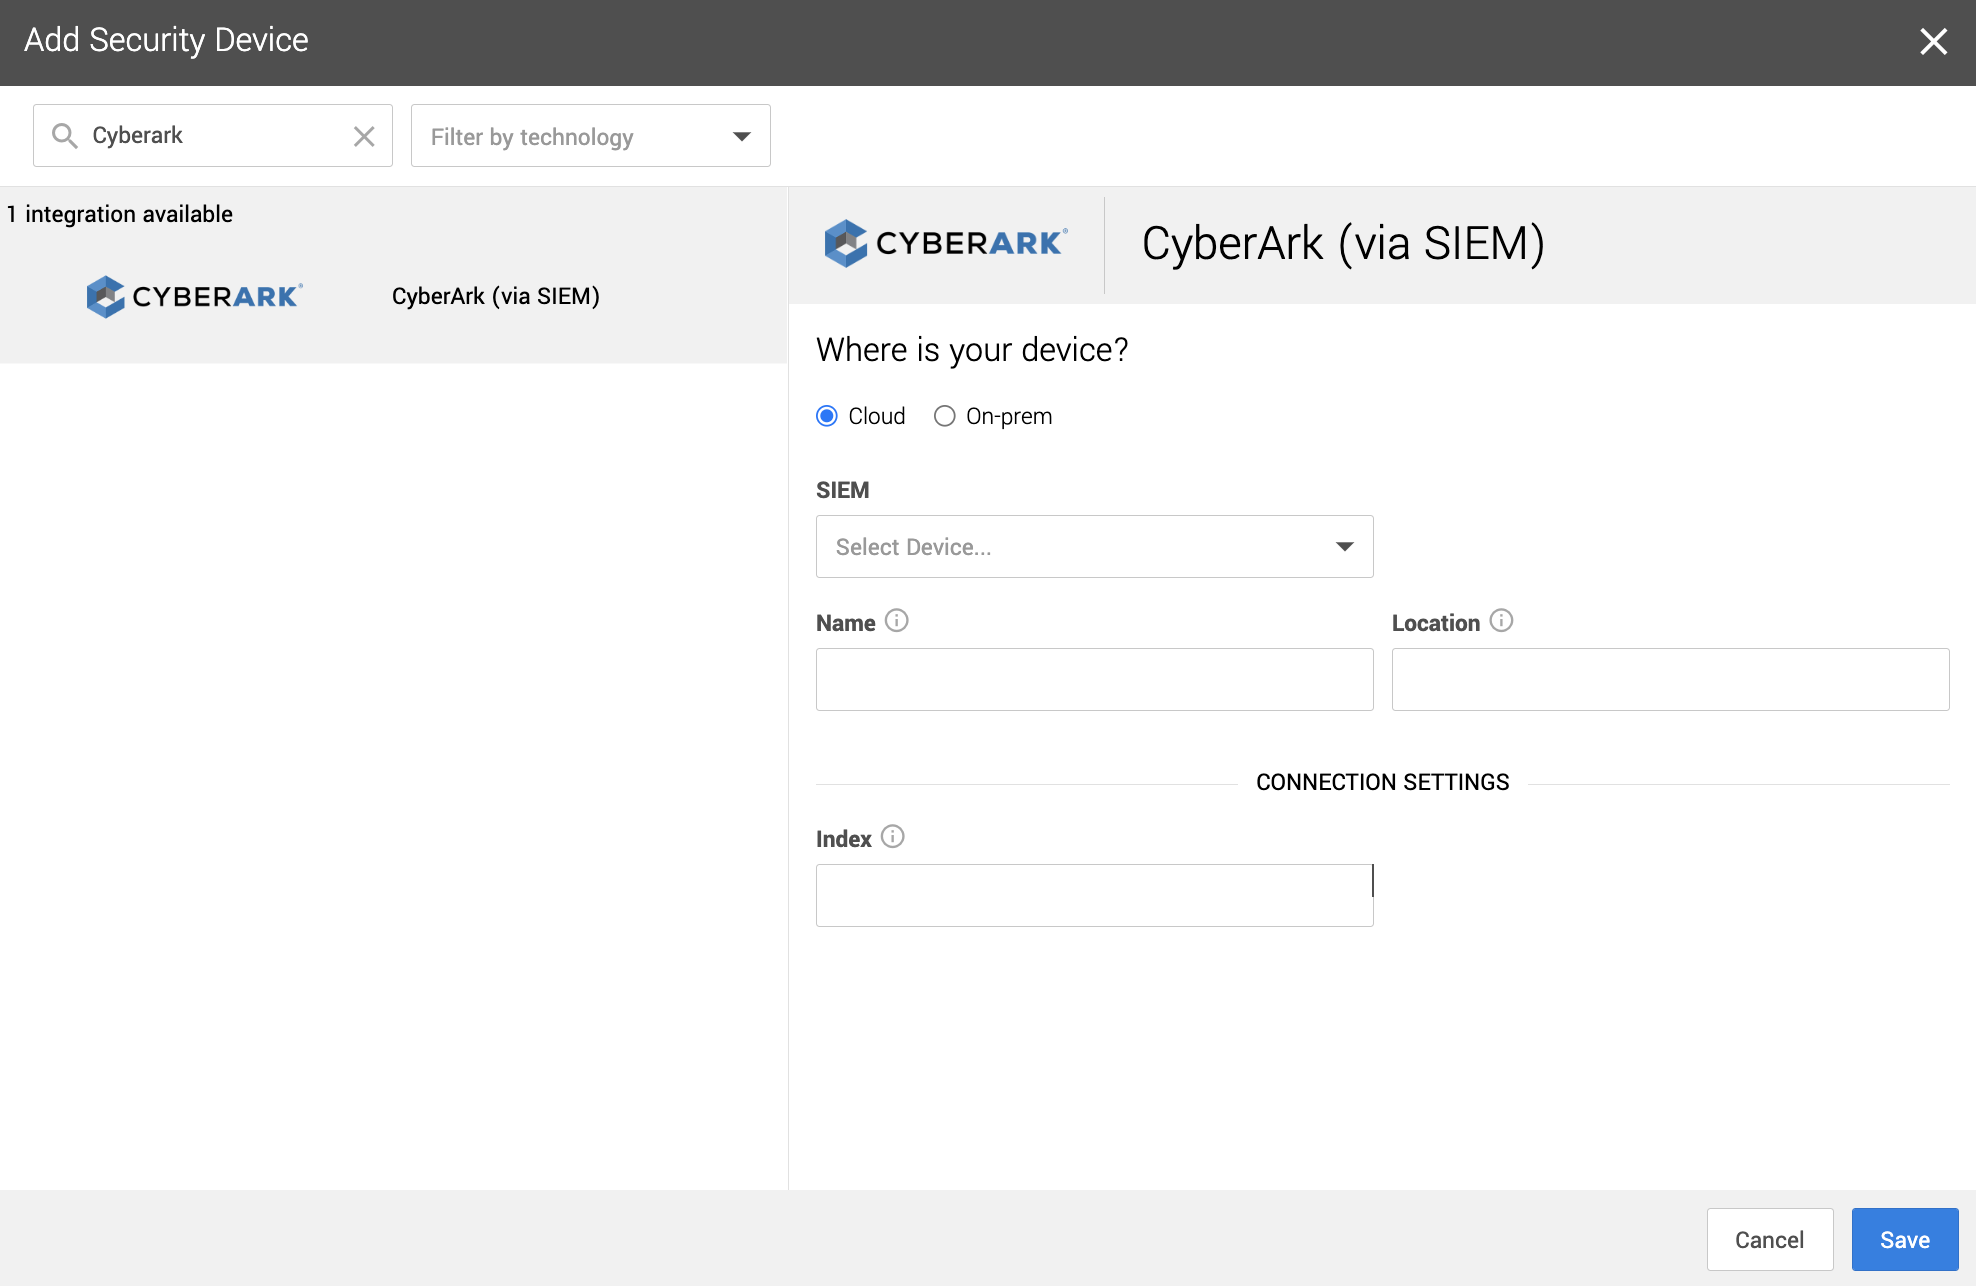
| {"title": "CyberArk via SIEM setup for Workbench", "url": "https://support.expel.io/hc/en-us/articles/11455981281299-CyberArk-via-SIEM-setup-for-Workbench", "date": "2022-11-21T21:23:05Z", "contents": "This procedure helps you to connect your CyberArk via SIEM to the Expel\nWorkbench. The procedure is to port in logs by creating a new Syslog source,\nconfiguring that source in Workbench, then configure your CyberArk via SIEM\ndevice in Workbench.\n\n### Note\n\nSome steps in this procedure vary greatly depending upon the SIEM-based\ntechnology you use.\n\n#### In this article\n\n * Step 1: Logging CyberArk to a desired SIEM\n\n * Step 2: Configure the SIEM in Workbench\n\n * Step 3: Configure CyberArk via SIEM in Workbench\n\n## Step 1: Logging CyberArk to a desired SIEM\n\nRefer to your SIEM documentation or work with your SIEM representative to port\nin CyberArk logs. You can also refer to the following web references for\ncreating a new Syslog source:\n\n * Splunk\n\n## Step 2: Configure the SIEM in Workbench\n\nThis link opens the Expel Knowledge Base section for connecting SIEM-based\ntechnology to Workbench. Follow the applicable article to configure your SIEM-\nbased tech and confirm that CyberArk logs are flowing through and available.\n\n## Step 3: Configure CyberArk via SIEM in Workbench\n\nNow that we have the correct access configured and noted the credentials, we\ncan integrate your tech with Workbench.\n\n 1. In a new browser tab, go to https://workbench.expel.io/settings/security-devices?setupIntegration=cyberark_siem.\n\n \n--- \n \n 2. Fill in the device fields like this:\n\n * For SIEM, select the SIEM that was onboarded in Step 2.\n\n * For Name, type the host name of the CyberArk device.\n\n * For Location, type the geographic location of the device.\n\n 3. Fill in the Connection Settings field based on the Splunk SIEM selected:\n\n * For Index, type in the Splunk index where the logs are located.\n\n 4. Click Save.\n\nYou can see if the device is healthy on the Security Devices page. It may take\na few minutes to see the device listed as healthy.\n\nTo check if alerts are coming through, navigate to the Alerts Analysis page.\nScroll to the device you want to check and click View alerts. Switch to grid\nview, then check the list for device alerts. It can take 36 to 72 hours for\nalerts to appear after setup, as we tune your device.\n\n"} |