| | |
| | """ |
| | Production EDA: Analyze data directly from Qdrant Cloud. |
| | |
| | Queries the production vector store to generate accurate statistics |
| | and visualizations. This ensures EDA reports match deployed data. |
| | |
| | Usage: |
| | python scripts/eda.py |
| | make eda |
| | |
| | Requires: |
| | QDRANT_URL and QDRANT_API_KEY environment variables. |
| | """ |
| |
|
| | from __future__ import annotations |
| |
|
| | import os |
| | import sys |
| | from collections import Counter |
| | from pathlib import Path |
| |
|
| | from dotenv import load_dotenv |
| |
|
| | load_dotenv() |
| |
|
| | |
| | if not os.getenv("QDRANT_URL"): |
| | print("ERROR: QDRANT_URL not set. Cannot run production EDA.") |
| | print("Set QDRANT_URL and QDRANT_API_KEY in .env or environment.") |
| | sys.exit(1) |
| |
|
| | import matplotlib.pyplot as plt |
| | import numpy as np |
| |
|
| | from sage.adapters.vector_store import get_client, get_collection_info |
| | from sage.config import COLLECTION_NAME, CHARS_PER_TOKEN |
| |
|
| | FIGURES_DIR = Path("assets") |
| | FIGURES_DIR.mkdir(parents=True, exist_ok=True) |
| |
|
| | REPORTS_DIR = Path("reports") |
| | REPORTS_DIR.mkdir(exist_ok=True) |
| |
|
| | |
| | plt.style.use("seaborn-v0_8-whitegrid") |
| | plt.rcParams.update( |
| | { |
| | "figure.figsize": (10, 5), |
| | "figure.dpi": 100, |
| | "savefig.dpi": 300, |
| | "savefig.bbox": "tight", |
| | "savefig.pad_inches": 0.1, |
| | "font.size": 11, |
| | "axes.titlesize": 12, |
| | "axes.labelsize": 11, |
| | "figure.autolayout": True, |
| | } |
| | ) |
| |
|
| | PRIMARY_COLOR = "#05A0D1" |
| | SECONDARY_COLOR = "#FF9900" |
| | FIGURE_SIZE_WIDE = (12, 5) |
| |
|
| |
|
| | def scroll_all_payloads(client, batch_size: int = 1000, limit: int | None = None): |
| | """ |
| | Scroll through all points in the collection and yield payloads. |
| | |
| | Args: |
| | client: Qdrant client. |
| | batch_size: Points per scroll request. |
| | limit: Optional max points to retrieve (None = all). |
| | |
| | Yields: |
| | Payload dicts from each point. |
| | """ |
| | offset = None |
| | total = 0 |
| |
|
| | while True: |
| | results = client.scroll( |
| | collection_name=COLLECTION_NAME, |
| | limit=batch_size, |
| | offset=offset, |
| | with_payload=True, |
| | with_vectors=False, |
| | ) |
| |
|
| | points, next_offset = results |
| |
|
| | if not points: |
| | break |
| |
|
| | for point in points: |
| | yield point.payload |
| | total += 1 |
| | if limit and total >= limit: |
| | return |
| |
|
| | offset = next_offset |
| | if offset is None: |
| | break |
| |
|
| |
|
| | def compute_stats(client, sample_size: int | None = None) -> dict: |
| | """ |
| | Compute statistics from production Qdrant data. |
| | |
| | Args: |
| | client: Qdrant client. |
| | sample_size: Optional limit for faster iteration. |
| | |
| | Returns: |
| | Dict with computed statistics. |
| | """ |
| | print("Scanning Qdrant collection...") |
| |
|
| | ratings = [] |
| | text_lengths = [] |
| | timestamps = [] |
| | product_ids = set() |
| | review_ids = set() |
| | chunks_per_review = {} |
| |
|
| | for i, payload in enumerate(scroll_all_payloads(client, limit=sample_size)): |
| | if i % 10000 == 0 and i > 0: |
| | print(f" Processed {i:,} chunks...") |
| |
|
| | ratings.append(payload.get("rating", 0)) |
| | text_lengths.append(len(payload.get("text", ""))) |
| | timestamps.append(payload.get("timestamp", 0)) |
| | product_ids.add(payload.get("product_id")) |
| | review_ids.add(payload.get("review_id")) |
| |
|
| | |
| | review_id = payload.get("review_id") |
| | total_chunks = payload.get("total_chunks", 1) |
| | if review_id: |
| | chunks_per_review[review_id] = total_chunks |
| |
|
| | print(f" Scanned {len(ratings):,} total chunks") |
| |
|
| | |
| | rating_dist = Counter(ratings) |
| | chunk_dist = Counter(chunks_per_review.values()) |
| |
|
| | |
| | token_lengths = [length // CHARS_PER_TOKEN for length in text_lengths] |
| |
|
| | return { |
| | "total_chunks": len(ratings), |
| | "unique_reviews": len(review_ids), |
| | "unique_products": len(product_ids), |
| | "ratings": ratings, |
| | "rating_dist": dict(sorted(rating_dist.items())), |
| | "text_lengths": text_lengths, |
| | "token_lengths": token_lengths, |
| | "timestamps": timestamps, |
| | "chunks_per_review": list(chunks_per_review.values()), |
| | "chunk_dist": dict(sorted(chunk_dist.items())), |
| | } |
| |
|
| |
|
| | def generate_figures(stats: dict) -> None: |
| | """Generate EDA figures from computed stats.""" |
| |
|
| | |
| | fig, ax = plt.subplots() |
| | rating_counts = stats["rating_dist"] |
| | ratings = list(rating_counts.keys()) |
| | counts = list(rating_counts.values()) |
| |
|
| | bars = ax.bar(ratings, counts, color=PRIMARY_COLOR, edgecolor="black") |
| | ax.set_xlabel("Rating") |
| | ax.set_ylabel("Chunk Count") |
| | ax.set_title("Rating Distribution (Production Data)") |
| | ax.set_xticks(ratings) |
| |
|
| | for bar, count in zip(bars, counts, strict=True): |
| | ax.text( |
| | bar.get_x() + bar.get_width() / 2, |
| | bar.get_height() + max(counts) * 0.01, |
| | f"{count:,}", |
| | ha="center", |
| | va="bottom", |
| | fontsize=9, |
| | ) |
| |
|
| | plt.savefig(FIGURES_DIR / "rating_distribution.png") |
| | plt.close() |
| | print(f" Saved: {FIGURES_DIR / 'rating_distribution.png'}") |
| |
|
| | |
| | fig, axes = plt.subplots(1, 2, figsize=FIGURE_SIZE_WIDE) |
| |
|
| | ax1 = axes[0] |
| | lengths = np.array(stats["text_lengths"]) |
| | ax1.hist(lengths.clip(max=2000), bins=50, color=PRIMARY_COLOR, edgecolor="black") |
| | ax1.set_xlabel("Characters") |
| | ax1.set_ylabel("Chunk Count") |
| | ax1.set_title("Chunk Length Distribution") |
| | ax1.axvline( |
| | np.median(lengths), |
| | color=SECONDARY_COLOR, |
| | linestyle="--", |
| | label=f"Median: {np.median(lengths):.0f}", |
| | ) |
| | ax1.legend() |
| |
|
| | ax2 = axes[1] |
| | tokens = np.array(stats["token_lengths"]) |
| | ax2.hist(tokens.clip(max=500), bins=50, color=SECONDARY_COLOR, edgecolor="black") |
| | ax2.set_xlabel("Estimated Tokens") |
| | ax2.set_ylabel("Chunk Count") |
| | ax2.set_title("Chunk Token Distribution") |
| | ax2.axvline( |
| | np.median(tokens), |
| | color=PRIMARY_COLOR, |
| | linestyle="--", |
| | label=f"Median: {np.median(tokens):.0f}", |
| | ) |
| | ax2.legend() |
| |
|
| | plt.savefig(FIGURES_DIR / "chunk_lengths.png") |
| | plt.close() |
| | print(f" Saved: {FIGURES_DIR / 'chunk_lengths.png'}") |
| |
|
| | |
| | fig, ax = plt.subplots() |
| | chunk_counts = stats["chunk_dist"] |
| | x = list(chunk_counts.keys()) |
| | y = list(chunk_counts.values()) |
| |
|
| | ax.bar(x, y, color=PRIMARY_COLOR, edgecolor="black") |
| | ax.set_xlabel("Chunks per Review") |
| | ax.set_ylabel("Number of Reviews") |
| | ax.set_title("Review Chunking Distribution") |
| |
|
| | plt.savefig(FIGURES_DIR / "chunks_per_review.png") |
| | plt.close() |
| | print(f" Saved: {FIGURES_DIR / 'chunks_per_review.png'}") |
| |
|
| | |
| | timestamps = [t for t in stats["timestamps"] if t and t > 0] |
| | if timestamps: |
| | from datetime import datetime |
| |
|
| | fig, ax = plt.subplots() |
| |
|
| | |
| | dates = [datetime.fromtimestamp(t / 1000) for t in timestamps] |
| | months = [d.strftime("%Y-%m") for d in dates] |
| | month_counts = Counter(months) |
| | sorted_months = sorted(month_counts.items()) |
| |
|
| | if len(sorted_months) > 24: |
| | |
| | sorted_months = sorted_months[-24:] |
| |
|
| | x = [m[0] for m in sorted_months] |
| | y = [m[1] for m in sorted_months] |
| |
|
| | ax.bar(range(len(x)), y, color=PRIMARY_COLOR) |
| | ax.set_xlabel("Month") |
| | ax.set_ylabel("Chunk Count") |
| | ax.set_title("Temporal Distribution") |
| | ax.set_xticks(range(0, len(x), max(1, len(x) // 6))) |
| | ax.set_xticklabels( |
| | [x[i] for i in range(0, len(x), max(1, len(x) // 6))], rotation=45 |
| | ) |
| |
|
| | plt.savefig(FIGURES_DIR / "temporal_distribution.png") |
| | plt.close() |
| | print(f" Saved: {FIGURES_DIR / 'temporal_distribution.png'}") |
| |
|
| |
|
| | def generate_report(stats: dict, collection_info: dict) -> None: |
| | """Generate markdown EDA report.""" |
| |
|
| | total_chunks = stats["total_chunks"] |
| | unique_reviews = stats["unique_reviews"] |
| | unique_products = stats["unique_products"] |
| |
|
| | |
| | rating_dist = stats["rating_dist"] |
| | total_ratings = sum(rating_dist.values()) |
| |
|
| | |
| | lengths = stats["text_lengths"] |
| | tokens = stats["token_lengths"] |
| | median_chars = int(np.median(lengths)) if lengths else 0 |
| | median_tokens = int(np.median(tokens)) if tokens else 0 |
| | mean_chars = int(np.mean(lengths)) if lengths else 0 |
| |
|
| | |
| | chunk_dist = stats["chunk_dist"] |
| | single_chunk_reviews = chunk_dist.get(1, 0) |
| | multi_chunk_reviews = unique_reviews - single_chunk_reviews |
| | expansion_ratio = total_chunks / unique_reviews if unique_reviews else 0 |
| |
|
| | |
| | rating_lines = [] |
| | for rating in sorted(rating_dist.keys()): |
| | count = rating_dist[rating] |
| | pct = count / total_ratings * 100 if total_ratings else 0 |
| | rating_lines.append(f"| {int(rating)} | {count:,} | {pct:.1f}% |") |
| |
|
| | report_content = f"""# Exploratory Data Analysis: Production Data |
| | |
| | **Source:** Qdrant Cloud (Collection: `{collection_info.get("name", COLLECTION_NAME)}`) |
| | |
| | --- |
| | |
| | ## Dataset Overview |
| | |
| | | Metric | Value | |
| | |--------|-------| |
| | | Total Chunks | {total_chunks:,} | |
| | | Unique Reviews | {unique_reviews:,} | |
| | | Unique Products | {unique_products:,} | |
| | | Expansion Ratio | {expansion_ratio:.2f}x | |
| | |
| | --- |
| | |
| | ## Rating Distribution |
| | |
| | 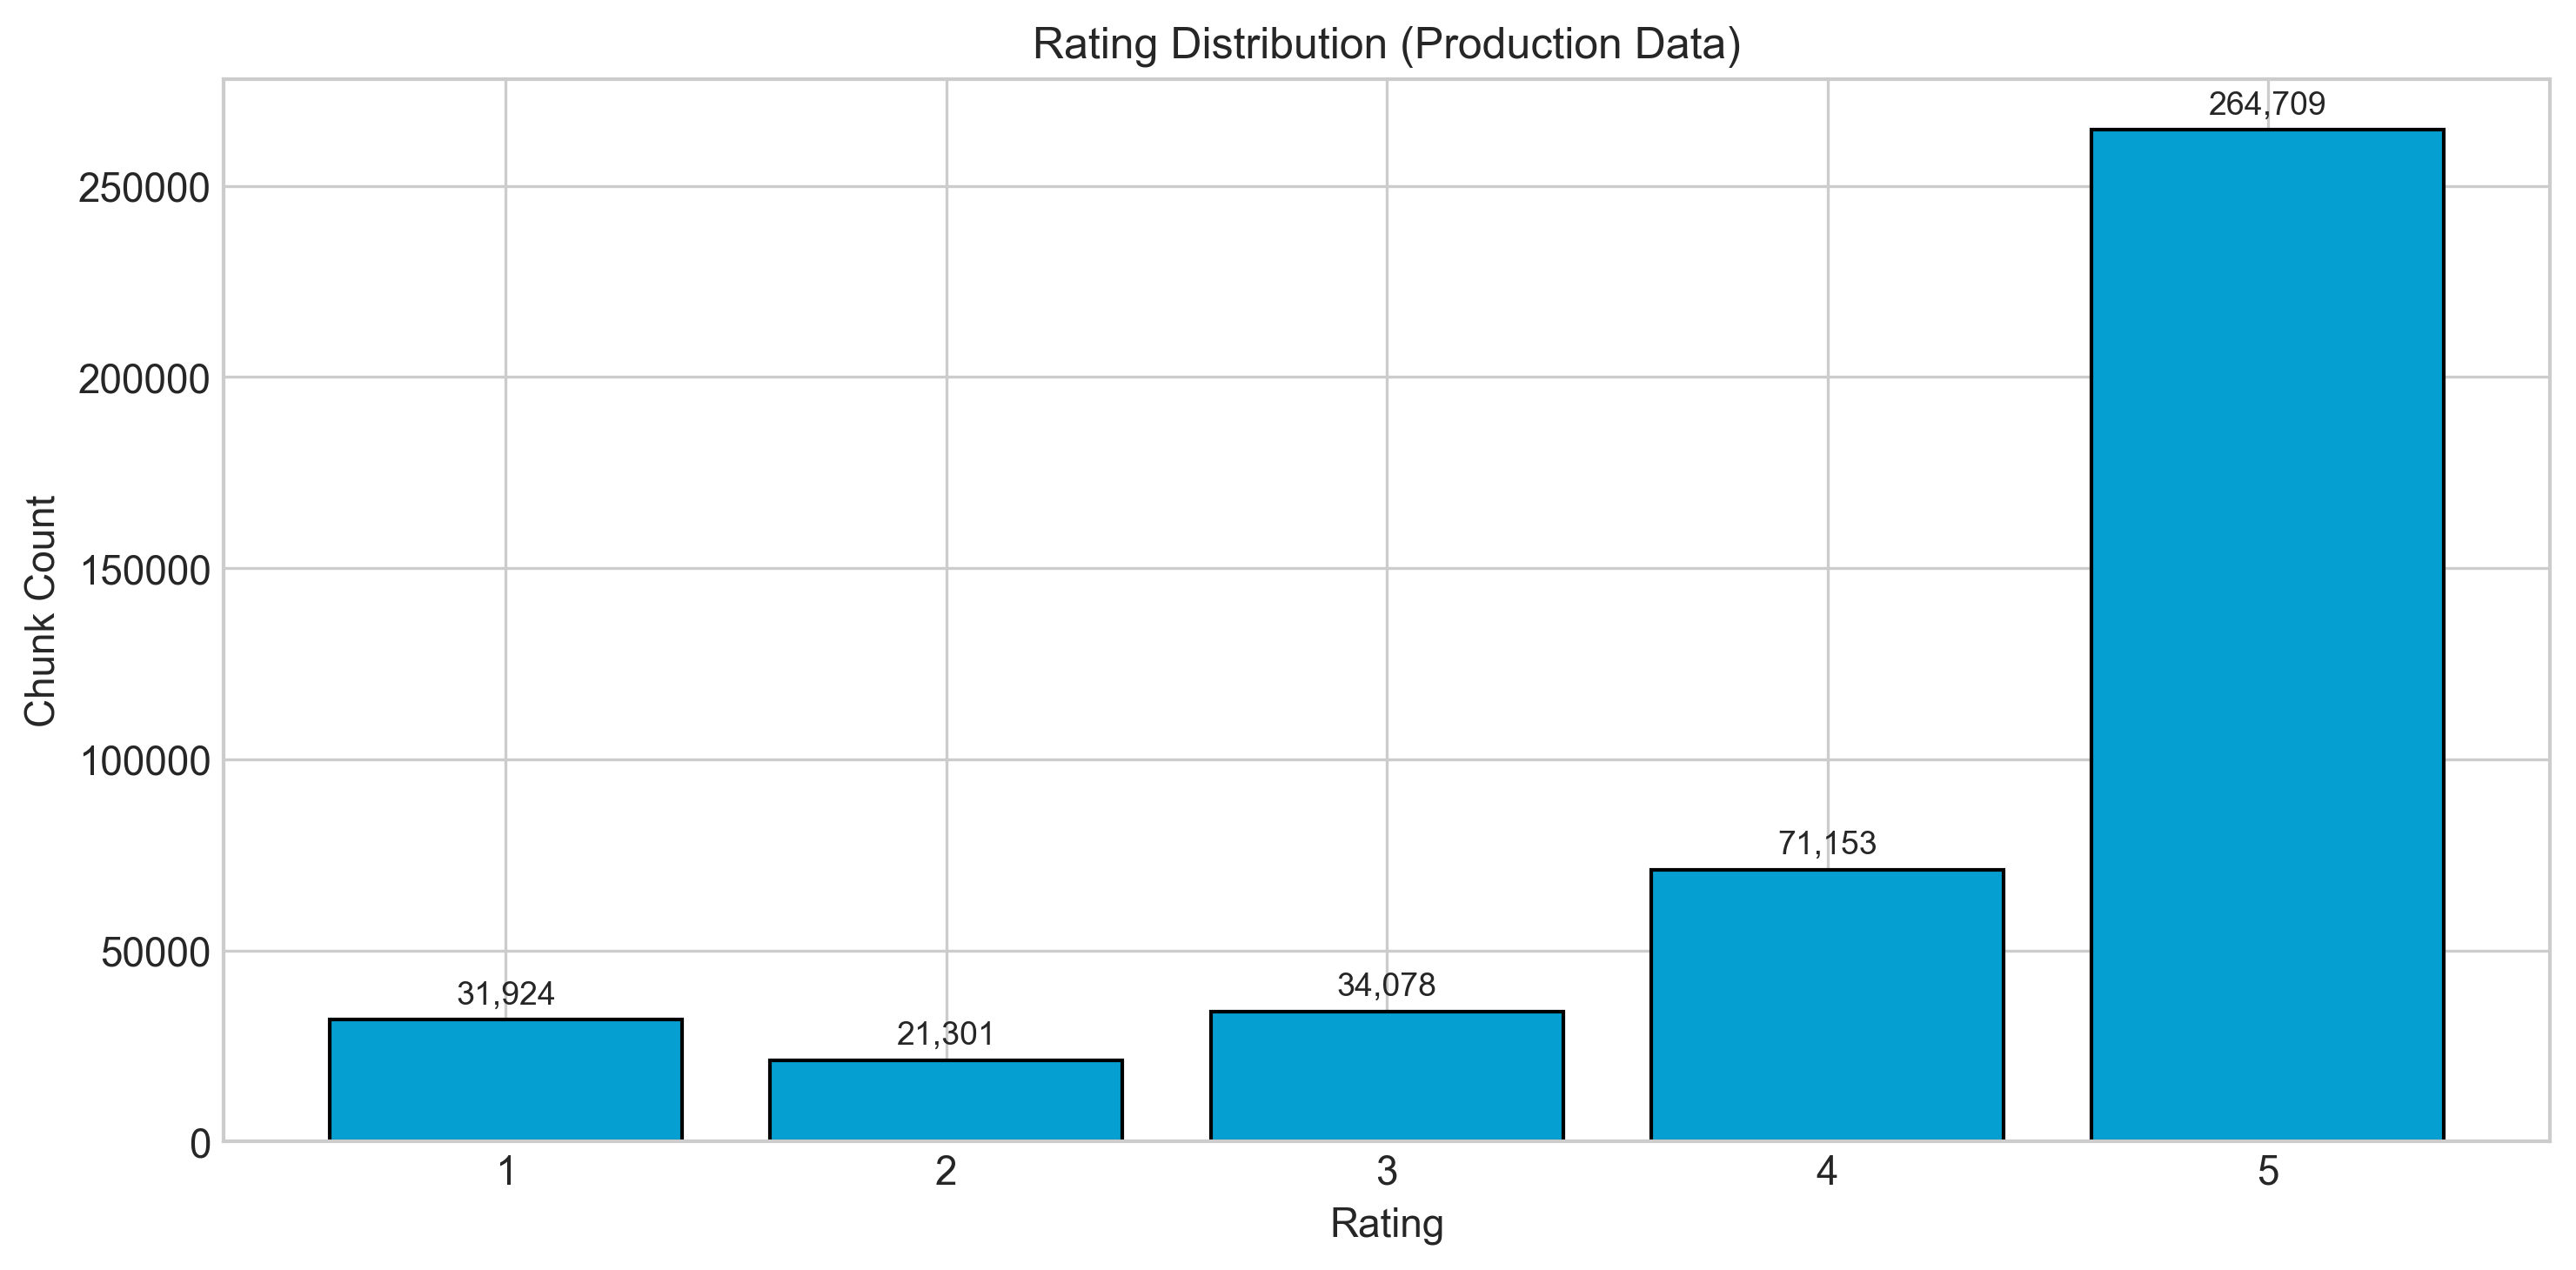 |
| | |
| | | Rating | Count | Percentage | |
| | |--------|-------|------------| |
| | {chr(10).join(rating_lines)} |
| | |
| | --- |
| | |
| | ## Chunk Length Analysis |
| | |
| | 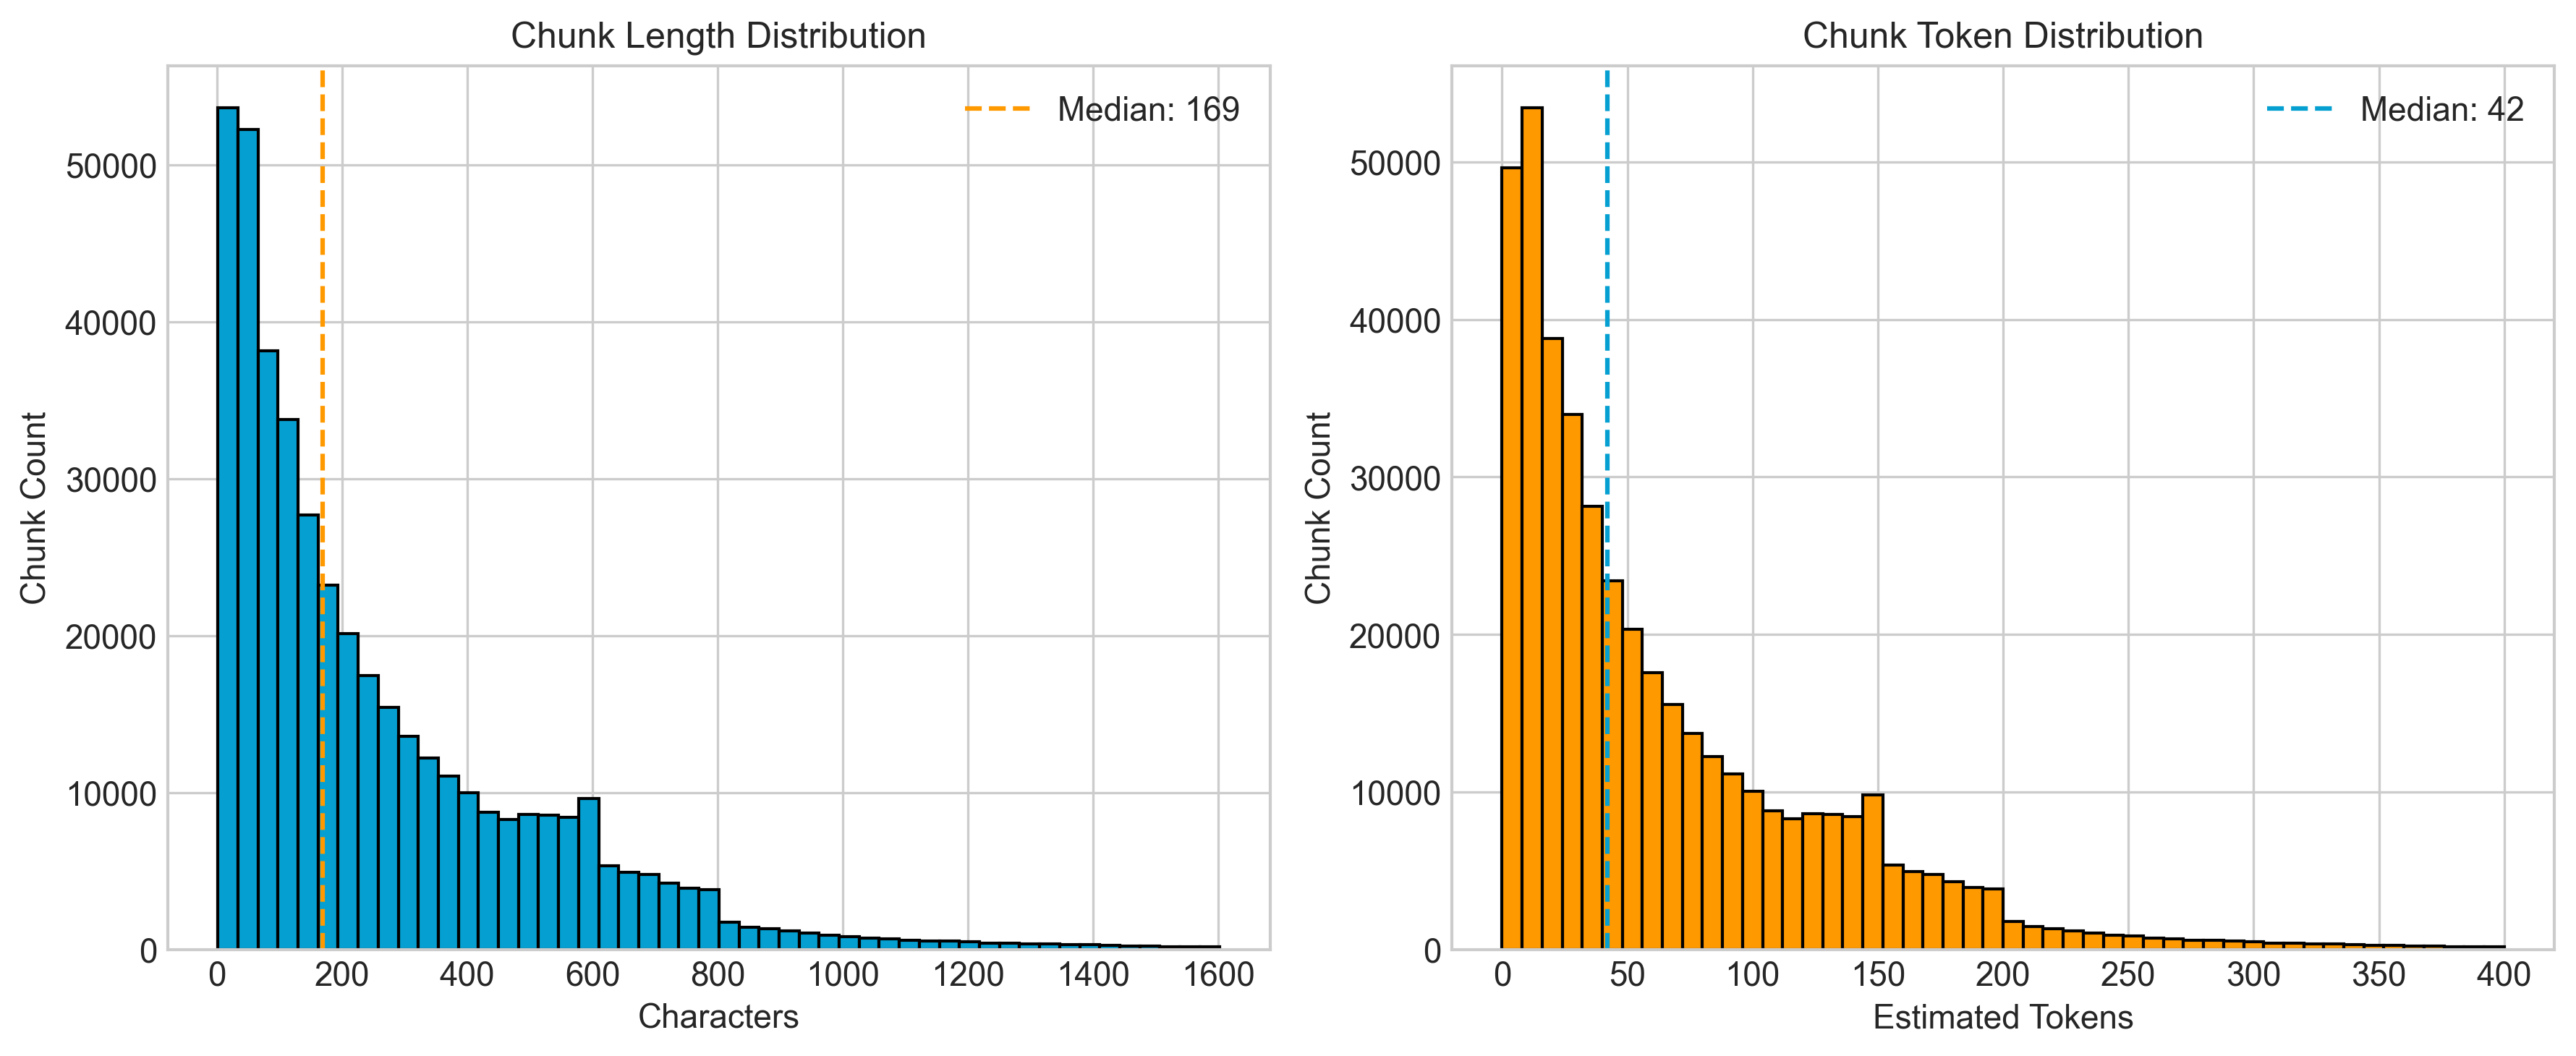 |
| | |
| | Median: {median_chars:,} chars (~{median_tokens} tokens), Mean: {mean_chars:,} chars |
| | |
| | --- |
| | |
| | ## Chunking Distribution |
| | |
| | 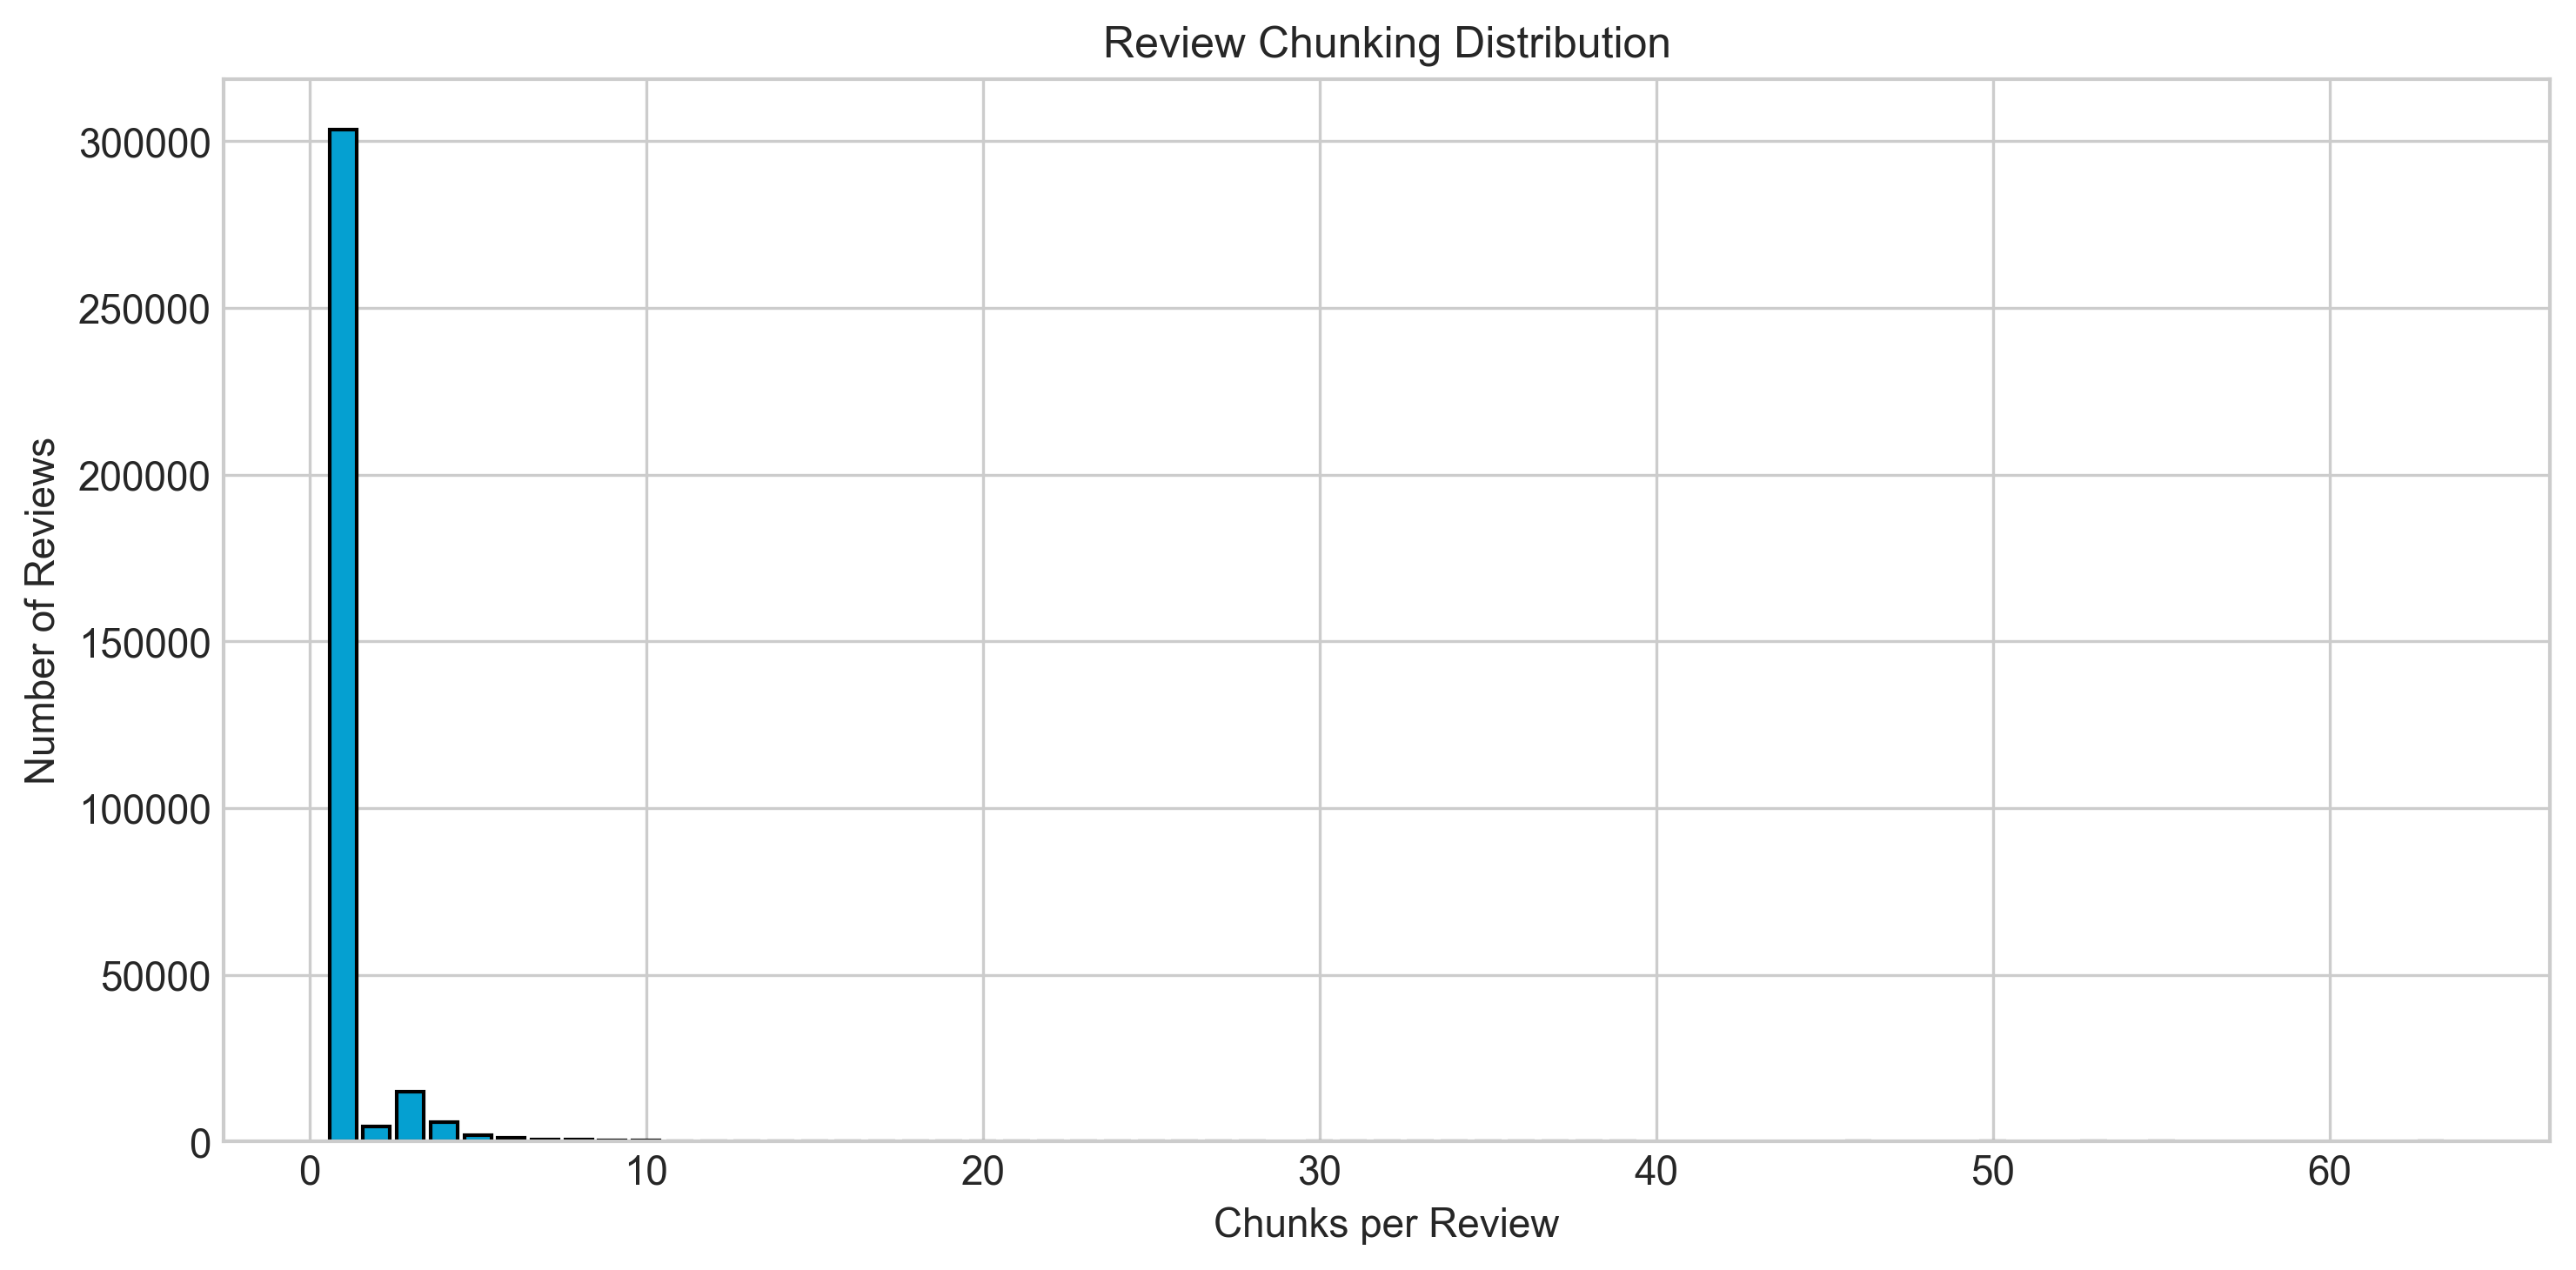 |
| | |
| | | Metric | Value | |
| | |--------|-------| |
| | | Single-chunk reviews | {single_chunk_reviews:,} | |
| | | Multi-chunk reviews | {multi_chunk_reviews:,} | |
| | |
| | **Strategy:** <200 tokens whole; 200-500 semantic chunking; >500 sliding window. |
| | |
| | --- |
| | |
| | ## Temporal Distribution |
| | |
| | 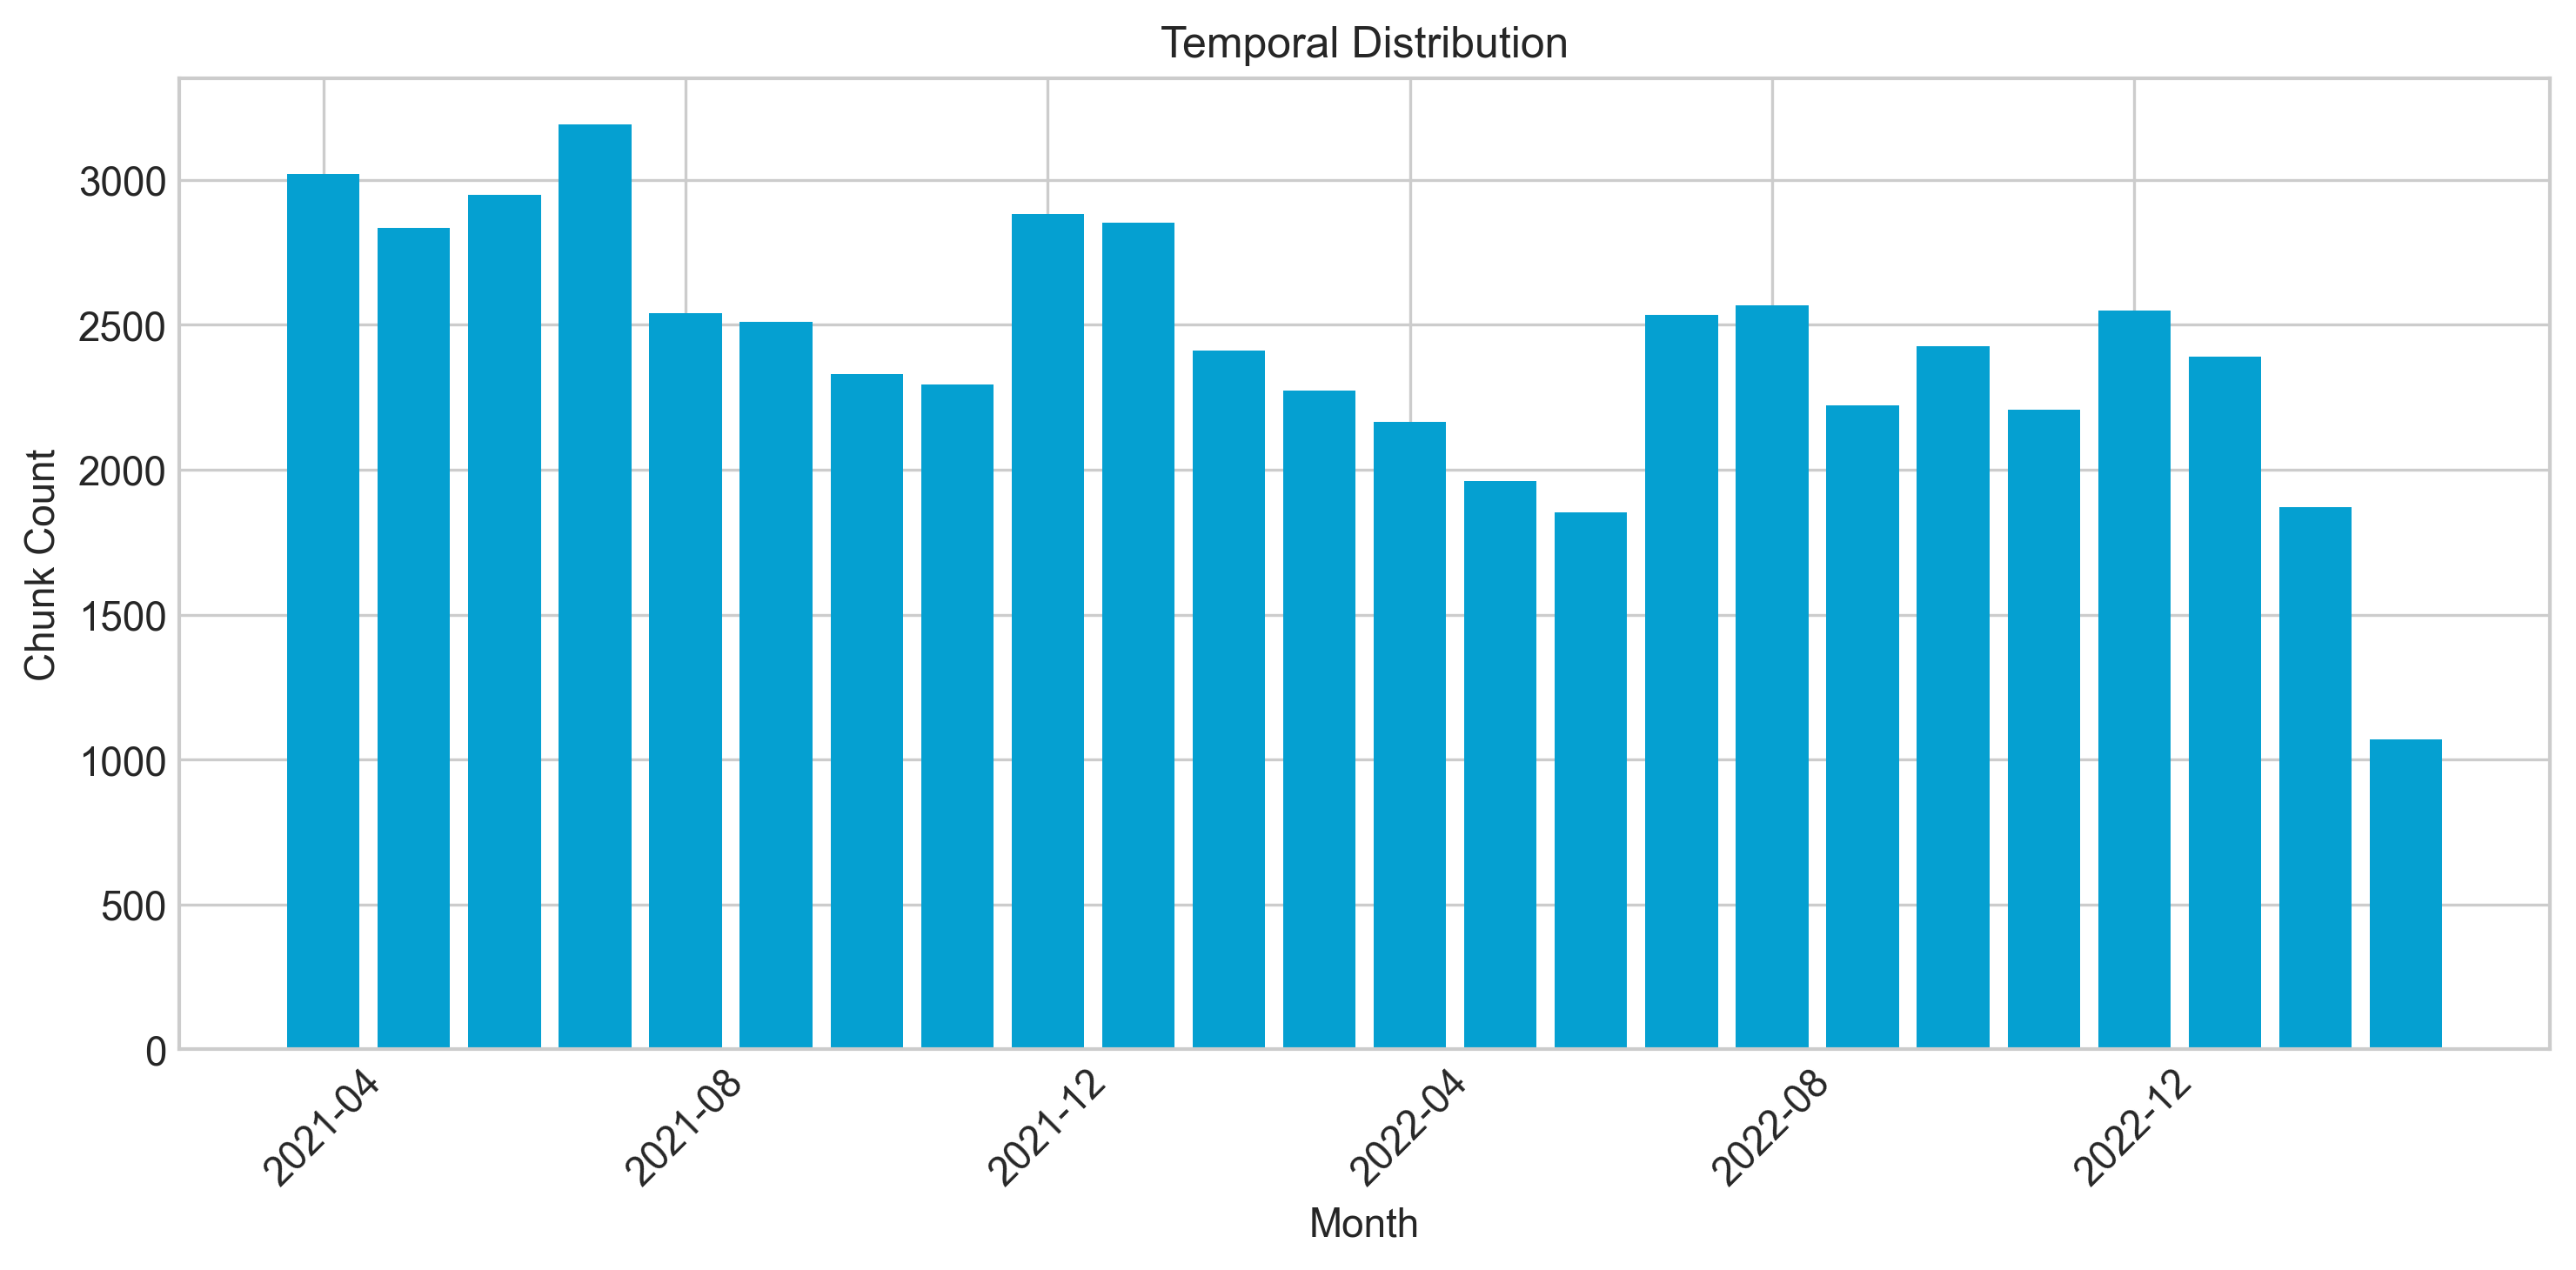 |
| | |
| | --- |
| | |
| | ## Data Quality |
| | |
| | 5-core filtered (users and items with 5+ interactions). All chunks have valid text, ratings in [1,5], product IDs present, deterministic chunk IDs (MD5). |
| | |
| | --- |
| | |
| | *Run `make eda` to regenerate.* |
| | """ |
| |
|
| | report_path = REPORTS_DIR / "eda_report.md" |
| | report_path.write_text(report_content) |
| | print(f" Report: {report_path}") |
| |
|
| |
|
| | def main(): |
| | print("=" * 60) |
| | print("PRODUCTION EDA: Querying Qdrant Cloud") |
| | print("=" * 60) |
| |
|
| | client = get_client() |
| |
|
| | |
| | try: |
| | info = get_collection_info(client) |
| | print(f"\nCollection: {info['name']}") |
| | print(f"Points: {info['points_count']:,}") |
| | print(f"Status: {info['status']}") |
| | except Exception as e: |
| | print(f"ERROR: Cannot access collection: {e}") |
| | print("Ensure QDRANT_URL and QDRANT_API_KEY are correct.") |
| | sys.exit(1) |
| |
|
| | |
| | print("\n--- Computing Statistics ---") |
| | stats = compute_stats(client) |
| |
|
| | |
| | print("\n--- Generating Figures ---") |
| | generate_figures(stats) |
| |
|
| | |
| | print("\n--- Generating Report ---") |
| | generate_report(stats, info) |
| |
|
| | print("\n" + "=" * 60) |
| | print("EDA COMPLETE") |
| | print("=" * 60) |
| | print(f"Figures: {FIGURES_DIR}/") |
| | print(f"Report: {REPORTS_DIR / 'eda_report.md'}") |
| |
|
| | client.close() |
| |
|
| |
|
| | if __name__ == "__main__": |
| | main() |
| |
|
