Spaces:
Runtime error
Runtime error
| import { Backdrop, CircularProgress, Button, Box } from "@mui/material"; | |
| import HelpIcon from '@mui/icons-material/Help'; | |
| import Tooltip, { tooltipClasses } from '@mui/material/Tooltip'; | |
| import Typography from '@mui/material/Typography'; | |
| import RepeatIcon from '@mui/icons-material/Repeat'; | |
| import { styled } from '@mui/material/styles'; | |
| import * as d3 from "d3"; | |
| import * as d3Contour from "d3-contour"; | |
| import React, { useContext, useEffect, useRef, useState } from "react"; | |
| import TextContainer, { topicsSizeFraction } from "./TextContainer"; | |
| import { TopicsContext } from "./UploadFileContext"; | |
| import QueryView from "./QueryView"; | |
| const bunkaDocs = "bunka_docs.json"; | |
| const bunkaTopics = "bunka_topics.json"; | |
| const { REACT_APP_API_ENDPOINT } = "local"; | |
| /** | |
| * Generic tooltip | |
| */ | |
| export const HtmlTooltip = styled(({ className, ...props }) => ( | |
| <Tooltip {...props} classes={{ popper: className }} /> | |
| ))(({ theme }) => ({ | |
| [`& .${tooltipClasses.popper}`]: { | |
| backgroundColor: '#fff', | |
| color: 'rgba(0, 0, 0, 0.87)', | |
| maxWidth: 220, | |
| fontSize: theme.typography.pxToRem(12), | |
| }, | |
| })); | |
| function MapView() { | |
| const [selectedDocument, setSelectedDocument] = useState(null); | |
| const [mapLoading, setMapLoading] = useState(false); | |
| const [topicsCentroids, setTopicsCentroids] = useState([]) | |
| const { data: apiData, isLoading: isFileProcessing } = useContext(TopicsContext); | |
| const svgRef = useRef(null); | |
| const scatterPlotContainerRef = useRef(null); | |
| const createScatterPlot = (data) => { | |
| const margin = { | |
| top: 20, | |
| right: 20, | |
| bottom: 50, | |
| left: 50, | |
| }; | |
| const plotWidth = window.innerWidth * 0.6; | |
| const plotHeight = window.innerHeight - document.getElementById("top-banner").clientHeight - 50; // Adjust the height as desired | |
| d3.select(svgRef.current).selectAll("*").remove(); | |
| const svg = d3 | |
| .select(svgRef.current) | |
| .attr("width", "100%") | |
| .attr("height", plotHeight); | |
| /** | |
| * SVG canvas group on which transforms apply. | |
| */ | |
| const g = svg.append("g") | |
| .classed("canvas", true) | |
| .attr("transform", `translate(${margin.left}, ${margin.top})`); | |
| /** | |
| * TODO Zoom. | |
| */ | |
| const zoom = d3.zoom() | |
| .scaleExtent([1, 3]) | |
| .translateExtent([[0, 0], [1000, 1000]]) | |
| .on("zoom", function ({ transform }) { | |
| g.attr( | |
| "transform", | |
| `translate(${transform.x ?? 0}, ${transform.y ?? 0}) scale(${transform.k ?? 1})` | |
| ) | |
| //positionLabels() | |
| // props.setTransform?.({ | |
| // x: transform.x, | |
| // y: transform.y, | |
| // k: transform.k | |
| // }) | |
| }); | |
| svg.call(zoom); | |
| const xMin = d3.min(data, (d) => d.x); | |
| const xMax = d3.max(data, (d) => d.x); | |
| const yMin = d3.min(data, (d) => d.y); | |
| const yMax = d3.max(data, (d) => d.y); | |
| const xScale = d3 | |
| .scaleLinear() | |
| .domain([xMin, xMax]) // Use the full range of your data | |
| .range([0, plotWidth]); | |
| const yScale = d3 | |
| .scaleLinear() | |
| .domain([yMin, yMax]) // Use the full range of your data | |
| .range([plotHeight, 0]); | |
| // Add contours | |
| const contourData = d3Contour | |
| .contourDensity() | |
| .x((d) => xScale(d.x)) | |
| .y((d) => yScale(d.y)) | |
| .size([plotWidth, plotHeight]) | |
| .bandwidth(5)( | |
| // Adjust the bandwidth as needed | |
| data, | |
| ); | |
| // Define a color scale for the contours to add visual depth and appeal | |
| const colorScale = d3.scaleSequential(d3.interpolateTurbo) // Using d3.interpolateTurbo for vibrant colors | |
| .domain([0, d3.max(contourData, d => d.value)]); // Dynamically set the domain based on data density | |
| // Define a custom color for the contour lines | |
| const contourLineColor = "rgb(94, 163, 252)"; | |
| // Append the contour path to the SVG with a custom color | |
| g | |
| .selectAll("path.contour") | |
| .data(contourData) | |
| .enter() | |
| .append("path") | |
| .attr("class", "contour") | |
| .attr("d", d3.geoPath()) | |
| .style("fill", "lightgreen") | |
| .attr("fill", d => colorScale(d.value)) // Apply color based on data density | |
| .style("stroke", contourLineColor) // Set the contour line color to the custom color | |
| .style("stroke-width", 1); | |
| const centroids = data.filter((d) => d.x_centroid && d.y_centroid); | |
| setTopicsCentroids(centroids); | |
| g | |
| .selectAll("circle.topic-centroid") | |
| .data(centroids) | |
| .enter() | |
| .append("circle") | |
| .attr("class", "topic-centroid") | |
| .attr("cx", (d) => xScale(d.x_centroid)) | |
| .attr("cy", (d) => yScale(d.y_centroid)) | |
| .attr("r", 8) // Adjust the radius as needed | |
| .style("fill", "red") // Adjust the fill color as needed | |
| .style("stroke", "black") | |
| .style("stroke-width", 2) | |
| .on("click", (event, d) => { | |
| // Show the content and topic name of the clicked topic centroid in the text container | |
| setSelectedDocument(d); | |
| }); | |
| // Add text labels for topic names | |
| g | |
| .selectAll("rect.topic-label-background") | |
| .data(centroids) | |
| .enter() | |
| .append("rect") | |
| .attr("class", "topic-label-background") | |
| .attr("x", (d) => { | |
| // Calculate the width of the text | |
| const first10Words = d.name.split(' ').slice(0, 8).join(' '); | |
| const textLength = first10Words.length * 8; // Adjust the multiplier for width as needed | |
| // Calculate the x position to center the box | |
| return xScale(d.x_centroid) - textLength / 2; | |
| }) // Center the box horizontally | |
| .attr("y", (d) => yScale(d.y_centroid) - 20) // Adjust the y position | |
| .attr("width", (d) => { | |
| // Compute the width based on the text's length | |
| const first10Words = d.name.split(' ').slice(0, 8).join(' '); | |
| const textLength = first10Words.length * 8; // Adjust the multiplier for width as needed | |
| return textLength; | |
| }) | |
| .attr("height", 30) // Set the height of the white box | |
| .style("fill", "white") // Set the white fill color | |
| .style("stroke", "grey") // Set the blue border color | |
| .style("stroke-width", 2); // Set the border width | |
| // Add text labels in black within the white boxes | |
| g | |
| .selectAll("text.topic-label-text") | |
| .data(centroids) | |
| .enter() | |
| .append("text") | |
| .attr("class", "topic-label-text") | |
| .attr("x", (d) => xScale(d.x_centroid)) | |
| .attr("y", (d) => yScale(d.y_centroid) + 4) // Adjust the vertical position | |
| .text((d) => { | |
| const first10Words = d.name.split(' ').slice(0, 8).join(' '); | |
| return first10Words; | |
| }) // Use the first 10 words | |
| .style("text-anchor", "middle") // Center-align the text | |
| .style("fill", "black"); // Set the text color | |
| const convexHullData = data.filter((d) => d.convex_hull); | |
| for (const d of convexHullData) { | |
| const hull = d.convex_hull; | |
| const hullPoints = hull.x_coordinates.map((x, i) => [xScale(x), yScale(hull.y_coordinates[i])]); | |
| g | |
| .append("path") | |
| .datum(d3.polygonHull(hullPoints)) | |
| .attr("class", "convex-hull-polygon") | |
| .attr("d", (d1) => `M${d1.join("L")}Z`) | |
| .style("fill", "none") | |
| .style("stroke", "rgba(255, 255, 255, 0.5)") // White with 50% transparency | |
| .style("stroke-width", 2); | |
| } | |
| // Add polygons for topics. Delete if no clicking on polygons | |
| const topicsPolygons = g | |
| .selectAll("polygon.topic-polygon") | |
| .data(centroids) | |
| .enter() | |
| .append("polygon") | |
| .attr("class", "topic-polygon") | |
| .attr("points", (d) => { | |
| const hull = d.convex_hull; | |
| const hullPoints = hull.x_coordinates.map((x, i) => [xScale(x), yScale(hull.y_coordinates[i])]); | |
| return hullPoints.map((point) => point.join(",")).join(" "); | |
| }) | |
| .style("fill", "transparent") | |
| .style("stroke", "transparent") | |
| .style("stroke-width", 2); // Adjust the border width as needed | |
| let currentlyClickedPolygon = null; | |
| function clickFirstPolygon() { | |
| // Simulate a click event on the first polygon | |
| const firstPolygon = d3.select(topicsPolygons.nodes()[0]); | |
| firstPolygon.node().dispatchEvent(new Event("click")); | |
| } | |
| topicsPolygons.on("click", (event, d) => { | |
| // Reset the fill color of the previously clicked polygon to transparent light grey | |
| if (currentlyClickedPolygon !== null) { | |
| currentlyClickedPolygon.style("fill", "transparent"); | |
| currentlyClickedPolygon.style("stroke", "transparent"); | |
| } | |
| // Set the fill color of the clicked polygon to transparent light grey and add a red border | |
| const clickedPolygon = d3.select(event.target); | |
| clickedPolygon.style("fill", "rgba(200, 200, 200, 0.4)"); | |
| clickedPolygon.style("stroke", "red"); | |
| currentlyClickedPolygon = clickedPolygon; | |
| // Display the topic name and content from top_doc_content with a scroll system | |
| if (d.top_doc_content) { | |
| // Render the TextContainer component with topic details | |
| setSelectedDocument(d); | |
| } | |
| }); | |
| clickFirstPolygon(); | |
| }; | |
| useEffect(() => { | |
| if (REACT_APP_API_ENDPOINT === "local" || apiData === undefined) { | |
| setMapLoading(true); | |
| // Fetch the JSON data locally | |
| fetch(`/${bunkaDocs}`) | |
| .then((response) => response.json()) | |
| .then((localData) => { | |
| // Fetch the local topics data and merge it with the existing data | |
| fetch(`/${bunkaTopics}`) | |
| .then((response) => response.json()) | |
| .then((topicsData) => { | |
| // Merge the topics data with the existing data | |
| const mergedData = localData.concat(topicsData); | |
| // Call the function to create the scatter plot after data is loaded | |
| createScatterPlot(mergedData); | |
| }) | |
| .catch((error) => { | |
| console.error("Error fetching topics data:", error); | |
| }) | |
| .finally(() => { | |
| setMapLoading(false); | |
| }); | |
| }) | |
| .catch((error) => { | |
| console.error("Error fetching JSON data:", error); | |
| }) | |
| .finally(() => { | |
| setMapLoading(false); | |
| }); | |
| } else { | |
| // Call the function to create the scatter plot with the data provided by TopicsContext | |
| createScatterPlot(apiData.docs.concat(apiData.topics)); | |
| } | |
| // After the data is loaded, set the default topic | |
| if (apiData && apiData.topics && apiData.topics.length > 0) { | |
| // Set the default topic to the first topic in the list | |
| setSelectedDocument(apiData.topics[0]); | |
| } | |
| }, [apiData]); | |
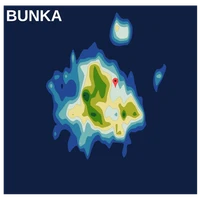
| const mapDescription = "This map is created by embedding documents in a two-dimensional space. Two documents are close to each other if they share similar semantic features, such as vocabulary, expressions, and language. The documents are not directly represented on the map; instead, they are grouped into clusters. A cluster is a set of documents that share similarities. A cluster is automatically described by a few words that best describes it."; | |
| return ( | |
| <div className="json-display"> | |
| {(isFileProcessing || mapLoading) ? ( | |
| <Backdrop open={isFileProcessing || mapLoading} style={{ zIndex: 9999 }}> | |
| <CircularProgress color="primary" /> | |
| </Backdrop> | |
| ) : ( | |
| <div className="scatter-plot-and-text-container"> | |
| <div className="scatter-plot-container" ref={scatterPlotContainerRef}> | |
| <HtmlTooltip | |
| title={ | |
| <React.Fragment> | |
| <Typography color="inherit">{mapDescription}</Typography> | |
| </React.Fragment> | |
| } | |
| followCursor | |
| > | |
| <HelpIcon style={{ | |
| position: "relative", | |
| top: 10, | |
| left: 40, | |
| border: "none" | |
| }} /> | |
| </HtmlTooltip> | |
| <svg ref={svgRef} /> | |
| </div> | |
| <div className="text-container"> | |
| {selectedDocument ? ( | |
| <TextContainer | |
| topicName={selectedDocument.name} | |
| topicSizeFraction={topicsSizeFraction(topicsCentroids, selectedDocument.size)} | |
| content={selectedDocument.top_doc_content} | |
| /> | |
| ) : ( | |
| // Display a default view or null if no document is selected | |
| null | |
| )} | |
| </div> | |
| </div> | |
| )} | |
| </div> | |
| ); | |
| } | |
| export default MapView; | |