Spaces:
Runtime error
Runtime error
| import * as d3 from "d3"; | |
| import * as d3Contour from "d3-contour"; | |
| import { Backdrop, CircularProgress, Box, Button } from "@mui/material"; | |
| import Typography from '@mui/material/Typography'; | |
| import RepeatIcon from '@mui/icons-material/Repeat'; | |
| import React, { useEffect, useRef, useState, useContext } from "react"; | |
| import TextContainer, { topicsSizeFraction } from "./TextContainer"; | |
| import { TopicsContext } from "./UploadFileContext"; | |
| import QueryView from "./QueryView"; | |
| import HelpIcon from '@mui/icons-material/Help'; | |
| import { HtmlTooltip } from "./Map"; | |
| const bunkaDocs = "bunka_bourdieu_docs.json"; | |
| const bunkaTopics = "bunka_bourdieu_topics.json"; | |
| const bunkaQuery = "bunka_bourdieu_query.json"; | |
| const { REACT_APP_API_ENDPOINT } = process.env; | |
| function Bourdieu() { | |
| const [selectedDocument, setSelectedDocument] = useState(null); | |
| const [mapLoading, setMapLoading] = useState(false); | |
| const [topicsCentroids, setTopicsCentroids] = useState([]) | |
| const { bourdieuData: apiData, isLoading: isFileProcessing } = useContext(TopicsContext); | |
| const svgRef = useRef(null); | |
| const scatterPlotContainerRef = useRef(null); | |
| // Set the SVG height to match your map's desired height | |
| const svgHeight = window.innerHeight - document.getElementById("top-banner").clientHeight - 50; | |
| const svgWidth = window.innerWidth * 0.70; // Set the svg container height to match the layout | |
| const createScatterPlot = (docsData, topicsData, queryData) => { | |
| const margin = { | |
| top: 20, | |
| right: 20, | |
| bottom: 50, | |
| left: 50, | |
| }; | |
| const plotWidth = svgWidth; | |
| const plotHeight = svgHeight; | |
| d3.select(svgRef.current).selectAll("*").remove(); | |
| const svg = d3 | |
| .select(svgRef.current) | |
| .attr("width", "100%") | |
| .attr("height", svgHeight); | |
| /** | |
| * SVG canvas group on which transforms apply. | |
| */ | |
| const g = svg.append("g").classed("canvas", true); | |
| /** | |
| * Setup Zoom. | |
| */ | |
| const zoom = d3.zoom() | |
| .scaleExtent([1, 3]) | |
| .translateExtent([[0,0], [plotWidth, plotHeight]]) | |
| .on("zoom", function ({ transform }) { | |
| g.attr( | |
| "transform", | |
| `translate(${transform.x ?? 0}, ${transform.y ?? 0}) scale(${transform.k ?? 1})` | |
| ); | |
| // props.setTransform?.({ | |
| // x: transform.x, | |
| // y: transform.y, | |
| // k: transform.k | |
| // }) | |
| }); | |
| /** | |
| * Initial zoom. | |
| */ | |
| svg.call(zoom); | |
| // const defaultTransform = { k: 1 }; | |
| // const initialTransform = defaultTransform?.k != null | |
| // ? new ZoomTransform( | |
| // defaultTransform.k ?? 1, | |
| // defaultTransform.x ?? 0, | |
| // defaultTransform.y ?? 0 | |
| // ) | |
| // : d3.zoomIdentity; | |
| // svg.call(zoom.transform, initialTransform); | |
| // Axes | |
| const dimensionX = { idLeft: queryData.x_left_words[0], idRight: queryData.x_right_words[0] }; | |
| const dimensionY = { idLeft: queryData.y_bottom_words[0], idRight: queryData.y_top_words[0] }; | |
| const xMin = d3.min(docsData, (d) => d.x); | |
| const xMax = d3.max(docsData, (d) => d.x); | |
| const yMin = d3.min(docsData, (d) => d.y); | |
| const yMax = d3.max(docsData, (d) => d.y); | |
| const maxDomainValue = Math.max(xMax, -xMin, yMax, -yMin); | |
| var xScale = d3.scaleLinear() | |
| .domain([-maxDomainValue, maxDomainValue]) | |
| .range([ 0, plotWidth ]); | |
| var yScale = d3.scaleLinear() | |
| .domain([-maxDomainValue, maxDomainValue]) | |
| .range([ plotHeight, 0 ]); | |
| const axes = d3.create("svg:g").classed("axes", true); | |
| svg | |
| .append('defs') | |
| .append('marker') | |
| .attr('id', 'arrowhead-right') | |
| .attr('refX', 5) | |
| .attr('refY', 5) | |
| .attr('markerWidth', 10) | |
| .attr('markerHeight', 10) | |
| .append('path') | |
| .attr('d', 'M 0 0 L 5 5 L 0 10') | |
| .attr('stroke', 'grey') | |
| .attr('stroke-width', 1) | |
| .attr('fill', 'none'); | |
| svg | |
| .append('defs') | |
| .append('marker') | |
| .attr('id', 'arrowhead-left') | |
| .attr('refX', 0) | |
| .attr('refY', 5) | |
| .attr('markerWidth', 10) | |
| .attr('markerHeight', 10) | |
| .append('path') | |
| .attr('d', 'M 5 0 L 0 5 L 5 10') | |
| .attr('stroke', 'grey') | |
| .attr('stroke-width', 1) | |
| .attr('fill', 'none'); | |
| svg | |
| .append('defs') | |
| .append('marker') | |
| .attr('id', 'arrowhead-top') | |
| .attr('refX', 5) | |
| .attr('refY', 0) | |
| .attr('markerWidth', 10) | |
| .attr('markerHeight', 10) | |
| .append('path') | |
| .attr('d', 'M 0 5 L 5 0 L 10 5') | |
| .attr('stroke', 'grey') | |
| .attr('stroke-width', 1) | |
| .attr('fill', 'none'); | |
| svg | |
| .append('defs') | |
| .append('marker') | |
| .attr('id', 'arrowhead-bottom') | |
| .attr('refX', 5) | |
| .attr('refY', 5) | |
| .attr('markerWidth', 10) | |
| .attr('markerHeight', 10) | |
| .append('path') | |
| .attr('d', 'M 0 0 L 5 5 L 10 0') | |
| .attr('stroke', 'grey') | |
| .attr('stroke-width', 1) | |
| .attr('fill', 'none'); | |
| // X axis | |
| axes.append("g") | |
| .attr("transform", `translate(0,${plotHeight / 2})`) | |
| .call( | |
| d3.axisBottom(xScale) | |
| .tickSizeInner(0) | |
| .tickSizeOuter(0) | |
| .tickPadding(10) | |
| ) | |
| .attr("class", "axis xAxis") | |
| .datum({ dimension: dimensionX }) | |
| .select('path.domain') | |
| .attr("marker-start", "url(#arrowhead-left)") | |
| .attr("marker-end", "url(#arrowhead-right)"); | |
| // Y axis | |
| axes.append("g") | |
| .attr("transform", `translate(${plotWidth / 2},0)`) | |
| .call( | |
| d3.axisRight(yScale) | |
| .tickSizeInner(0) | |
| .tickSizeOuter(0) | |
| .tickPadding(10) | |
| ) | |
| .attr("class", "axis yAxis") | |
| .datum({ dimension: dimensionY }) | |
| .select('path.domain') | |
| .attr("marker-end", "url(#arrowhead-top)") | |
| .attr("marker-start", "url(#arrowhead-bottom)"); | |
| // Style the tick texts | |
| axes.selectAll(".tick text") | |
| .style("fill", "blue") // Color of the text | |
| .style("font-weight", "bold"); | |
| // Show only first and last ticks | |
| axes.selectAll(".xAxis .tick text") | |
| .style('text-anchor', "middle") | |
| .attr('transform', (d, i, nodes) => (i === 0 || i === nodes.length - 1) ? "rotate(-90)" : "") | |
| .attr("visibility", (d, i, nodes) => (i === 0 || i === nodes.length - 1) ? "visible" : "hidden"); | |
| axes.selectAll(".yAxis .tick text") | |
| .style('text-anchor', "start") | |
| .attr("visibility", (d, i, nodes) => (i === 0 || i === nodes.length - 1) ? "visible" : "hidden"); | |
| axes.selectAll(".xAxis .tick text") | |
| .text((d, i, nodes) => { | |
| if (i === 0) { | |
| return dimensionX.idLeft; // Custom text for the first tick | |
| } else if (i === nodes.length - 1) { | |
| return dimensionX.idRight; // Custom text for the last tick | |
| } | |
| return d; // Default text for all other ticks | |
| }); | |
| axes.selectAll(".yAxis .tick text") | |
| .text((d, i, nodes) => { | |
| if (i === 0) { | |
| return dimensionY.idLeft; // Custom text for the first tick | |
| } else if (i === nodes.length - 1) { | |
| return dimensionY.idRight;; // Custom text for the last tick | |
| } | |
| return d; // Default text for all other ticks | |
| }); | |
| /** | |
| * Draw Bourdieu map contents | |
| */ | |
| const contourData = d3Contour | |
| .contourDensity() | |
| .x((d) => xScale(-d.x)) | |
| .y((d) => yScale(d.y)) | |
| .size([plotWidth, plotHeight]) | |
| .bandwidth(30)(docsData); | |
| const contourLineColor = "rgb(94, 163, 252)"; | |
| g | |
| .selectAll("path.contour") | |
| .data(contourData) | |
| .enter() | |
| .append("path") | |
| .attr("class", "contour") | |
| .attr("d", d3.geoPath()) | |
| .style("fill", "none") | |
| .style("stroke", contourLineColor) | |
| .style("stroke-width", 1); | |
| const centroids = topicsData.filter((d) => d.x_centroid && d.y_centroid); | |
| setTopicsCentroids(centroids); | |
| g | |
| .selectAll("circle.topic-centroid") | |
| .data(centroids) | |
| .enter() | |
| .append("circle") | |
| .attr("class", "topic-centroid") | |
| .attr("cx", (d) => xScale(-d.x_centroid)) | |
| .attr("cy", (d) => yScale(d.y_centroid)) | |
| .attr("r", 8) | |
| .style("fill", "red") | |
| .style("stroke", "black") | |
| .style("stroke-width", 2) | |
| .on("click", (event, d) => { | |
| setSelectedDocument(d); | |
| }); | |
| g | |
| .selectAll("text.topic-label") | |
| .data(centroids) | |
| .enter() | |
| .append("text") | |
| .attr("class", "topic-label") | |
| .attr("x", (d) => xScale(-d.x_centroid)) | |
| .attr("y", (d) => yScale(d.y_centroid) - 12) | |
| .text((d) => d.name) | |
| .style("text-anchor", "middle"); | |
| const convexHullData = topicsData.filter((d) => d.convex_hull); | |
| for (const d of convexHullData) { | |
| const hull = d.convex_hull; | |
| if (hull) { | |
| const hullPoints = hull.x_coordinates.map((x, i) => [xScale(-x), yScale(hull.y_coordinates[i])]); | |
| g | |
| .append("path") | |
| .datum(d3.polygonHull(hullPoints)) | |
| .attr("class", "convex-hull-polygon") | |
| .attr("d", (dAttr) => `M${dAttr.join("L")}Z`) | |
| .style("fill", "none") | |
| .style("stroke", "rgba(255, 255, 255, 0.5)") | |
| .style("stroke-width", 2); | |
| } | |
| } | |
| const xGreaterThanZeroAndYGreaterThanZero = docsData.filter((d) => d.x > 0 && d.y > 0).length; | |
| const xLessThanZeroAndYGreaterThanZero = docsData.filter((d) => d.x < 0 && d.y > 0).length; | |
| const xGreaterThanZeroAndYLessThanZero = docsData.filter((d) => d.x > 0 && d.y < 0).length; | |
| const xLessThanZeroAndYLessThanZero = docsData.filter((d) => d.x < 0 && d.y < 0).length; | |
| // Calculate the total number of documents | |
| const totalDocuments = docsData.length; | |
| // Calculate the percentages | |
| const percentageXGreaterThanZeroAndYGreaterThanZero = (xGreaterThanZeroAndYGreaterThanZero / totalDocuments) * 100; | |
| const percentageXLessThanZeroAndYGreaterThanZero = (xLessThanZeroAndYGreaterThanZero / totalDocuments) * 100; | |
| const percentageXGreaterThanZeroAndYLessThanZero = (xGreaterThanZeroAndYLessThanZero / totalDocuments) * 100; | |
| const percentageXLessThanZeroAndYLessThanZero = (xLessThanZeroAndYLessThanZero / totalDocuments) * 100; | |
| // Add labels to display percentages in the squares | |
| // const squareSize = 300; // Adjust this based on your map's layout | |
| // const labelOffsetX = 10; // Adjust these offsets as needed | |
| // const labelOffsetY = 20; | |
| // Calculate the maximum X and Y coordinates | |
| // Calculate the midpoints for the squares | |
| const xMid = -d3.max(docsData, (d) => d.x) / 2; | |
| const yMid = d3.max(docsData, (d) => d.y) / 2; | |
| // Labels for X > 0 and Y > 0 square | |
| g | |
| .append("text") | |
| .attr("x", xScale(xMid)) | |
| .attr("y", yScale(yMid)) | |
| .text(`${percentageXGreaterThanZeroAndYGreaterThanZero.toFixed(0)}%`) // Remove the prefix | |
| .style("text-anchor", "middle") | |
| .style("fill", "dark") // Change the text color to blue | |
| .style("font-size", "100px") // Adjust the font size | |
| .style("opacity", 0.1); // Adjust the opacity (0.7 means slightly transparent) | |
| // Labels for X < 0 and Y > 0 square | |
| g | |
| .append("text") | |
| .attr("x", xScale(-xMid)) | |
| .attr("y", yScale(yMid)) | |
| .text(`${percentageXLessThanZeroAndYGreaterThanZero.toFixed(0)}%`) // Remove the prefix | |
| .style("text-anchor", "middle") | |
| .style("fill", "dark") // Change the text color to light blue | |
| .style("font-size", "100px") // Adjust the font size | |
| .style("opacity", 0.1); // Adjust the opacity (0.05 means slightly transparent) | |
| // Labels for X > 0 and Y < 0 square | |
| g | |
| .append("text") | |
| .attr("x", xScale(xMid)) | |
| .attr("y", yScale(-yMid)) | |
| .text(`${percentageXGreaterThanZeroAndYLessThanZero.toFixed(0)}%`) // Remove the prefix | |
| .style("text-anchor", "middle") | |
| .style("fill", "dark") // Change the text color to light blue | |
| .style("font-size", "100px") // Adjust the font size | |
| .style("opacity", 0.1); // Adjust the opacity (0.05 means slightly transparent) | |
| // Labels for X > 0 and Y < 0 square | |
| g | |
| .append("text") | |
| .attr("x", xScale(-xMid)) | |
| .attr("y", yScale(-yMid)) | |
| .text(`${percentageXLessThanZeroAndYLessThanZero.toFixed(0)}%`) // Remove the prefix | |
| .style("text-anchor", "middle") | |
| .style("fill", "dark") // Change the text color to light blue | |
| .style("font-size", "100px") // Adjust the font size | |
| .style("opacity", 0.1); // Adjust the opacity (0.05 means slightly transparent) | |
| const topicsPolygons = g | |
| .selectAll("polygon.topic-polygon") | |
| .data(centroids) | |
| .enter() | |
| .append("polygon") | |
| .attr("class", "topic-polygon") | |
| .attr("points", (d) => { | |
| const hull = d.convex_hull; | |
| if (hull) { | |
| const hullPoints = hull.x_coordinates.map((x, i) => [xScale(-x), yScale(hull.y_coordinates[i])]); | |
| return hullPoints.map((point) => point.join(",")).join(" "); | |
| } | |
| }) | |
| .style("fill", "transparent") | |
| .style("stroke", "transparent") | |
| .style("stroke-width", 2); | |
| let currentlyClickedPolygon = null; | |
| /** | |
| * Render Axes | |
| */ | |
| g.append(() => axes.node()) | |
| topicsPolygons.on("click", (event, d) => { | |
| // Reset the fill color of the previously clicked polygon to transparent light grey | |
| if (currentlyClickedPolygon !== null) { | |
| currentlyClickedPolygon.style("fill", "transparent"); | |
| currentlyClickedPolygon.style("stroke", "transparent"); | |
| } | |
| // Set the fill color of the clicked polygon to transparent light grey and add a red border | |
| const clickedPolygon = d3.select(event.target); | |
| clickedPolygon.style("fill", "rgba(200, 200, 200, 0.4)"); | |
| clickedPolygon.style("stroke", "red"); | |
| currentlyClickedPolygon = clickedPolygon; | |
| if (d.top_doc_content) { | |
| // Render the TextContainer component with topic details | |
| setSelectedDocument(d); | |
| } | |
| }); | |
| }; | |
| useEffect(() => { | |
| if (REACT_APP_API_ENDPOINT === "local" || apiData === undefined) { | |
| setMapLoading(true); | |
| // Fetch the JSON data locally | |
| fetch(`/${bunkaDocs}`) | |
| .then((response) => response.json()) | |
| .then((docsData) => { | |
| // Fetch the local topics data and merge it with the existing data | |
| fetch(`/${bunkaTopics}`) | |
| .then((response) => response.json()) | |
| .then((topicsData) => { | |
| fetch(`/${bunkaQuery}`) | |
| .then((response) => response.json()) | |
| .then((queryData) => { | |
| // Call the function to create the scatter plot after data is loaded | |
| createScatterPlot(docsData, topicsData, queryData); | |
| }) | |
| .catch((error) => { | |
| console.error("Error fetching bourdieu query data:", error); | |
| }) | |
| .finally(() => { | |
| setMapLoading(false); | |
| }); | |
| }) | |
| .catch((error) => { | |
| console.error("Error fetching topics data:", error); | |
| }) | |
| .finally(() => { | |
| setMapLoading(false); | |
| }); | |
| }) | |
| .catch((error) => { | |
| console.error("Error fetching documents data:", error); | |
| }) | |
| .finally(() => { | |
| setMapLoading(false); | |
| }); | |
| } else { | |
| // Call the function to create the scatter plot with the data provided by TopicsContext | |
| createScatterPlot(apiData.docs, apiData.topics, apiData.query); | |
| } | |
| }, [apiData]); | |
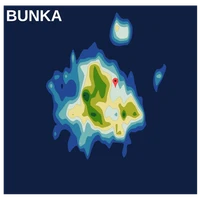
| const mapDescription = "This map is generated by projecting documents onto a two-dimensional space, where the axes are defined by the user. Two documents are positioned close to each other if they share a similar relationship with the axes. The documents themselves are not directly represented on the map; rather, they are aggregated into clusters. Each cluster represents a group of documents that exhibit similarities."; | |
| return ( | |
| <div className="json-display"> | |
| {(isFileProcessing || mapLoading) ? ( | |
| <Backdrop open={isFileProcessing || mapLoading} style={{ zIndex: 9999 }}> | |
| <CircularProgress color="primary" /> | |
| </Backdrop> | |
| ) : ( | |
| <div className="scatter-plot-and-text-container"> | |
| <div className="scatter-plot-container" ref={scatterPlotContainerRef}> | |
| <HtmlTooltip | |
| title={ | |
| <React.Fragment> | |
| <Typography color="inherit">{mapDescription}</Typography> | |
| </React.Fragment> | |
| } | |
| followCursor | |
| > | |
| <HelpIcon style={{ | |
| position: "relative", | |
| top: 10, | |
| left: 40, | |
| border: "none" | |
| }}/> | |
| </HtmlTooltip> | |
| <svg ref={svgRef} /> | |
| </div> | |
| <div className="text-container"> | |
| {selectedDocument !== null ? ( | |
| <> | |
| <Box sx={{ marginBottom: "1em" }}> | |
| <Button sx={{ width: "100%" }} component="label" variant="outlined" startIcon={<RepeatIcon />} onClick={() => setSelectedDocument(null)}> | |
| Upload another CSV file | |
| </Button> | |
| </Box> | |
| <TextContainer topicName={selectedDocument.name} topicSizeFraction={topicsSizeFraction(topicsCentroids, selectedDocument.size)} content={selectedDocument.top_doc_content} /> | |
| </> | |
| ) : <QueryView />} | |
| </div> | |
| </div> | |
| )} | |
| </div> | |
| ); | |
| } | |
| export default Bourdieu; | |