Bringing the Artificial Analysis LLM Performance Leaderboard to Hugging Face


Building applications with LLMs requires considering more than just quality: for many use-cases, speed and price are equally or more important.
For consumer applications and chat experiences, speed and responsiveness are critical to user engagement. Users expect near-instant responses, and delays can directly lead to reduced engagement. When building more complex applications involving tool use or agentic systems, speed and cost become even more important, and can become the limiting factor on overall system capability. The time taken by sequential requests to LLMs can quickly stack up for each user request adding to the cost.
This is why Artificial Analysis (@ArtificialAnlys) developed a leaderboard evaluating price, speed and quality across >100 serverless LLM API endpoints, now coming to Hugging Face.
Find the leaderboard here!
The LLM Performance Leaderboard
The LLM Performance Leaderboard aims to provide comprehensive metrics to help AI engineers make decisions on which LLMs (both open & proprietary) and API providers to use in AI-enabled applications.
When making decisions regarding which AI technologies to use, engineers need to consider quality, price and speed (latency & throughput). The LLM Performance Leaderboard brings all three together to enable decision making in one place across both proprietary & open models.
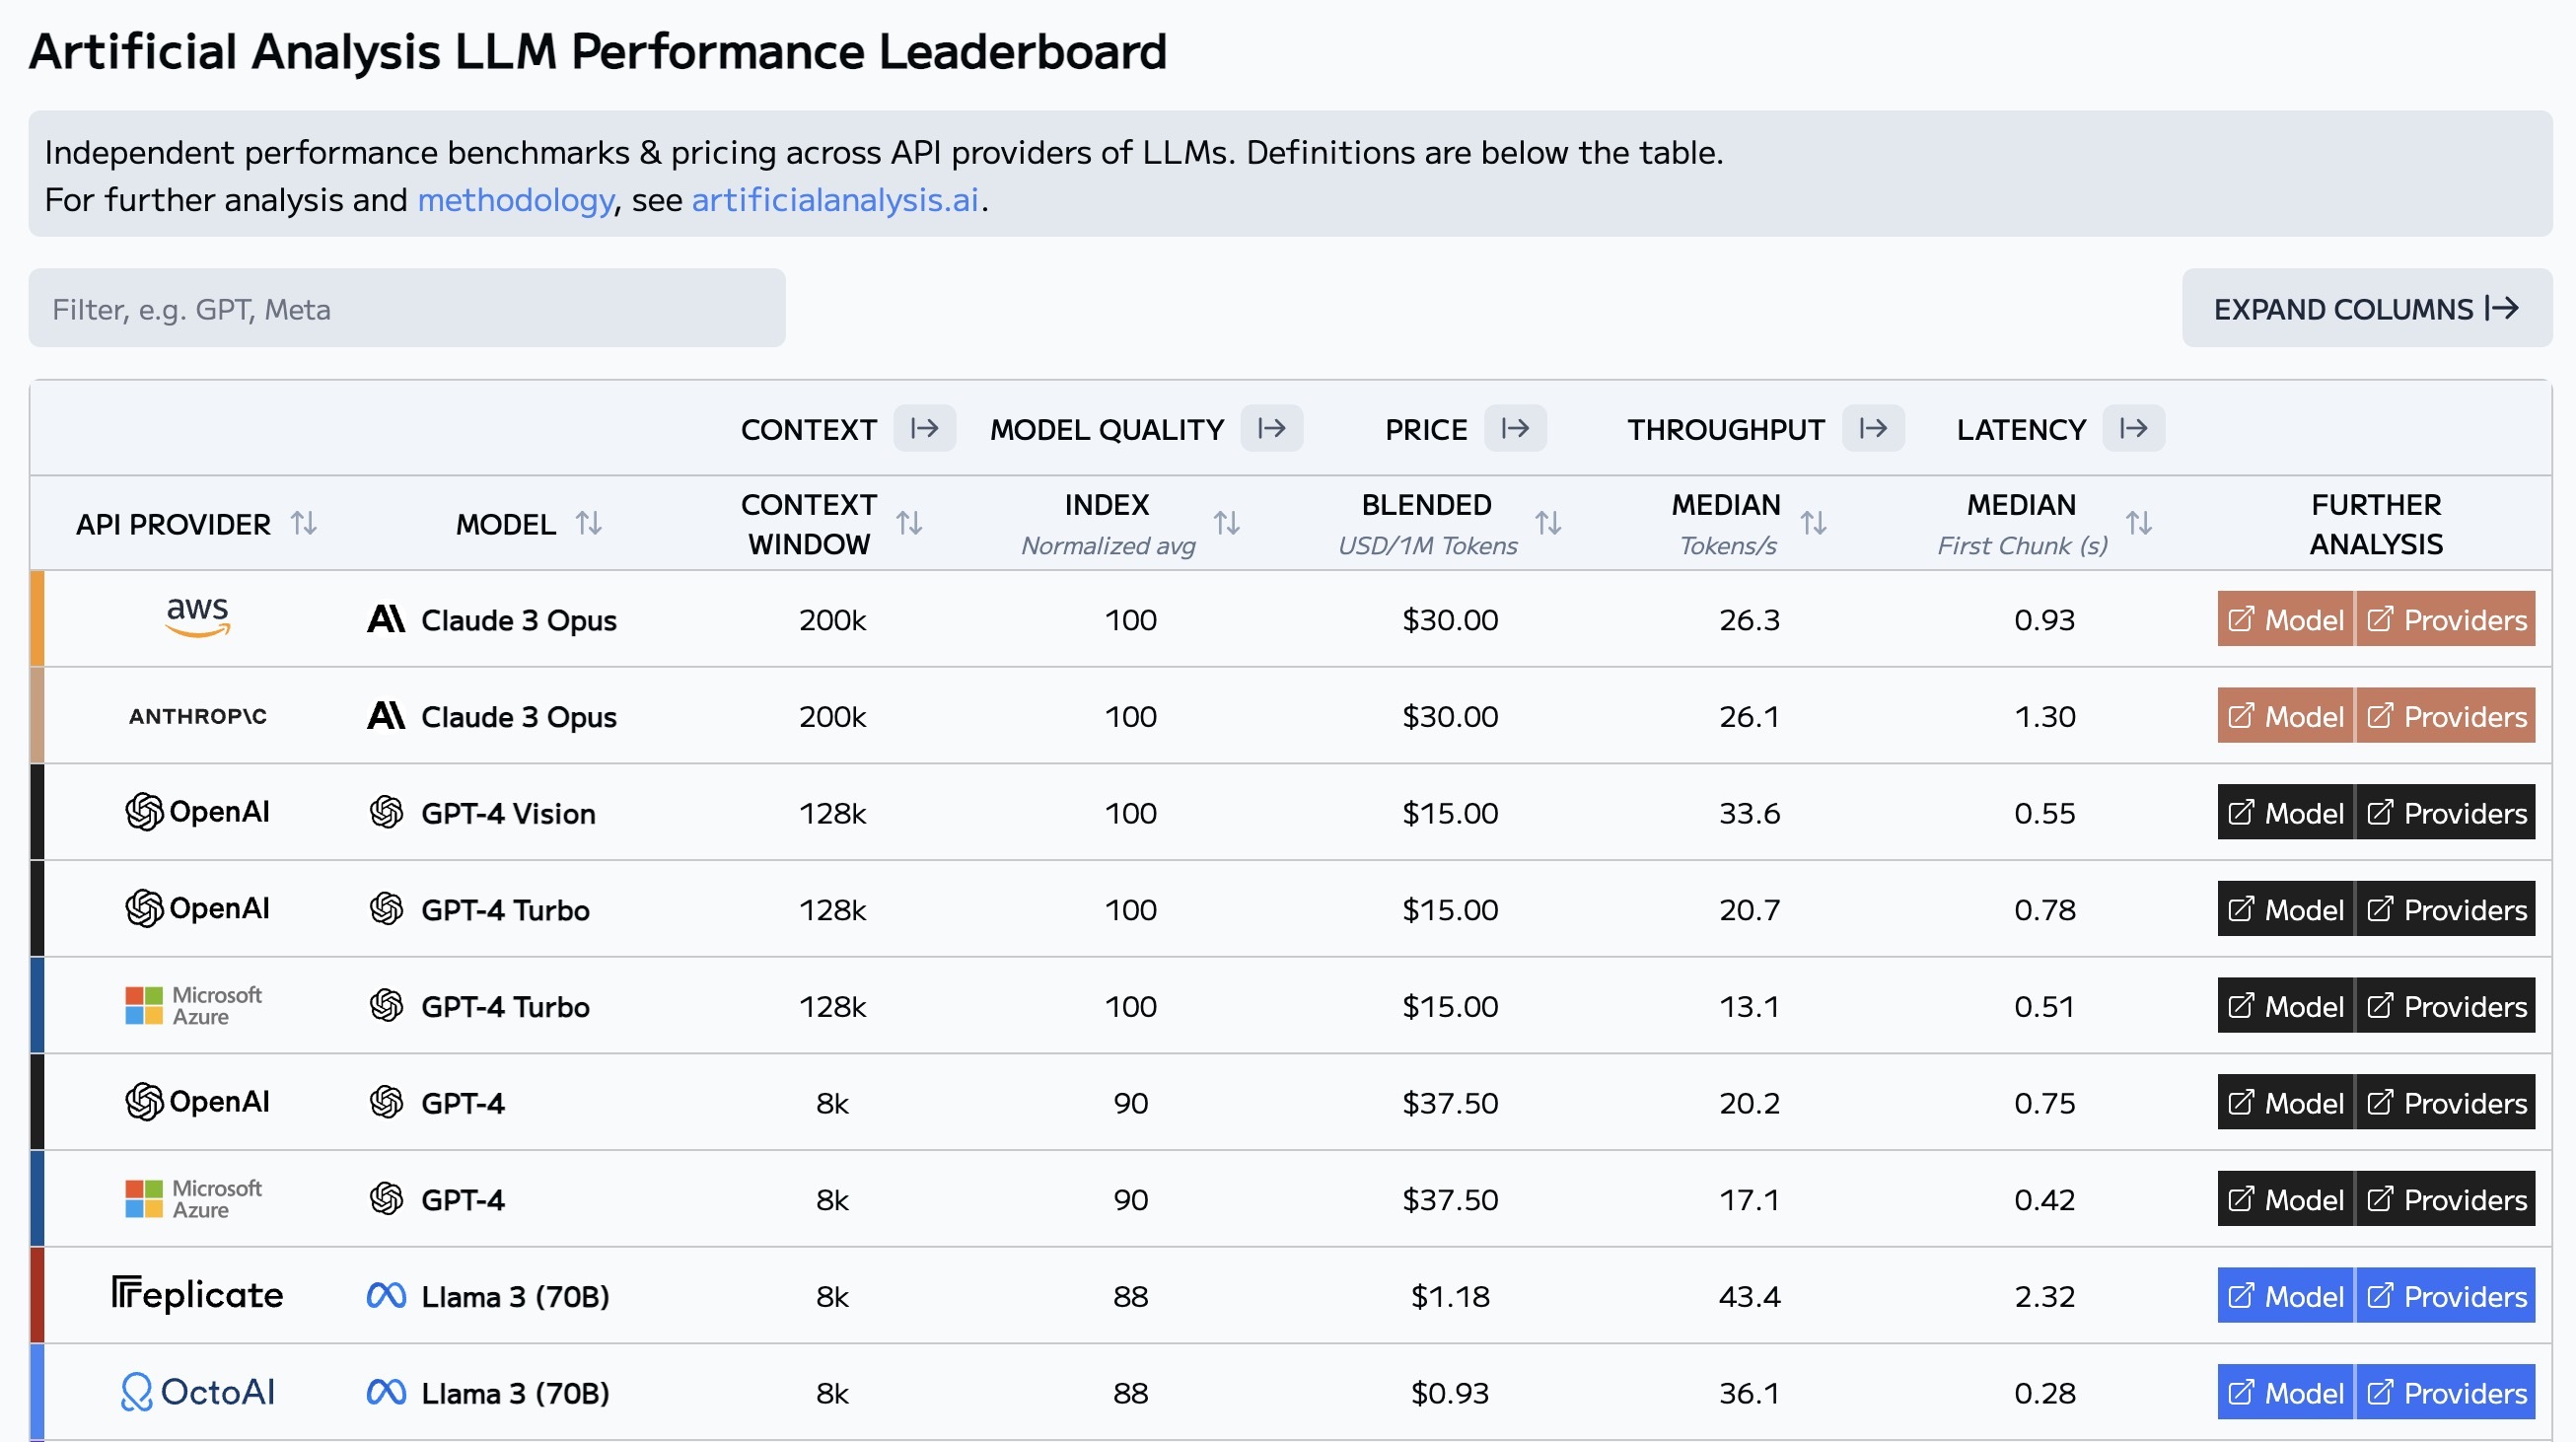
Source: LLM Performance Leaderboard
Metric coverage
The metrics reported are:
- Quality: a simplified index for comparing model quality and accuracy, calculated based on metrics such as MMLU, MT-Bench, HumanEval scores, as reported by the model authors, and Chatbot Arena ranking.
- Context window: the maximum number of tokens an LLM can work with at any one time (including both input and output tokens).
- Pricing: the prices charged by a provider to query the model for inference. We report input/output per-token pricing, as well as "blended" pricing to compare hosting providers with a single metric. We blend input and output pricing at a 3:1 ratio (i.e., an assumption that the length of input is 3x longer than the output).
- Throughput: how fast an endpoint outputs tokens during inference, measured in tokens per second (often referred to as tokens/s or "TPS"). We report the median, P5, P25, P75 and P95 values measured over the prior 14 days.
- Latency: how long the endpoint takes to respond after the request has been sent, known as Time to First Token ("TTFT") and measured in seconds. We report the median, P5, P25, P75 and P95 values measured over the prior 14 days.
For further definitions, see our full methodology page.
Test Workloads
The leaderboard allows exploration of performance under several different workloads (6 combinations in total):
- varying the prompt length: ~100 tokens, ~1k tokens, ~10k tokens.
- running parallel queries: 1 query, 10 parallel queries.
Methodology
We test every API endpoint on the leaderboard 8 times per day, and leaderboard figures represent the median measurement of the last 14 days. We also have percentile breakdowns within the collapsed tabs.
Quality metrics are currently collected on a per-model basis and show results reports by model creators, but watch this space as we begin to share results from our independent quality evaluations across each endpoint.
For further definitions, see our full methodology page.
Highlights (May 2024, see the leaderboard for the latest)
- The language models market has exploded in complexity over the last year. Launches that have shaken up the market just within the last two months include proprietary models like Anthropic's Claude 3 series and open models such as Databricks' DBRX, Cohere's Command R Plus, Google's Gemma, Microsoft's Phi-3, Mistral's Mixtral 8x22B and Meta's Llama 3.
- Price and speed vary considerably between models and providers. From Claude 3 Opus to Llama 3 8B, there is a 300x pricing spread - that's more than two orders of magnitude!
- API providers have increased the speed of launching models. Within 48 hours, 7 providers were offering the Llama 3 models. Speaking to the demand for new, open-source models and the competitive dynamics between API providers.
- Key models to highlight across quality segments:
- High quality, typically higher price & slower: GPT-4 Turbo and Claude 3 Opus
- Moderate quality, price & speed: Llama 3 70B, Mixtral 8x22B, Command R+, Gemini 1.5 Pro, DBRX
- Lower quality, but with much faster speed and lower pricing available: Llama 3 8B, Claude 3 Haiku, Mixtral 8x7B
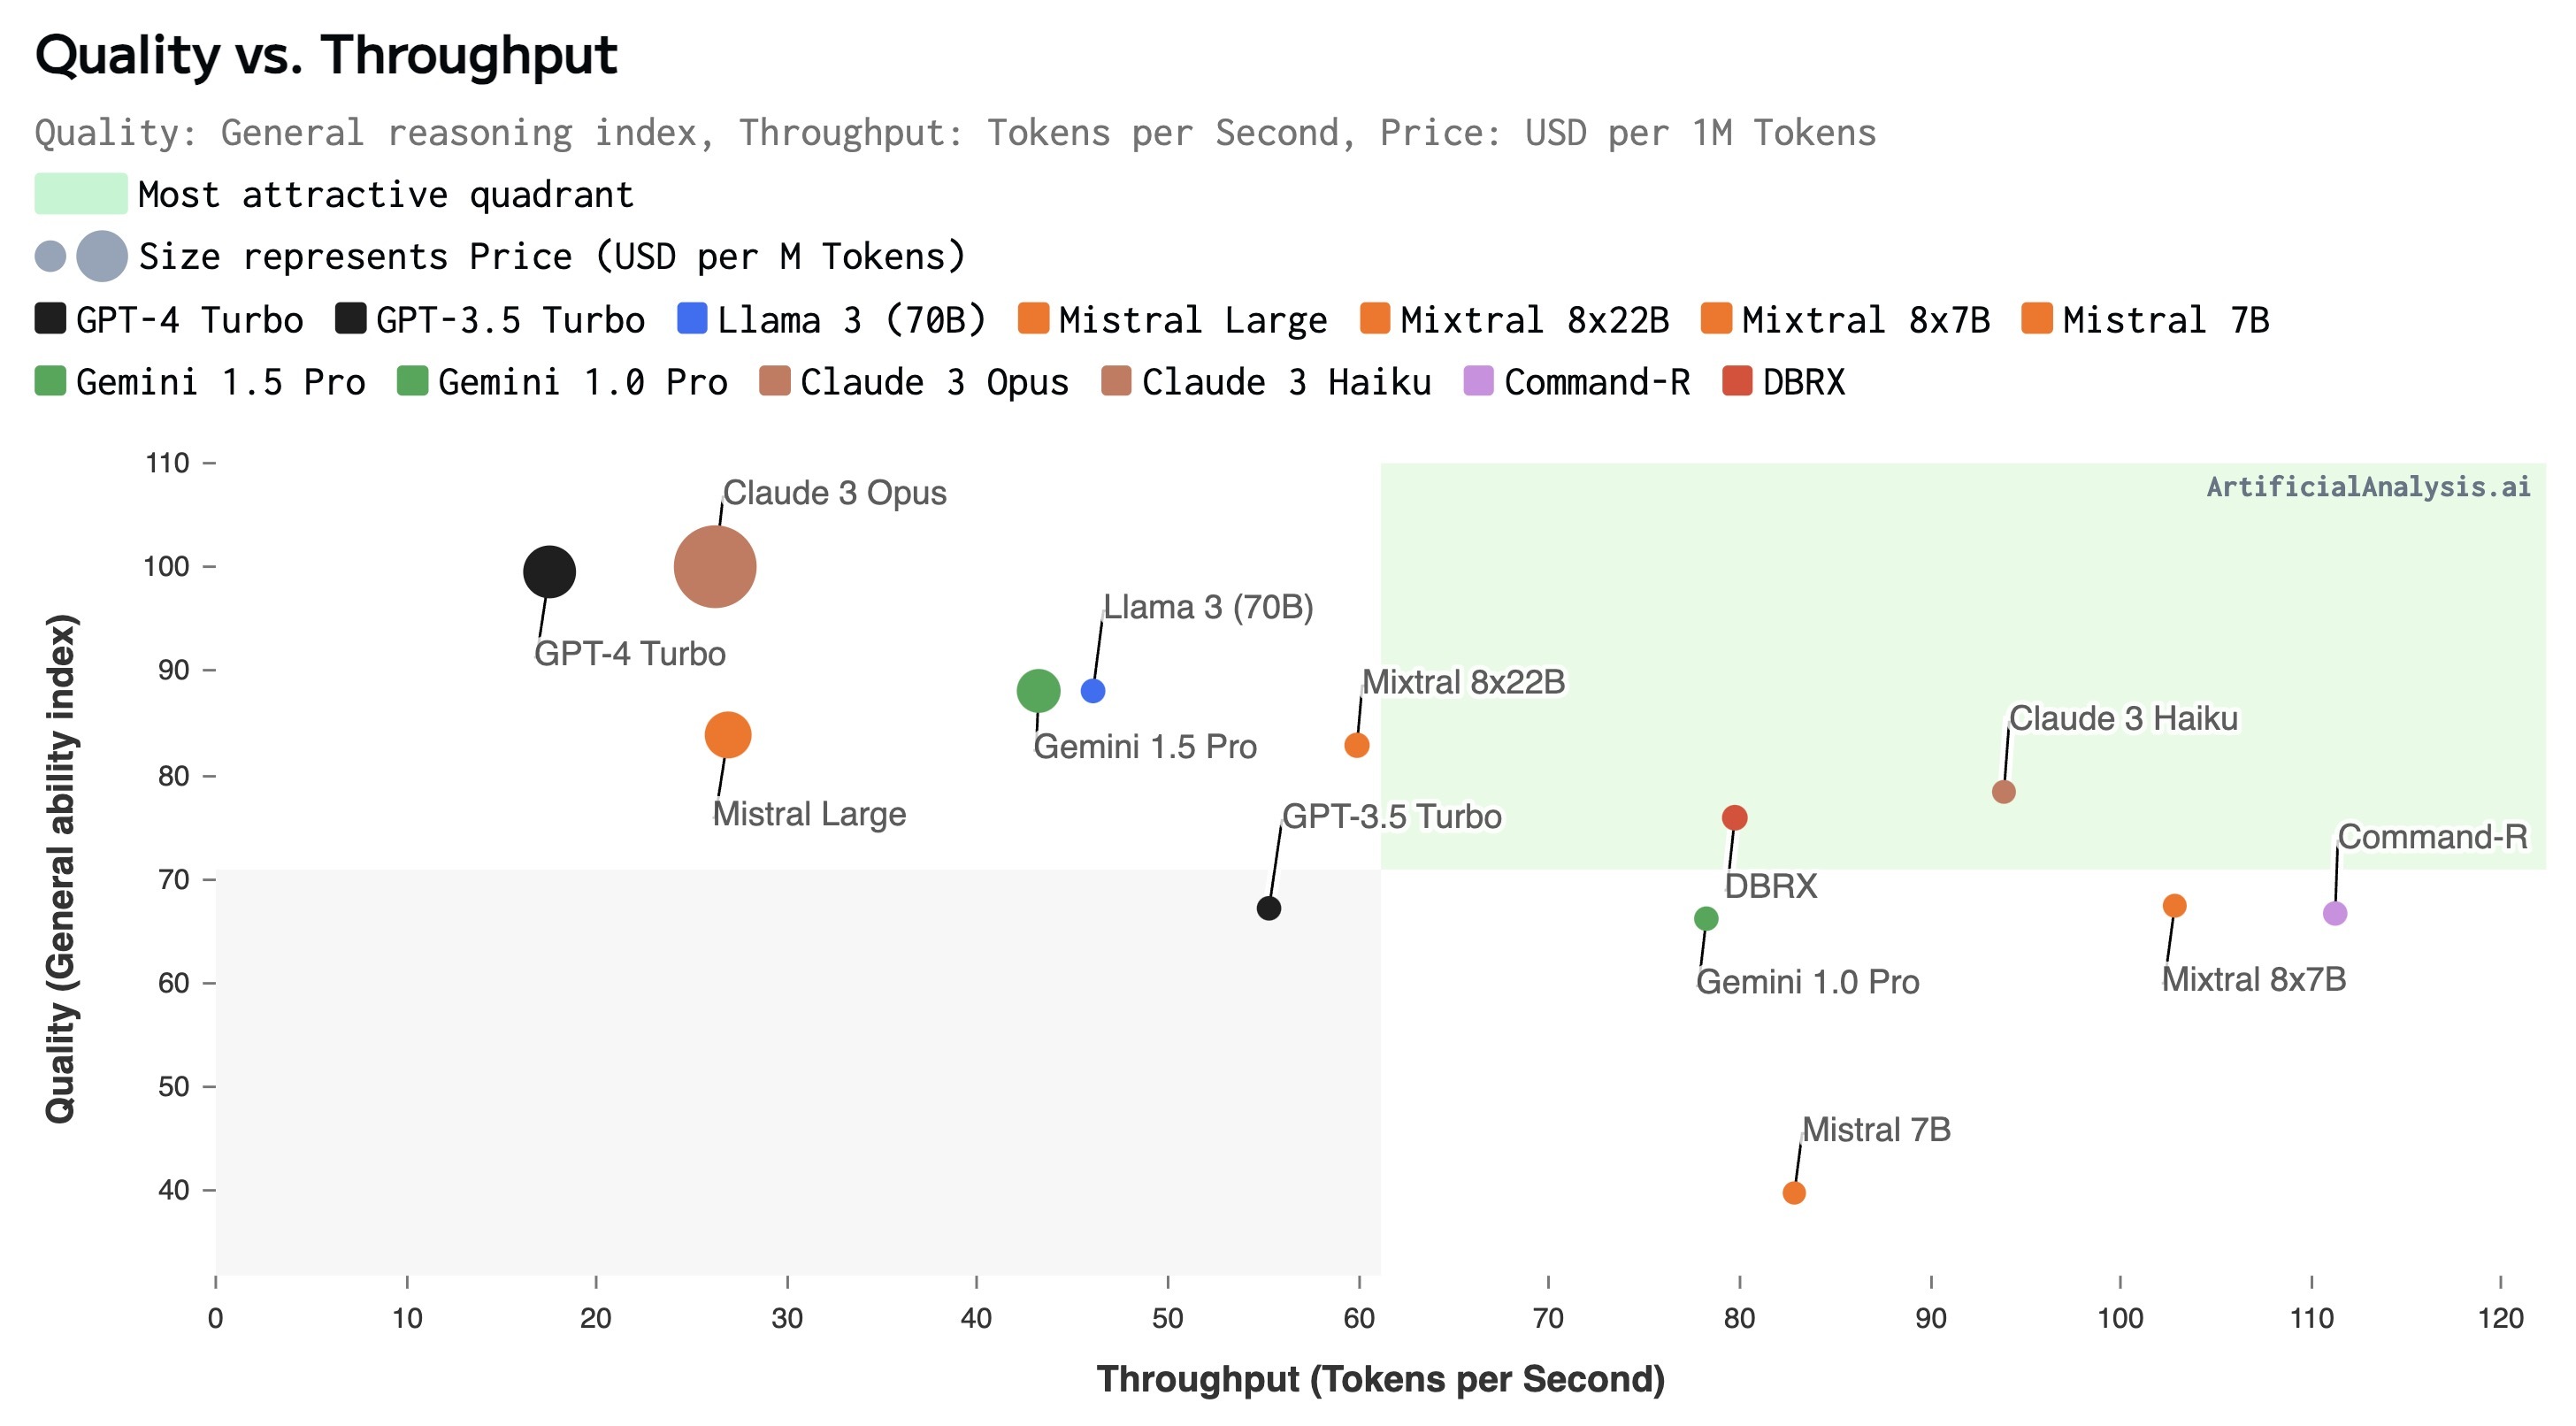
Our chart of Quality vs. Throughput (tokens/s) shows the range of options with different quality and performance characteristics.
Source: artificialanalysis.ai/models
Use Case Example: Speed and Price can be as important as Quality
In some cases, design patterns involving multiple requests with faster and cheaper models can result in not only lower cost but better overall system quality compared to using a single larger model.
For example, consider a chatbot that needs to browse the web to find relevant information from recent news articles. One approach would be to use a large, high-quality model like GPT-4 Turbo to run a search then read and process the top handful of articles. Another would be to use a smaller, faster model like Llama 3 8B to read and extract highlights from dozens web pages in parallel, and then use GPT-4 Turbo to assess and summarize the most relevant results. The second approach will be more cost effective, even after accounting for reading 10x more content, and may result in higher quality results.
Get in touch
Please follow us on Twitter and LinkedIn for updates. We're available via message on either, as well as on our website and via email.