import time
from turtle import width
import torch
import folium
import numpy as np
import pandas as pd
import streamlit as st
from folium.plugins import MarkerCluster
from streamlit_folium import folium_static
def app():
st.write("# Welcome to Ship Detection Application! :satellite:")
st.markdown(
"""
This application is build based on YOLOv5 with extral large model. User just
upload an image, and press the 'Predict' button to make a prediction base on
a training model before **(the explanation of the result from the detection and tutorial how to use the model
is on the bottom of this page. Scroll down or [click here!](#explanation-of-the-ship-detection-result))**.
### For more information, please visit:
- Check out [my github](https://github.com/bills1912)
- Jump into YOLOv5 [documentation](https://docs.ultralytics.com/)
"""
)
ais = pd.read_csv("https://raw.githubusercontent.com/bills1912/marin-vessels-detection/main/data/MarineTraffic_VesselExport_2022-11-25.csv")
ais_jakarta = ais[ais['Destination Port'] == 'JAKARTA']
ais_list = ais_jakarta.values.tolist()
f = folium.Figure(width=1000, height=500)
jakarta_vessels = folium.Map(location=[-5.626954250925966, 106.70735731868719], zoom_start=8).add_to(f)
ais_data = folium.FeatureGroup(name="marine_vessels")
mCluster = MarkerCluster(name="Marine Vessels")
for i in ais_list:
html = f"{i[1]}
Vessel Type: {i[8]} Destination Port: {i[2]} Reported Destination: {i[4]} Current Port: {i[6]}\
Latitude: {i[10]} Longitude: {i[11]}"
iframe = folium.IFrame(html)
popup = folium.Popup(iframe, min_width=250, max_width=300)
ais_data.add_child(mCluster.add_child(folium.Marker(location=[i[10], i[11]], popup=popup, icon=folium.Icon(color="black", icon="ship", prefix="fa"))))
jakarta_vessels.add_child(ais_data)
folium_static(jakarta_vessels, width=1100, height=700)
st.markdown(
"""
## Explanation of The Ship Detection Result
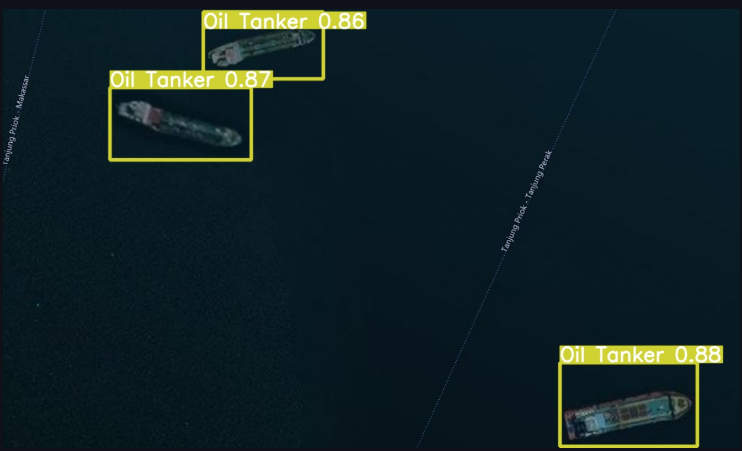
Here is the explanation of the result from the example on the image above:\
- **box**, indicate the object that the model can detect;
- **label of the box**, indicate the name of the object that the model detect;
- **number beside the label**, indicate how much the confidence of the model detect the object;
## Tutorial How to Use Ship Detection Model
Here is the step by step how to use the model on this dashboard:
- first, **prepare the satellite imagery image** that you want to use. If you don't have the image, you can use this sample image, by clicking the **"Download Image"** on the end of this dashboard usage explanation;
- then, **choose the model** that you want to use **(on the side bar)**, **YOLOv5x6 Model** to use the YOLOv5x6 model or **Fine-Tuning Model** to use the fine-tuning model (study case: Tanjung Priok Port);
- to upload your image, **click the "Browse File"** button, then upload your image;
- after the image is uploaded, **right click the image** and then **copy the image address** by clicking **"Copy image address"** button;
- then **paste the image address** on the box below the image;
- finally, **click the "Predict"** button to start the detection of the object inside your image. Wait untill the result appear.
""", unsafe_allow_html=True
)
with open("apps/image/sample.jpg", "rb") as file:
st.download_button(
label="Download Sample Image",
data=file,
file_name="sample.jpg",
mime="image/jpg"
)