Introduction
Large Language Models (LLMs) are becoming a prominent generative AI tool, where the user enters a query and the LLM generates an answer. To reduce harm and misuse, efforts have been made to align these LLMs to human values using advanced training techniques such as Reinforcement Learning from Human Feedback (RLHF). However, recent studies have highlighted the vulnerability of LLMs to adversarial jailbreak attempts aiming at subverting the embedded safety guardrails. To address this challenge, we define and investigate the Refusal Loss of LLMs and then propose a method called Gradient Cuff to detect jailbreak attempts. In this demonstration, we first introduce the concept of "Jailbreak". Then we present the refusal loss landscape and propose the Gradient Cuff based on the characteristics of this landscape. Lastly, we compare Gradient Cuff with other jailbreak defense methods and show the defense performance.
What is Jailbreak?
Jailbreak attacks involve maliciously inserting or replacing tokens in the user instruction or rewriting it to bypass and circumvent the safety guardrails of aligned LLMs. A notable example is that a jailbroken LLM would be tricked into generating hate speech targeting certain groups of people, as demonstrated below.

Refusal Loss
Current transformer-based LLMs will return different responses to the same query due to the randomness of autoregressive sampling-based generation. With this randomness, it is an interesting phenomenon that a malicious user query will sometimes be rejected by the target LLM, but sometimes be able to bypass the safety guardrail. Based on this observation, we propose a new concept called Refusal Loss and visualize its 2-d landscape below:

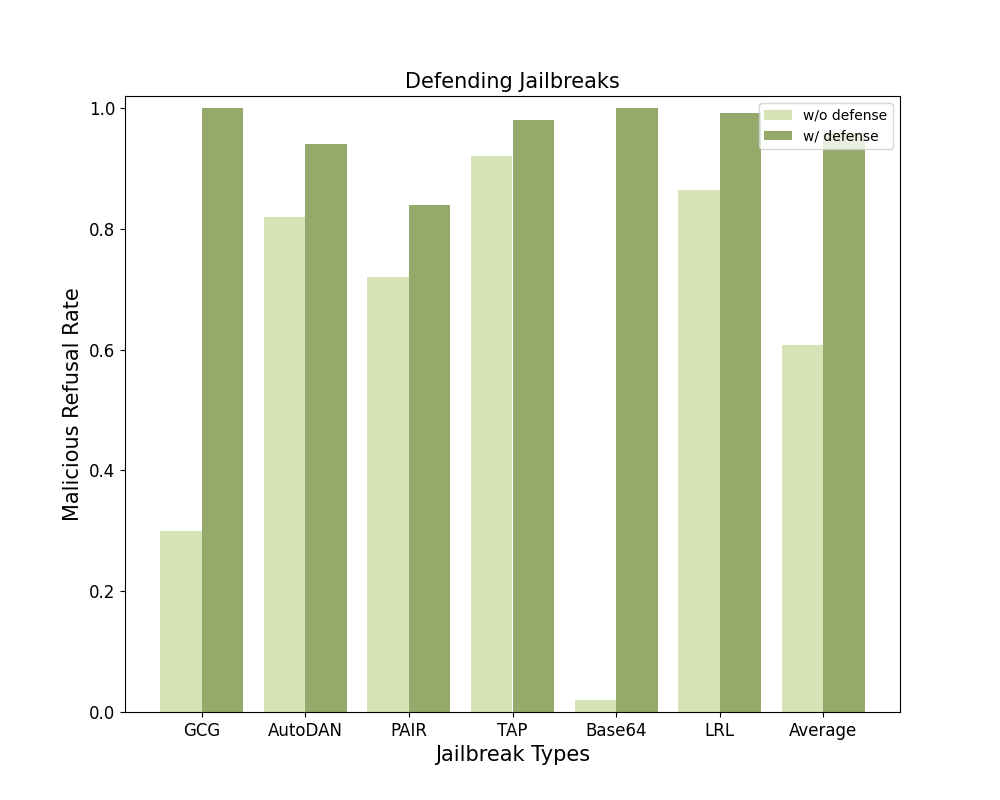
Proposed Approach: Gradient Cuff

Demonstration
In the current research, a reliability diagram is drawn to show the calibration performance of a model. However, since reliability diagrams often only provide fixed bar graphs statically, further explanation from the chart is limited. In this demonstration, we show how to make reliability diagrams interactive and insightful to help researchers and developers gain more insights from the graph. Specifically, we provide three CIFAR-100 classification models in this demonstration. Multiple Bin numbers are also supported
We hope this tool could also facilitate the development process.
Citations
If you find Neural Clamping helpful and useful for your research, please cite our main paper as follows:
@inproceedings{hsiung2023nctv,
  title={{NCTV: Gradient Cuff: Detecting Jailbreak Attacks on Large Language Models by Exploring Refusal Loss Landscapes}},
  author={Lei Hsiung, Yung-Chen Tang and Pin-Yu Chen and Tsung-Yi Ho},
  booktitle={Proceedings of the Thirty-Seventh AAAI Conference on Artificial Intelligence},
  publisher={Association for the Advancement of Artificial Intelligence},
  year={2023},
  month={February}
}

@misc{tang2022neural_clamping,
  title={{Neural Clamping: Joint Input Perturbation and Temperature Scaling for Neural Network Calibration}},
  author={Yung-Chen Tang and Pin-Yu Chen and Tsung-Yi Ho},
  year={2022},
  eprint={2209.11604},
  archivePrefix={arXiv},
  primaryClass={cs.LG}
}