Spaces:
Running


A newer version of the Gradio SDK is available:
6.0.2
TraceMind-AI - Screenshots & Visual Guide
This document provides annotated screenshots of all screens in TraceMind-AI to help you understand the interface at a glance.
Live Demo: https://huggingface.co/spaces/MCP-1st-Birthday/TraceMind
📊 Screen 1: Leaderboard
Purpose: Browse all agent evaluation runs with AI-powered insights
The Leaderboard is the central hub for comparing agent performance across different models, configurations, and benchmarks.
Leaderboard Table
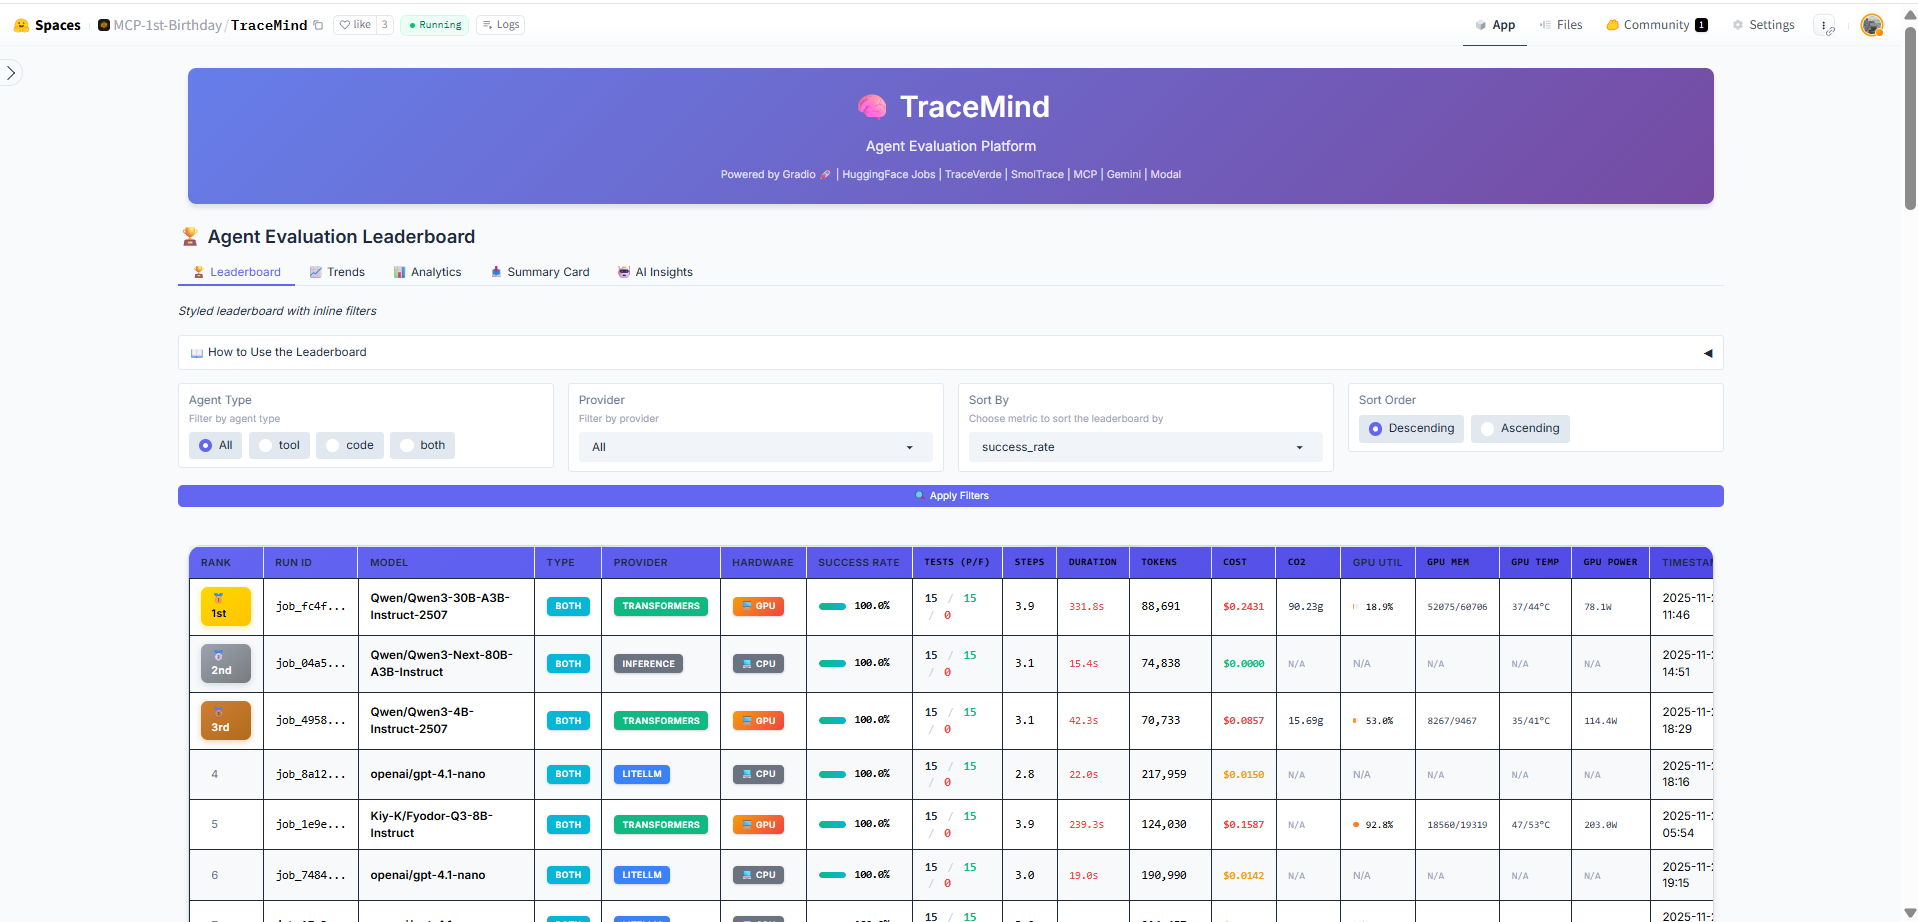
The main leaderboard table displays all evaluation runs with sortable columns including model name, agent type, success rate, token usage, duration, cost, and CO2 emissions. Click any row to drill down into detailed run results. Use the search and filter options to find specific runs.
Summary Cards
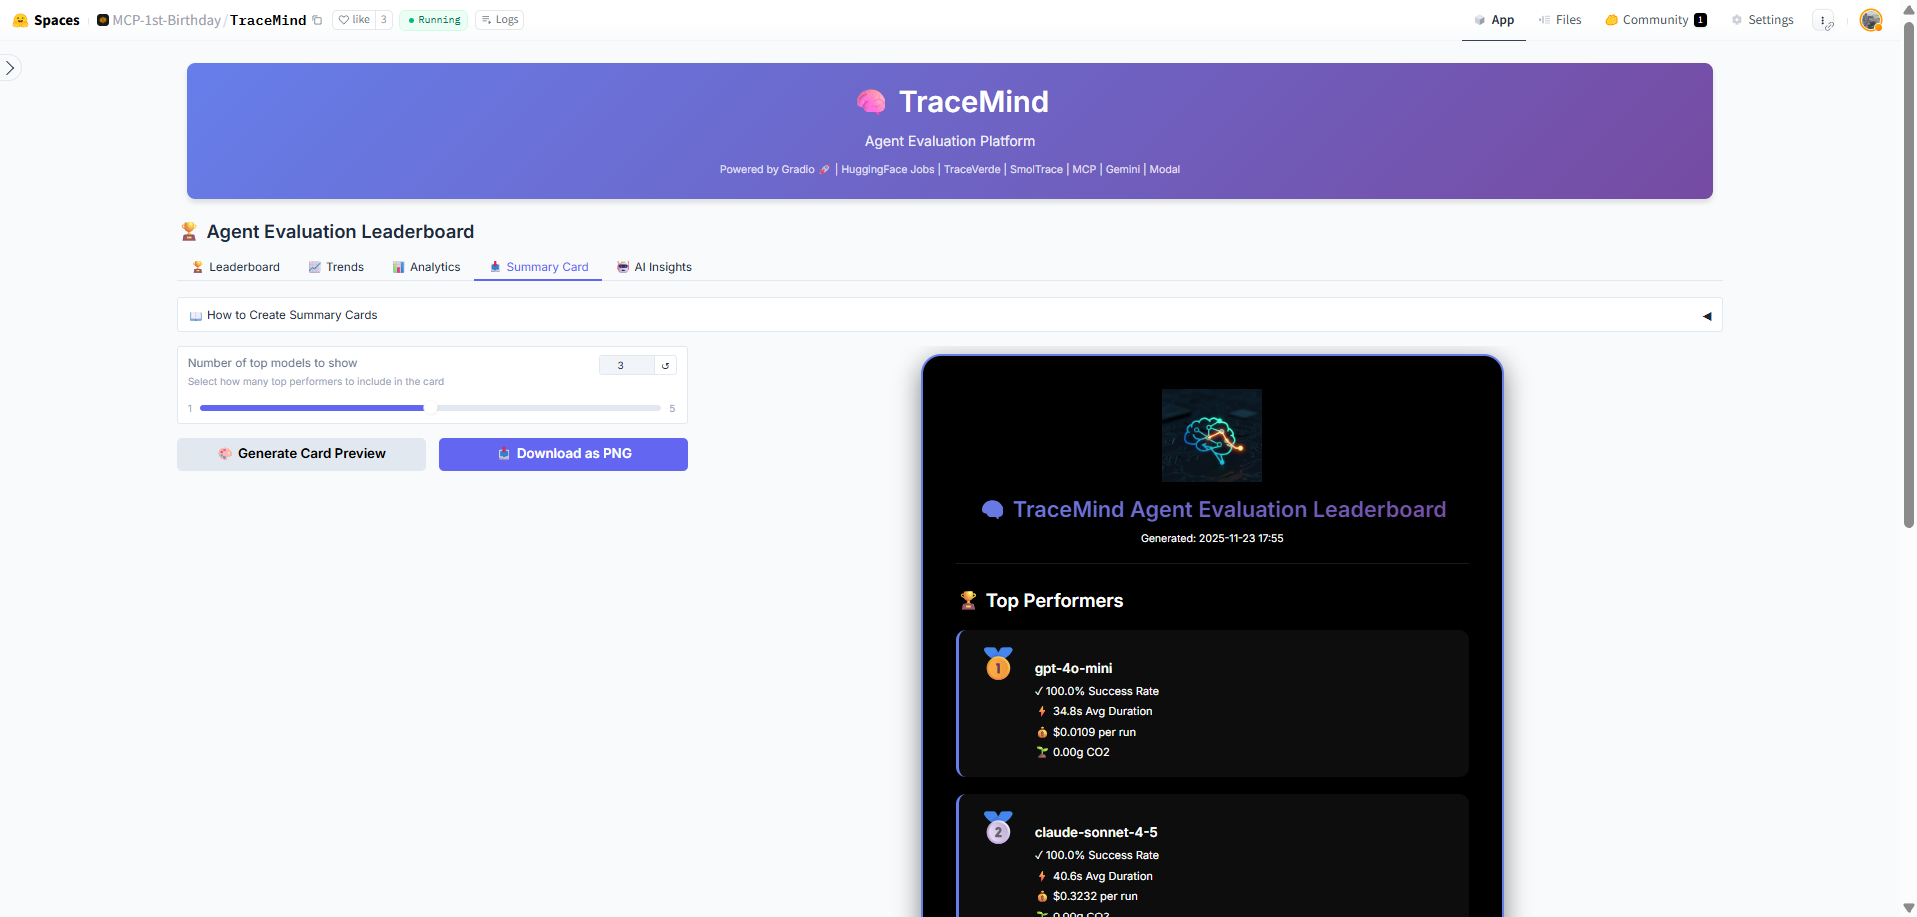
Quick-glance summary cards show key metrics: total evaluations, average success rate, total tokens processed, and estimated costs. These cards update dynamically based on your current filter selection.
AI Insights Tab
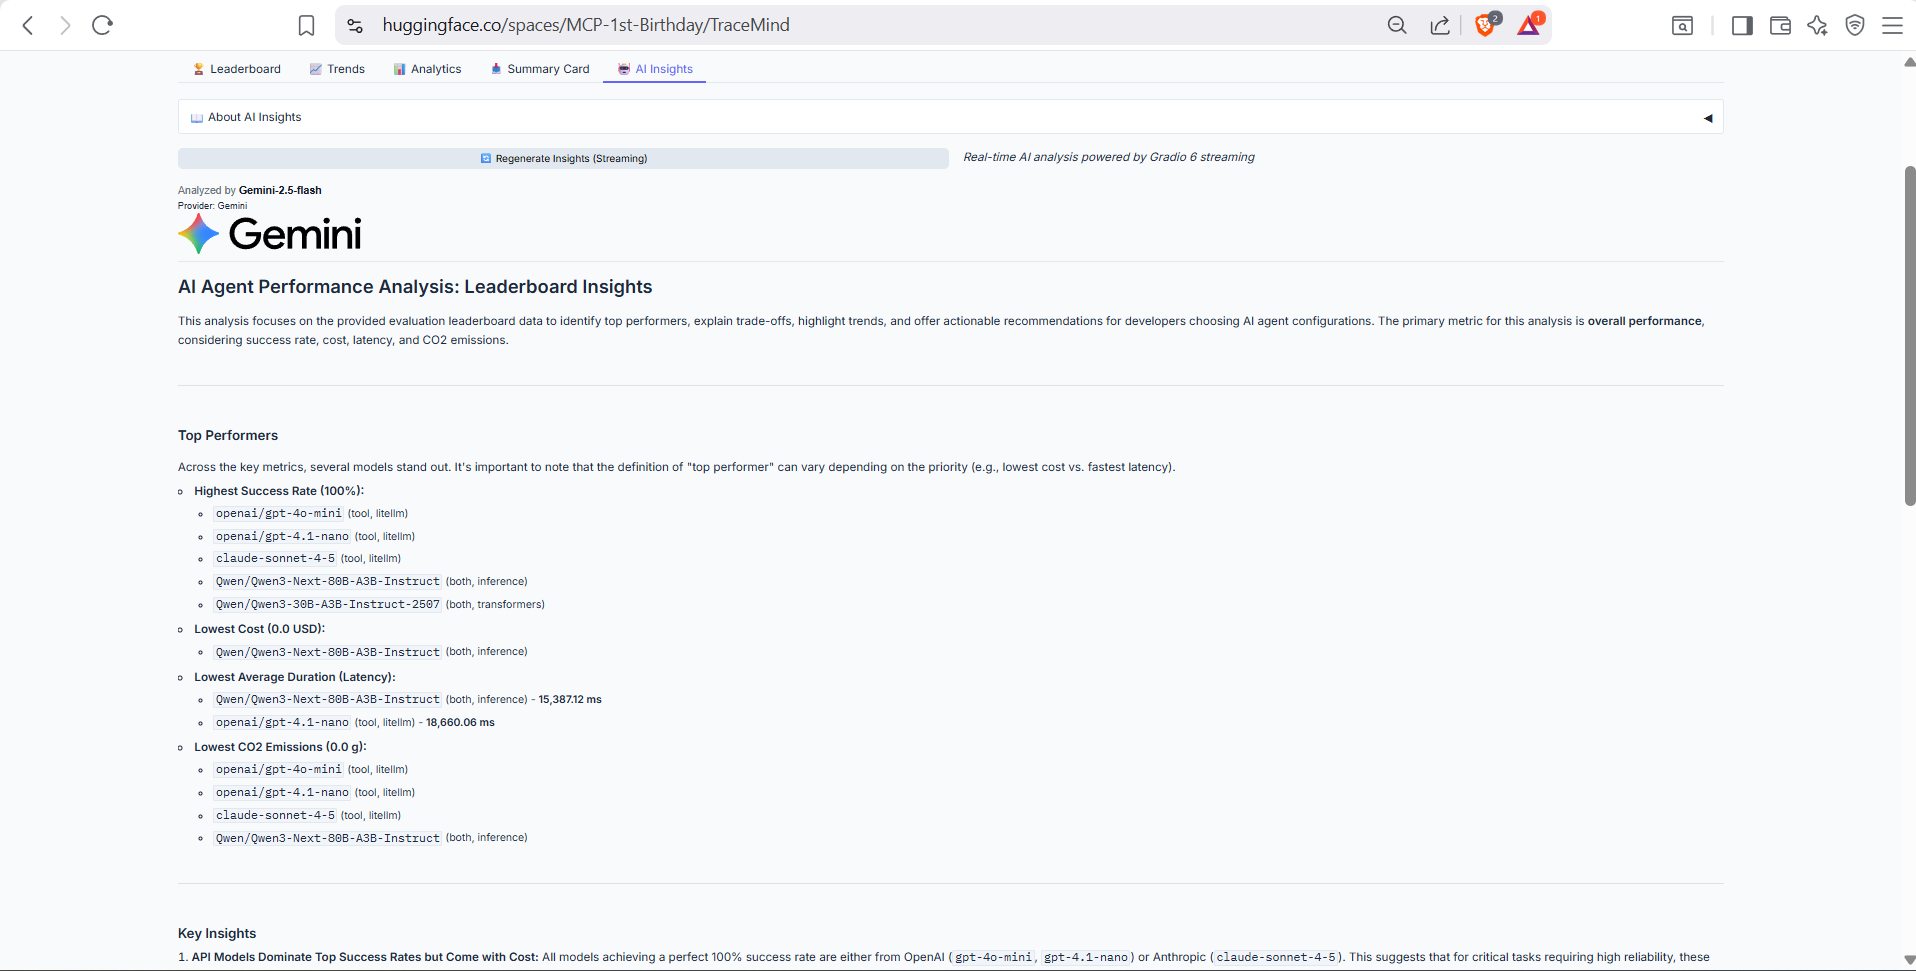
AI-powered analysis of the leaderboard data, generated using the TraceMind MCP Server's analyze_leaderboard tool. Provides intelligent summaries of trends, top performers, and recommendations based on your evaluation history.
Analytics - Cost Efficiency
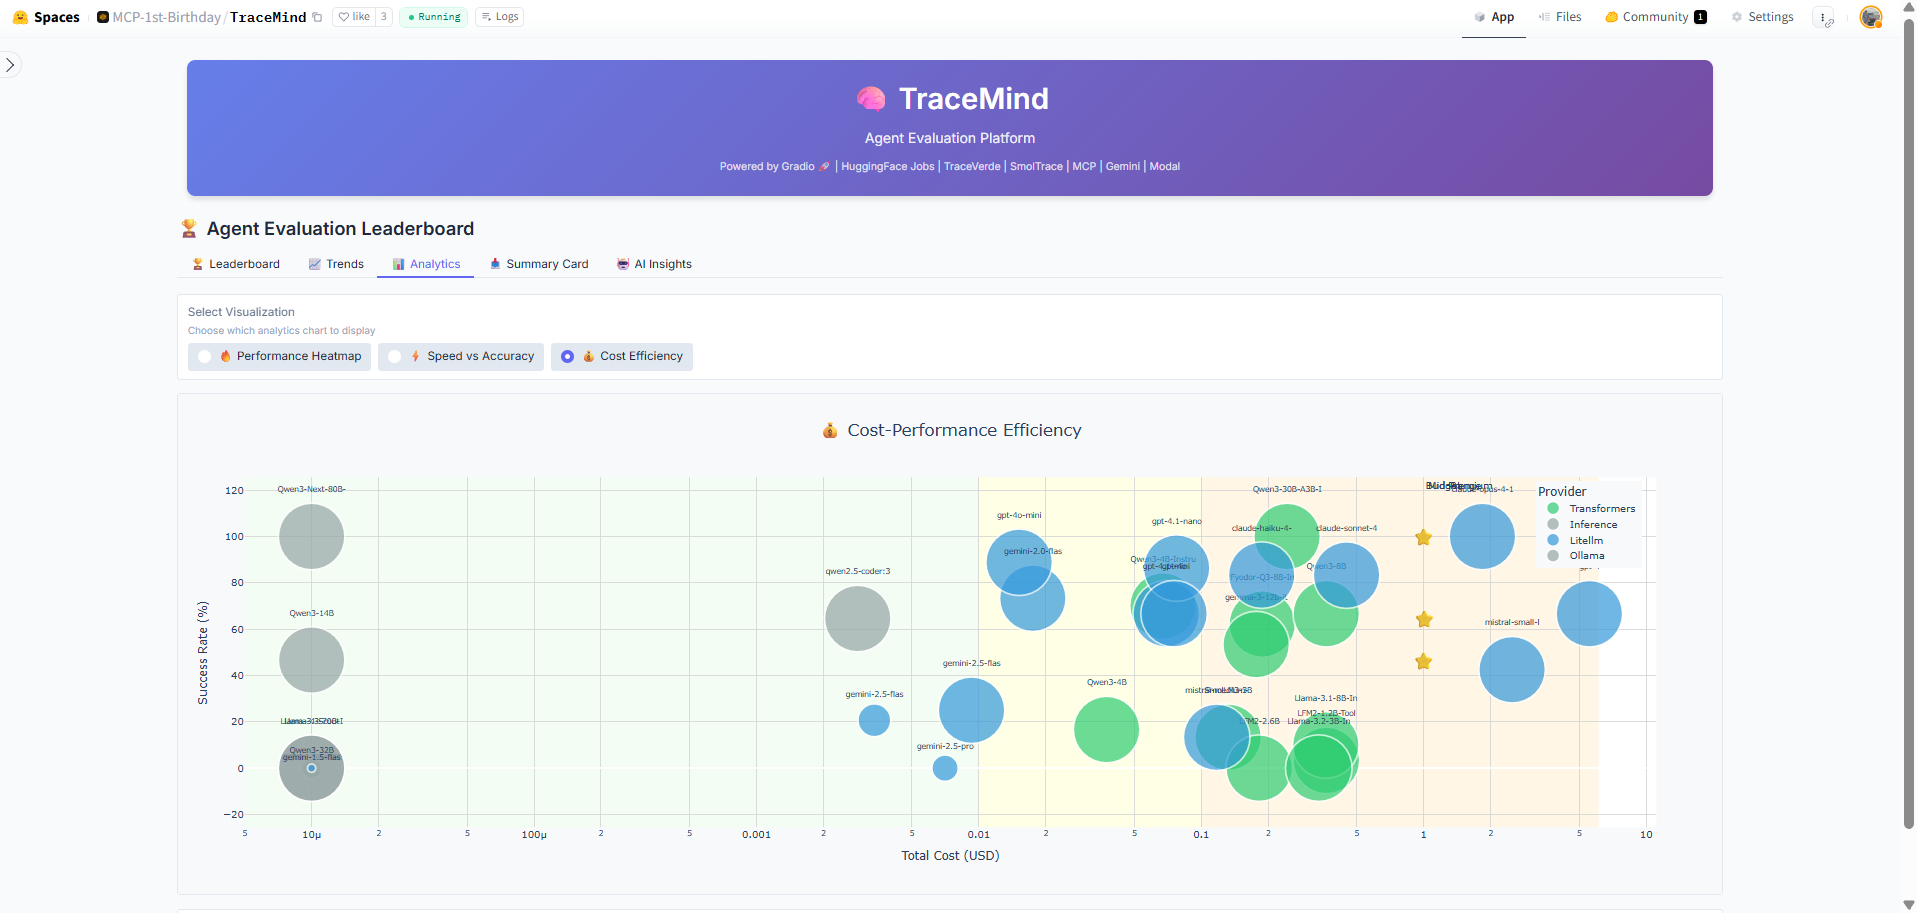
Interactive chart comparing cost efficiency across different models. Visualizes the relationship between accuracy achieved and cost per evaluation, helping you identify the most cost-effective models for your use case.
Analytics - Performance Heatmap
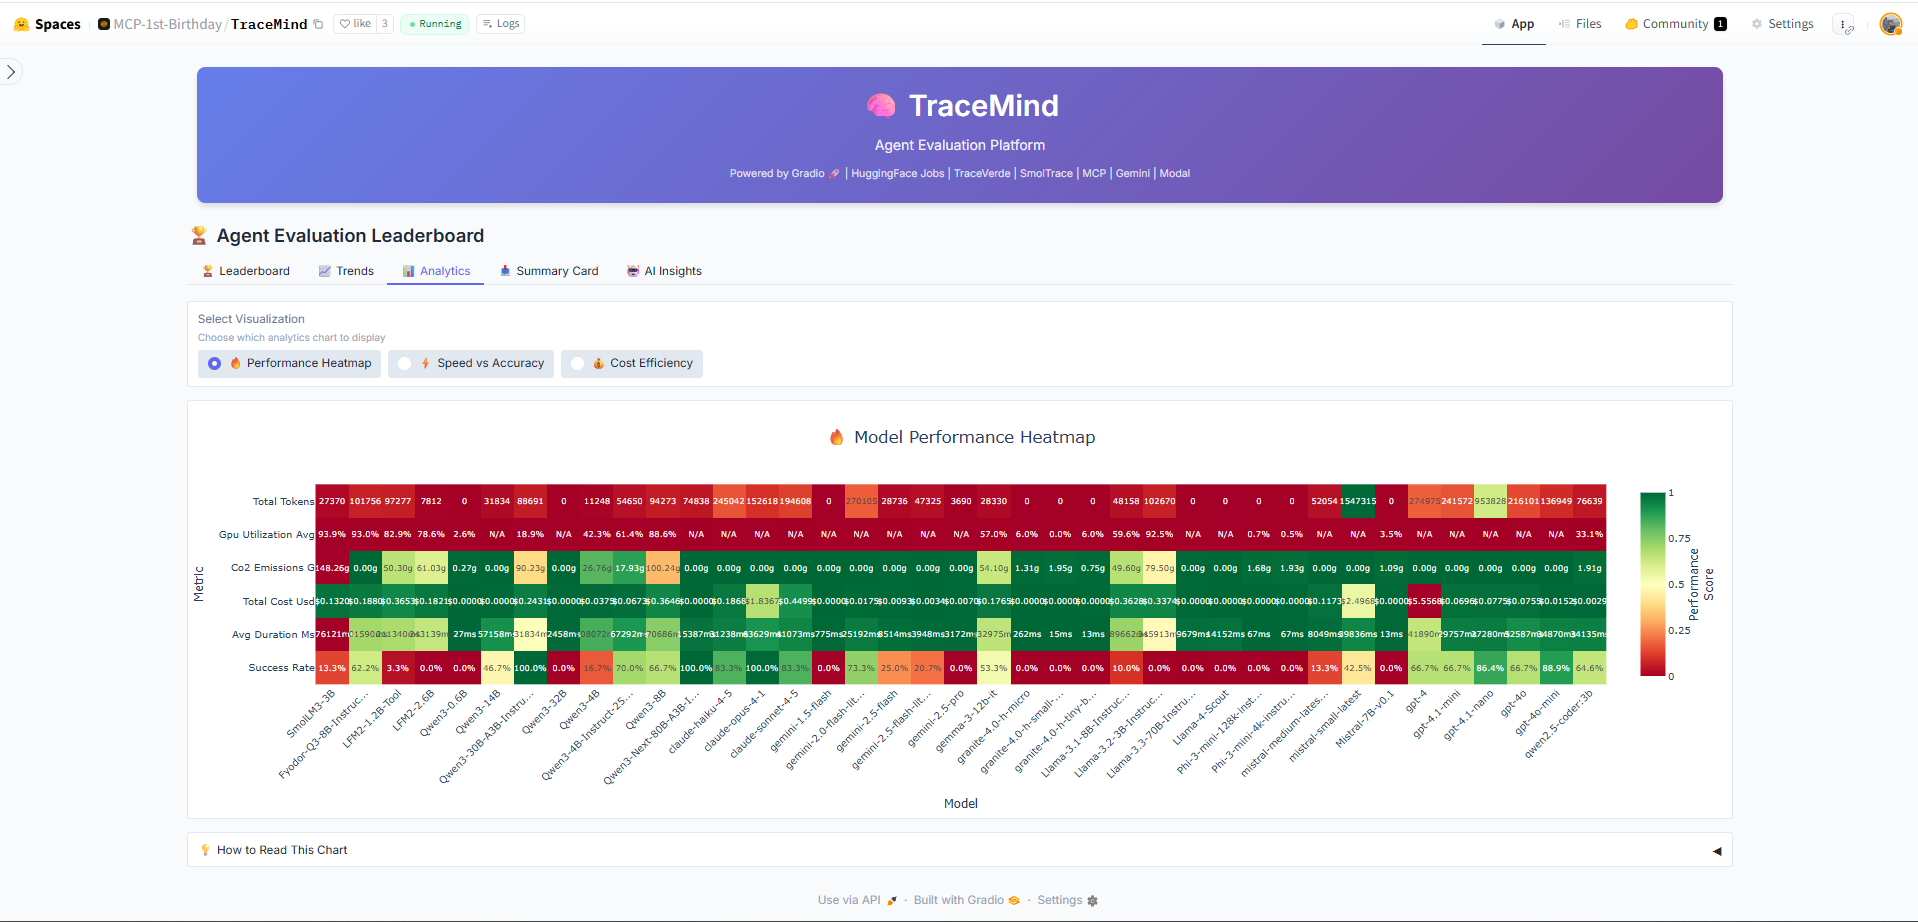
Heatmap visualization showing performance patterns across different test categories and models. Darker colors indicate higher success rates, making it easy to spot strengths and weaknesses of each model.
Analytics - Speed vs Accuracy
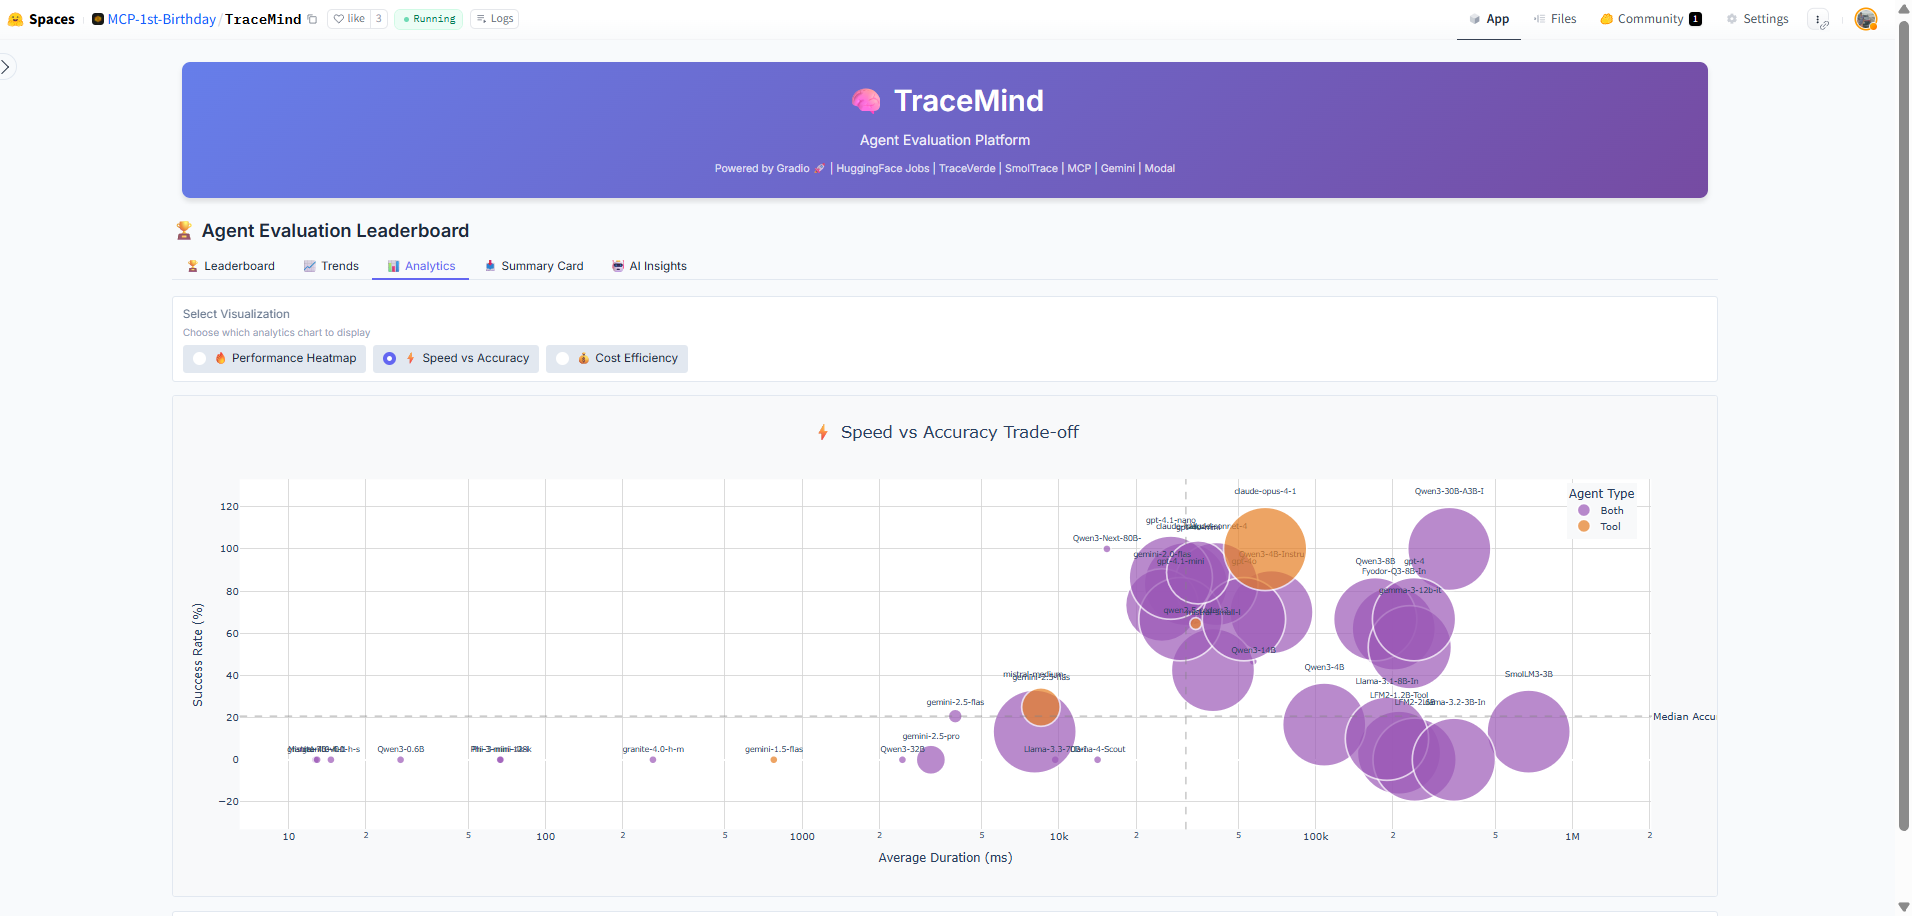
Scatter plot comparing execution speed against accuracy for all runs. Helps identify models that offer the best balance of speed and quality for time-sensitive applications.
Trends Tab
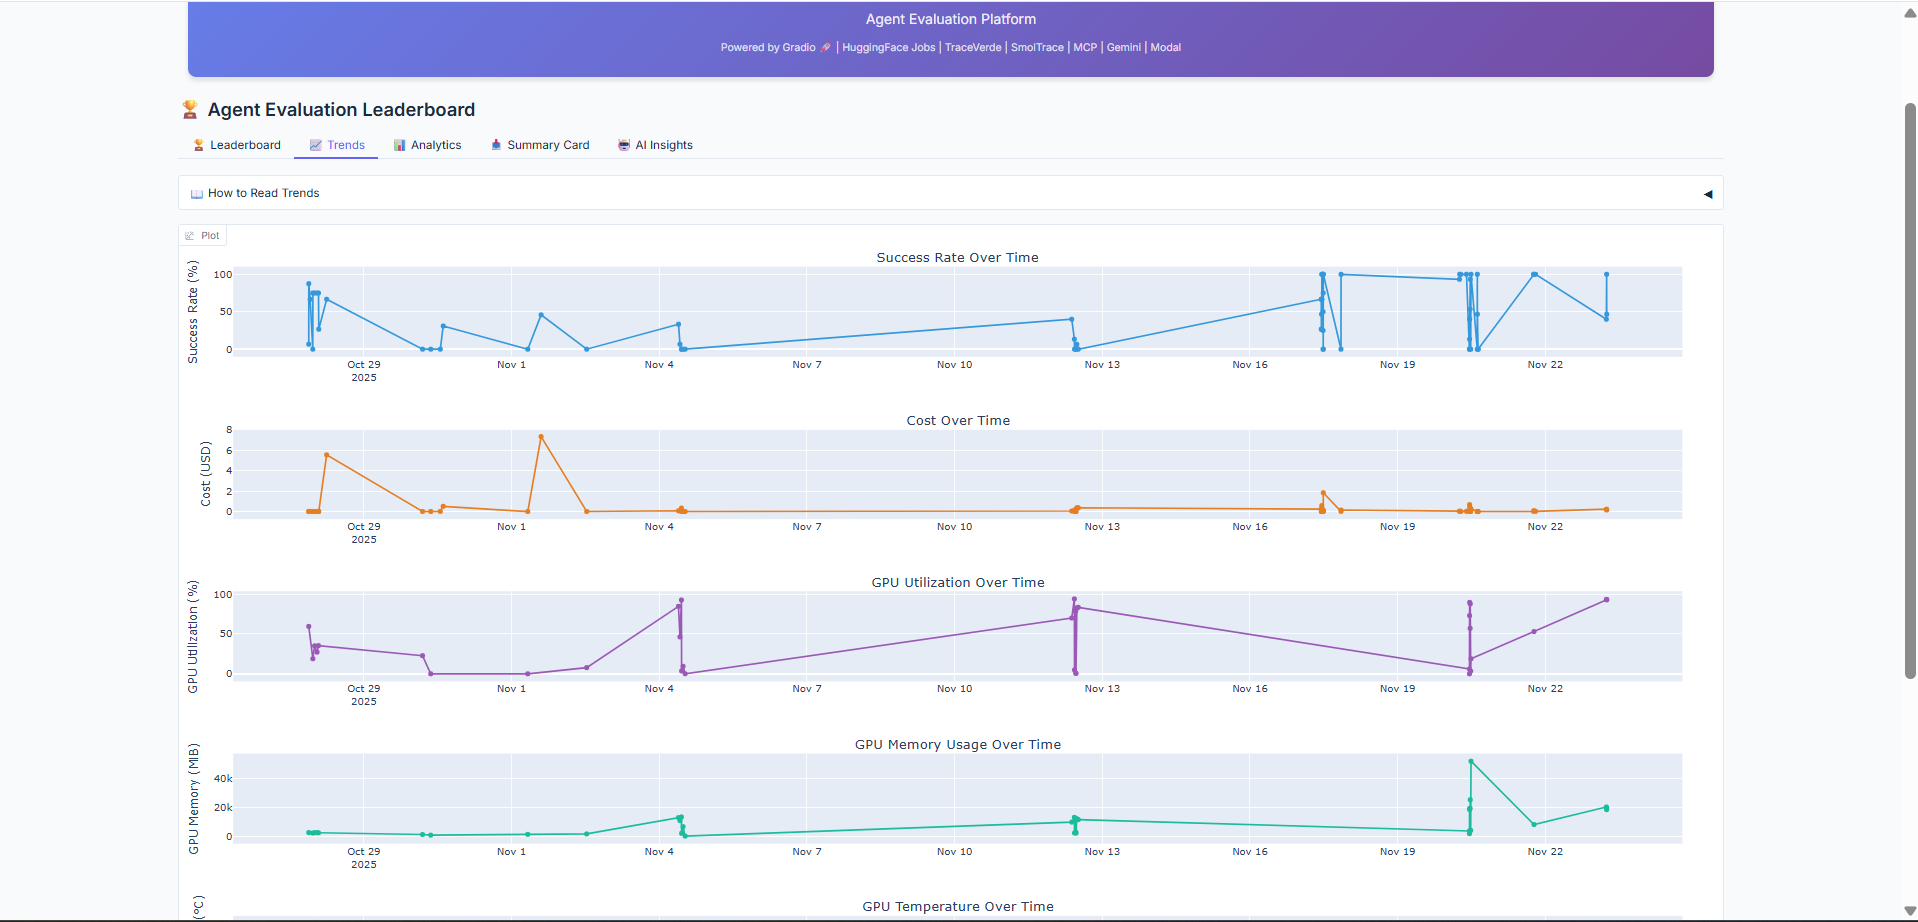
Historical trends showing how model performance has evolved over time. Track improvements in accuracy, cost reduction, and speed optimization across your evaluation history.
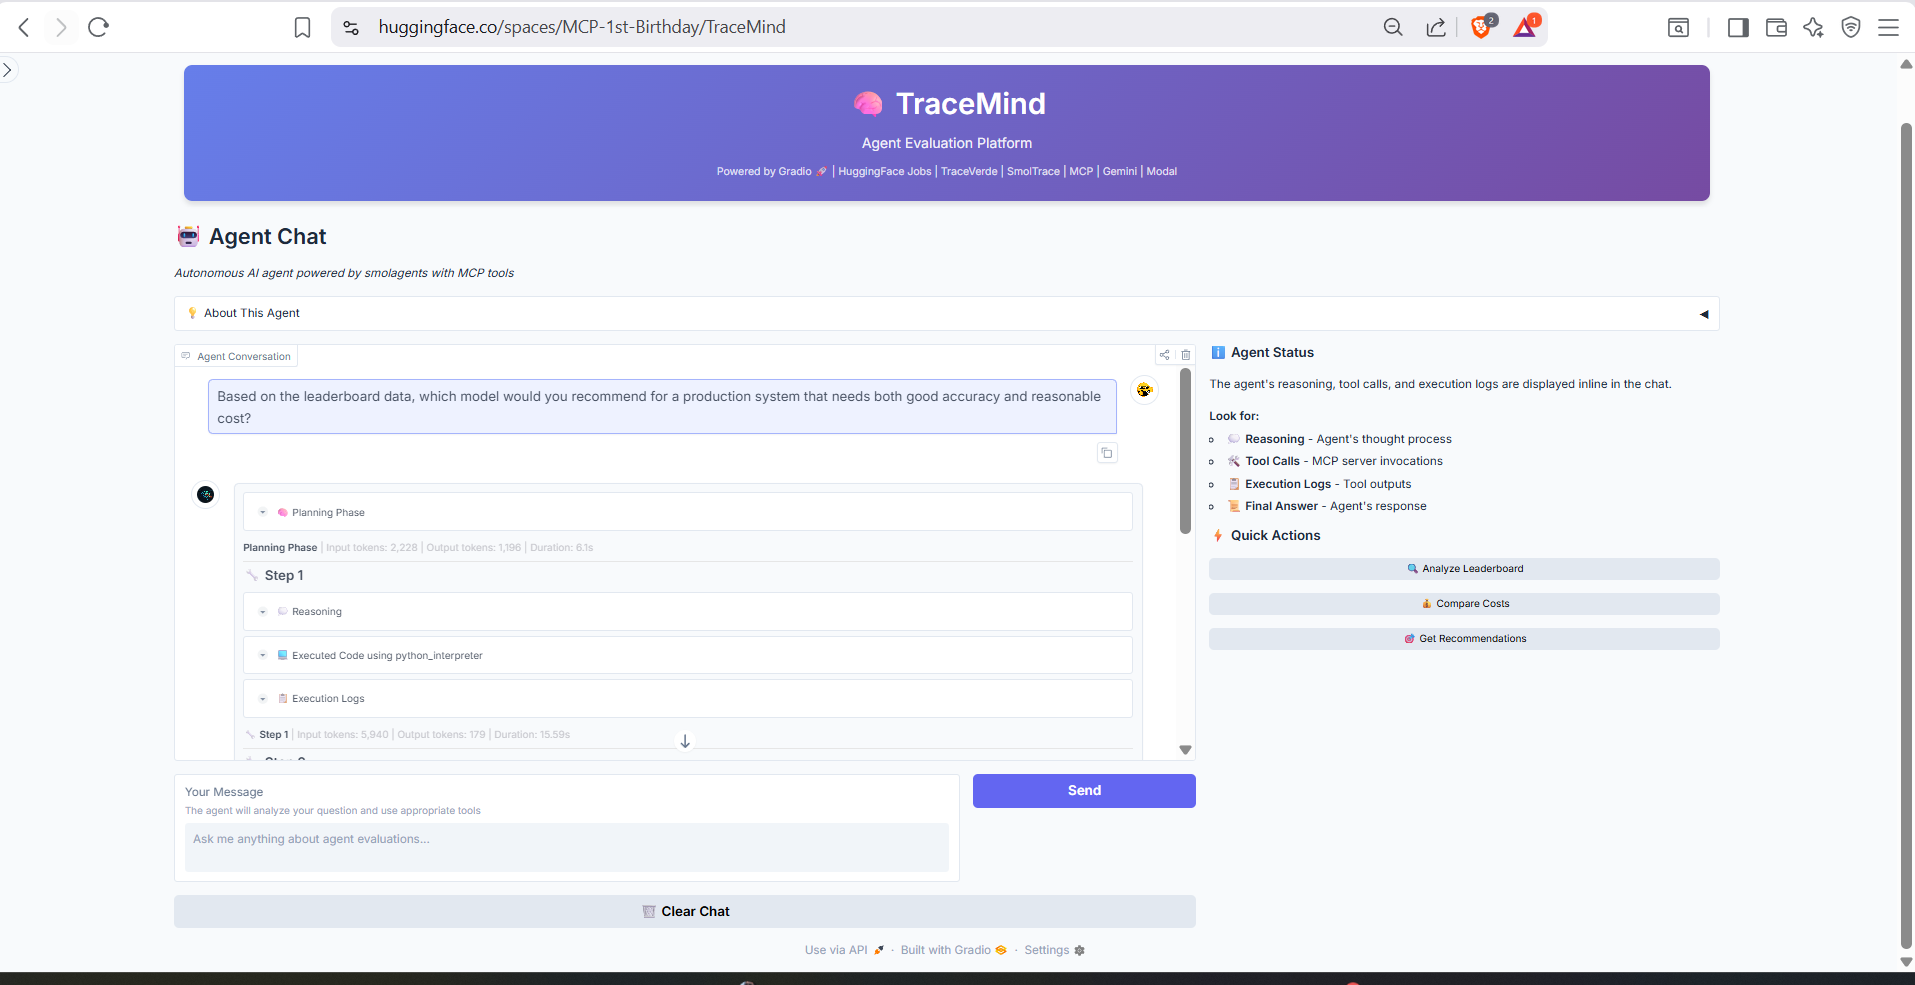
🤖 Screen 2: Agent Chat
Purpose: Interactive autonomous agent powered by MCP tools
The Agent Chat provides a conversational interface to interact with the TraceMind MCP Server. Ask questions about your evaluations, request analysis, or generate insights using natural language.
Chat Interface (Part 1)
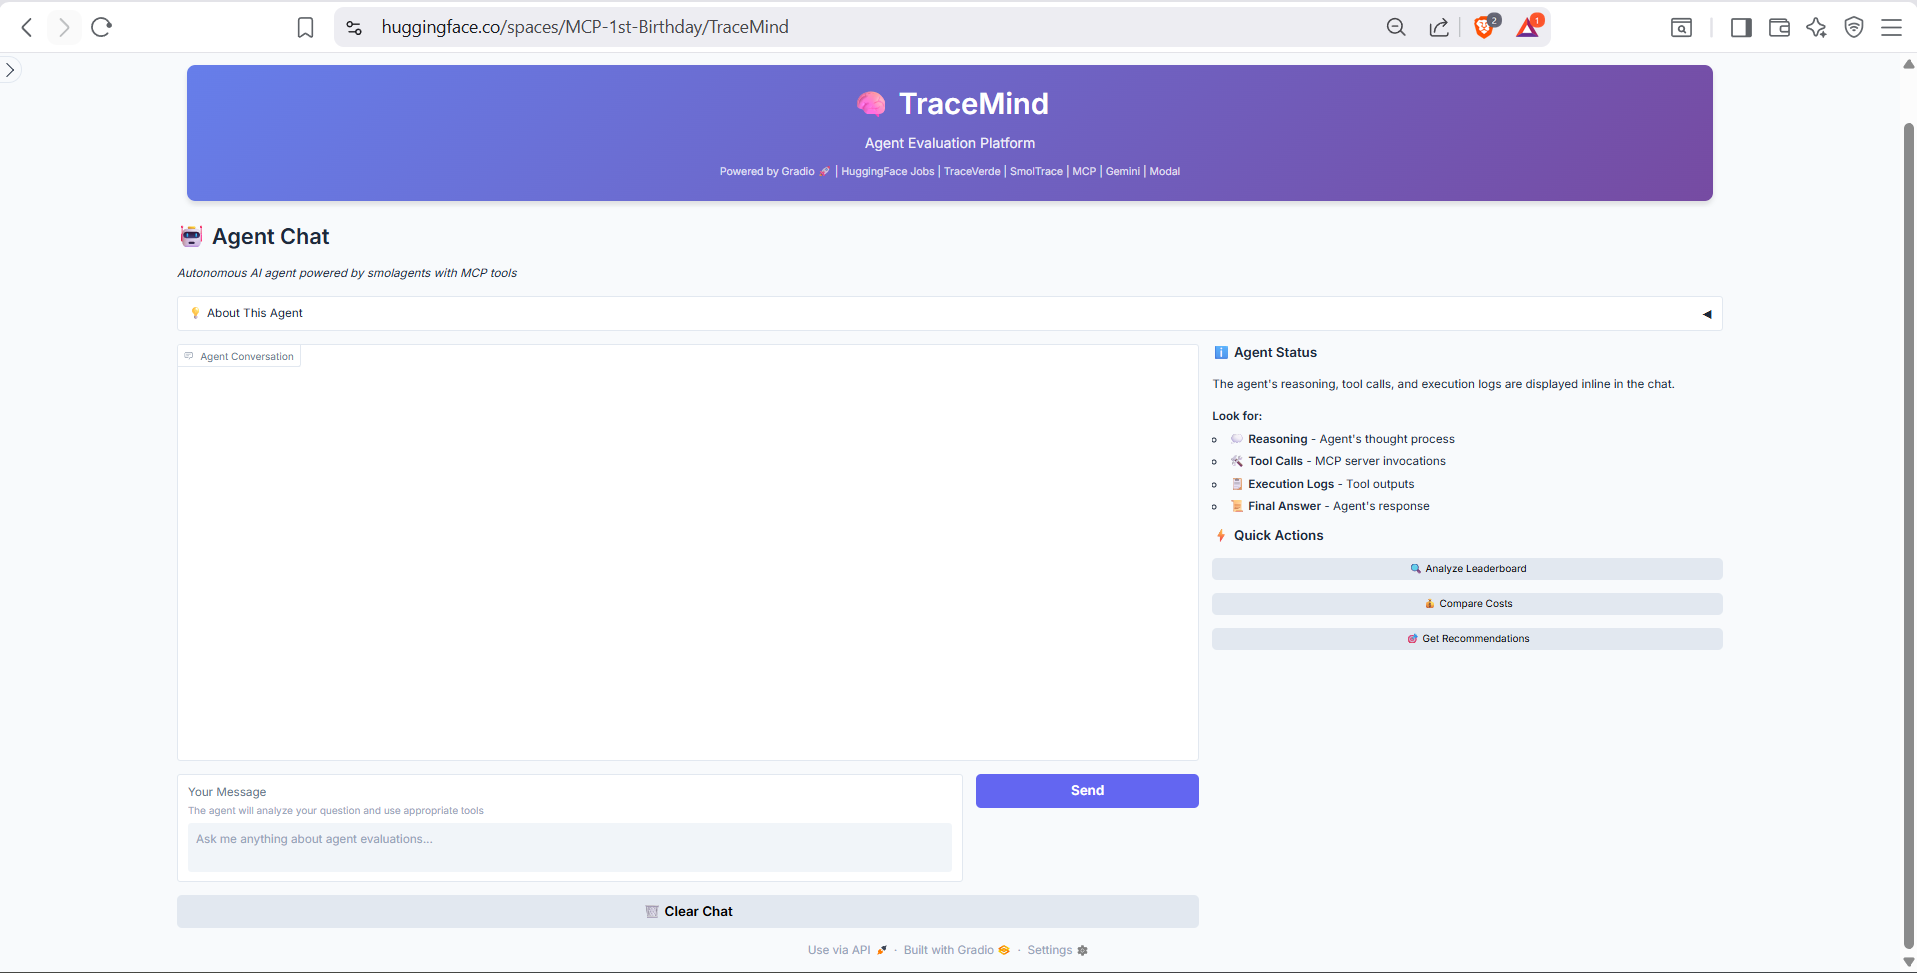
The chat interface header and input area. Type natural language queries like "What was my best performing model last week?" or "Compare GPT-4 vs Claude on code generation tasks." The agent autonomously selects and executes appropriate MCP tools.
Chat Interface (Part 2)
Example conversation showing the agent executing MCP tools to answer questions. Notice how the agent shows its reasoning process and which tools it's using, providing full transparency into the analysis workflow.
Chat Interface (Part 3)
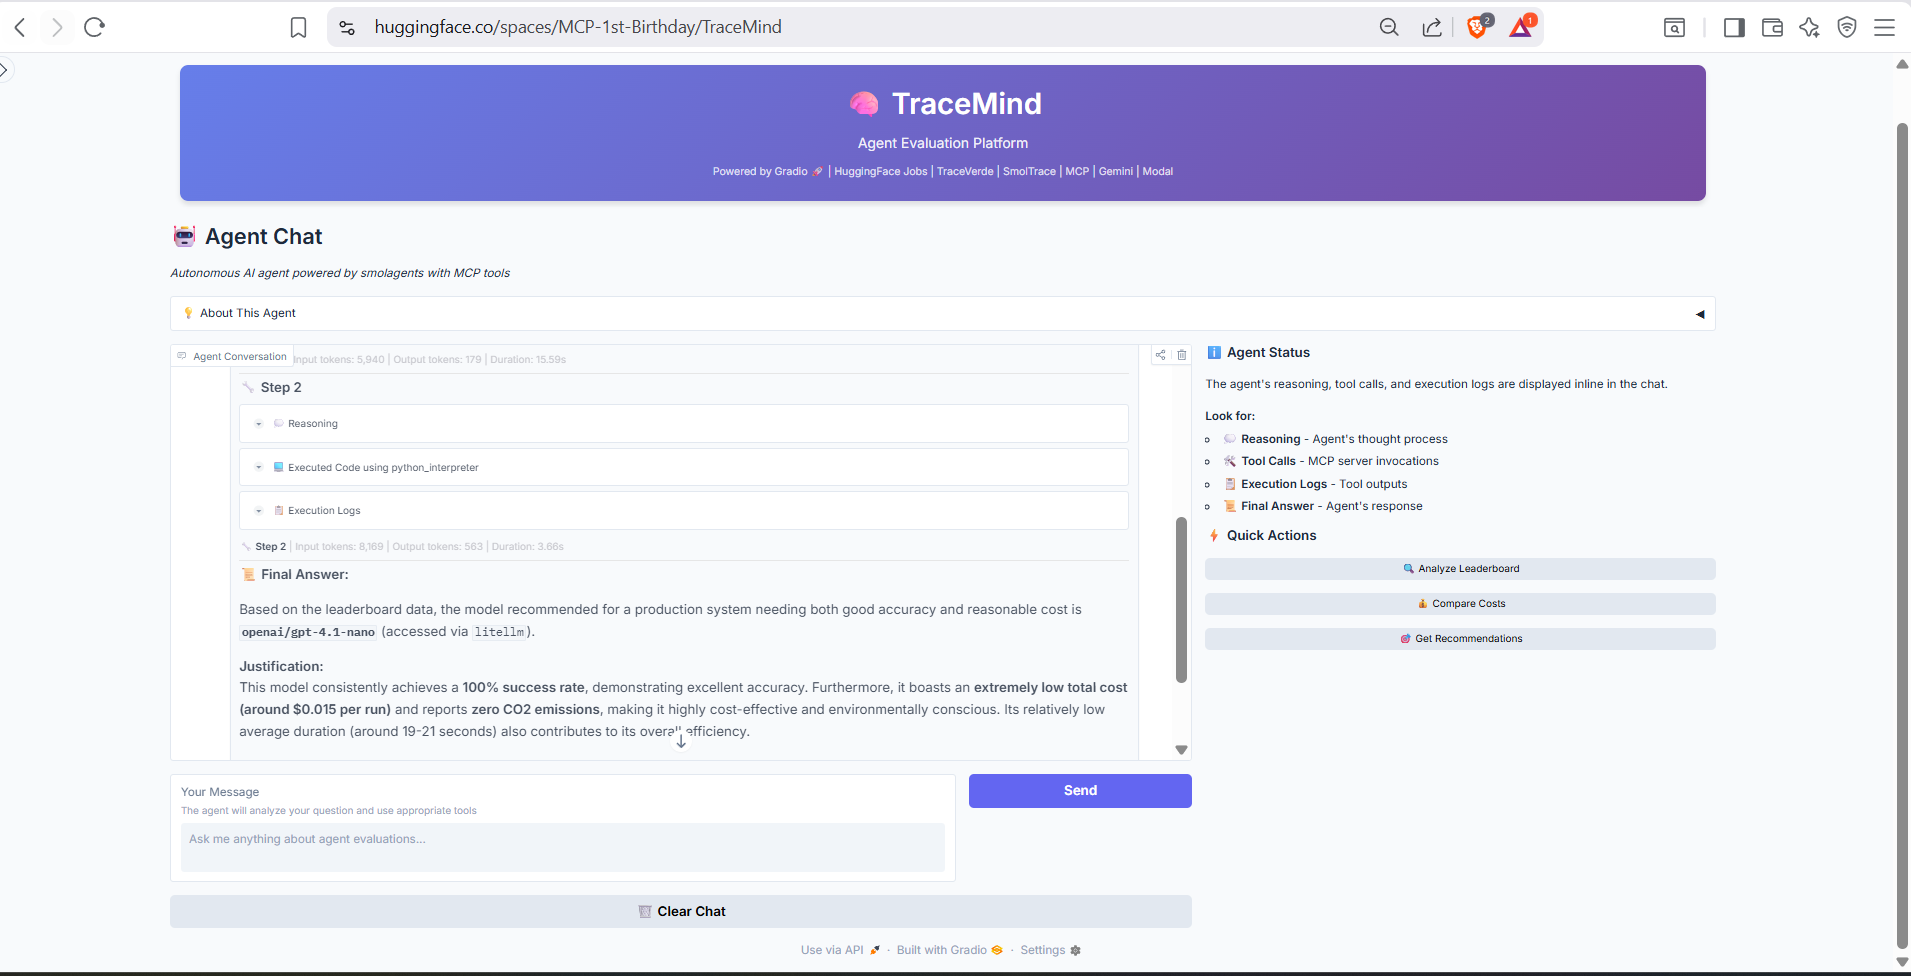
Extended conversation demonstrating multi-turn interactions. The agent maintains context across messages, allowing for follow-up questions and iterative exploration of your evaluation data.
🚀 Screen 3: New Evaluation
Purpose: Submit evaluation jobs to HuggingFace Jobs or Modal
Configure and submit new agent evaluation jobs directly from the UI. Supports both API-based models (via LiteLLM) and local models (via Transformers).
Configuration Form (Part 1)
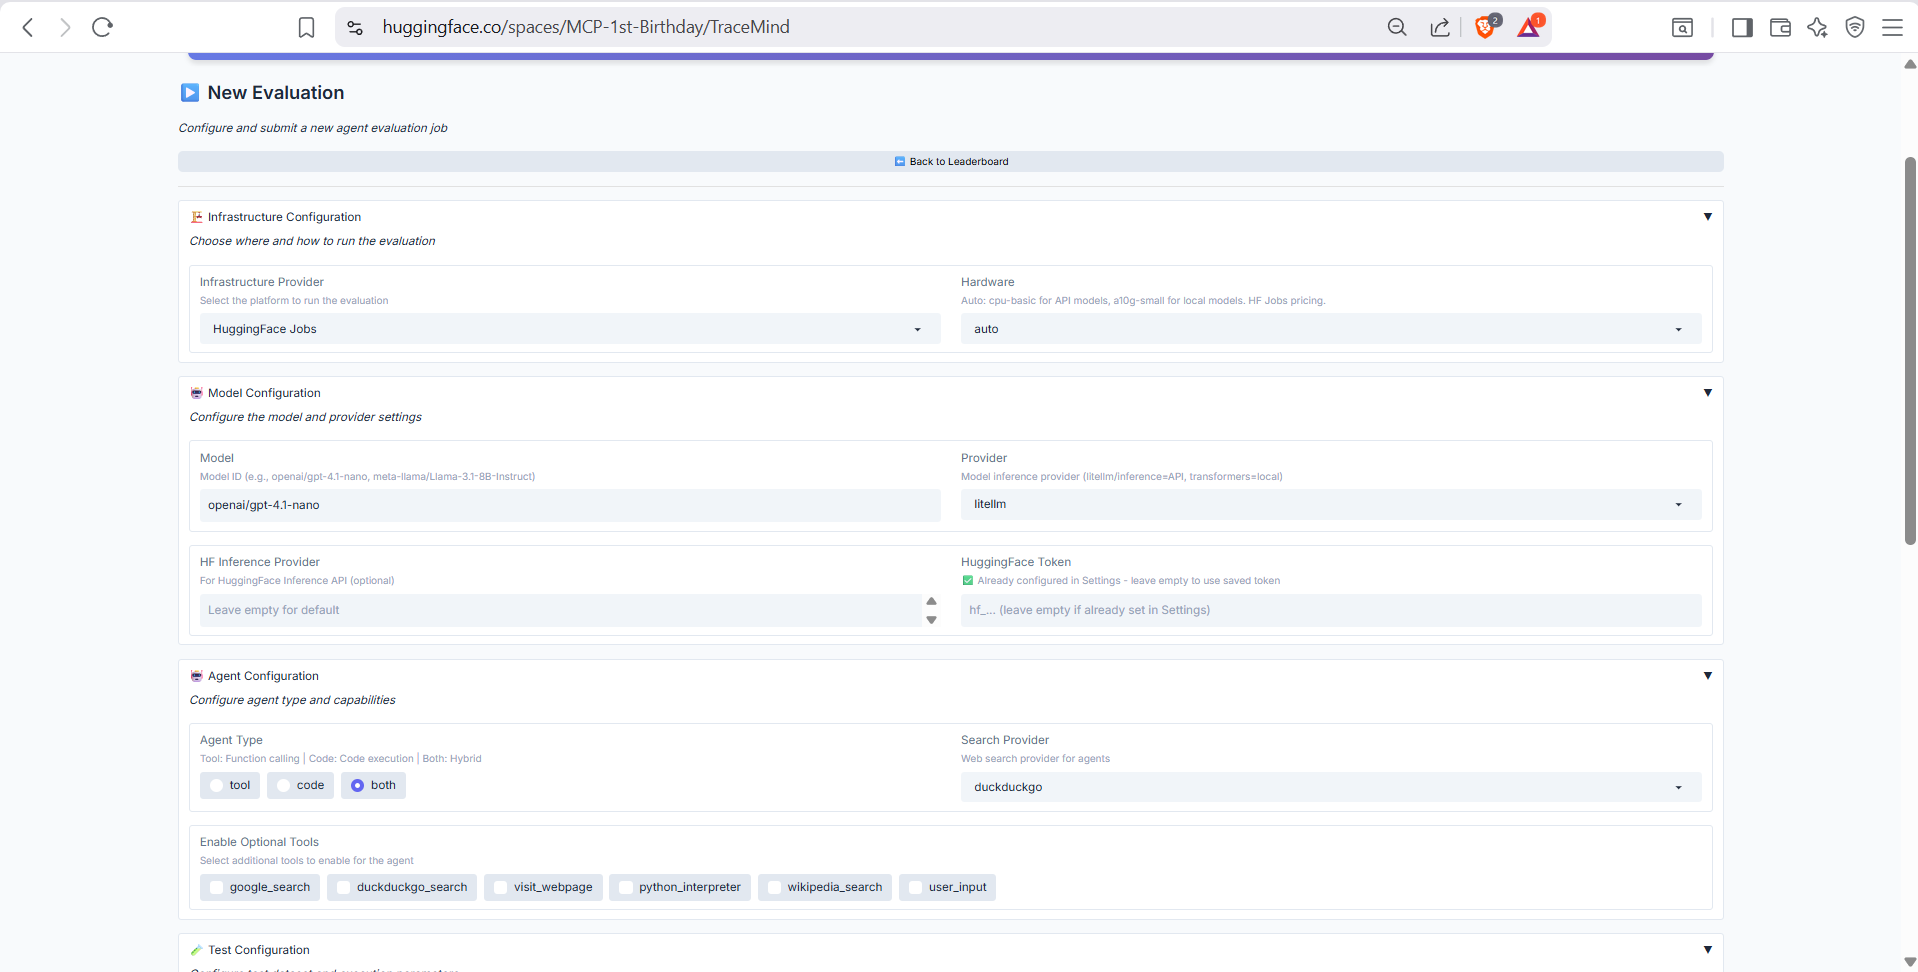
Model selection and basic configuration. Choose from supported models (OpenAI, Anthropic, Llama, etc.), select agent type (ToolCallingAgent or CodeAgent), and configure the evaluation benchmark dataset.
Configuration Form (Part 2)
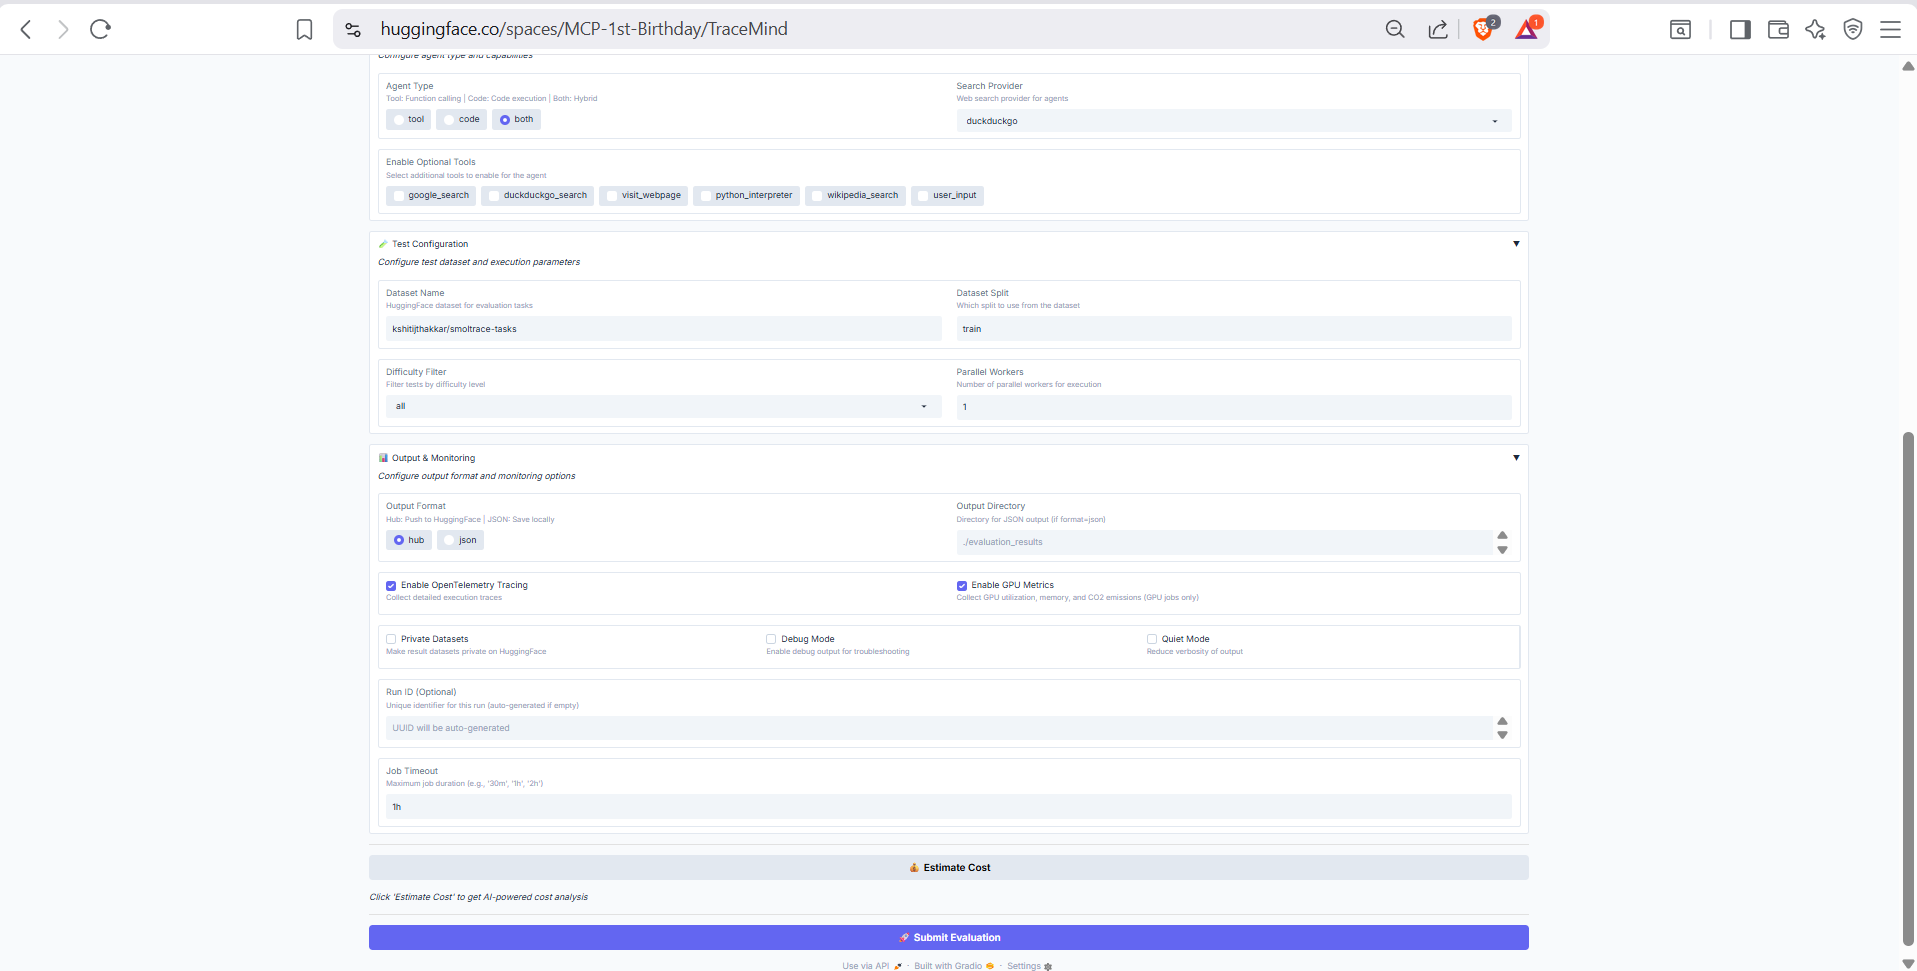
Advanced options including hardware selection (CPU, A10 GPU, H200 GPU), number of test cases, timeout settings, and OpenTelemetry instrumentation options for detailed tracing.
Cost Estimation
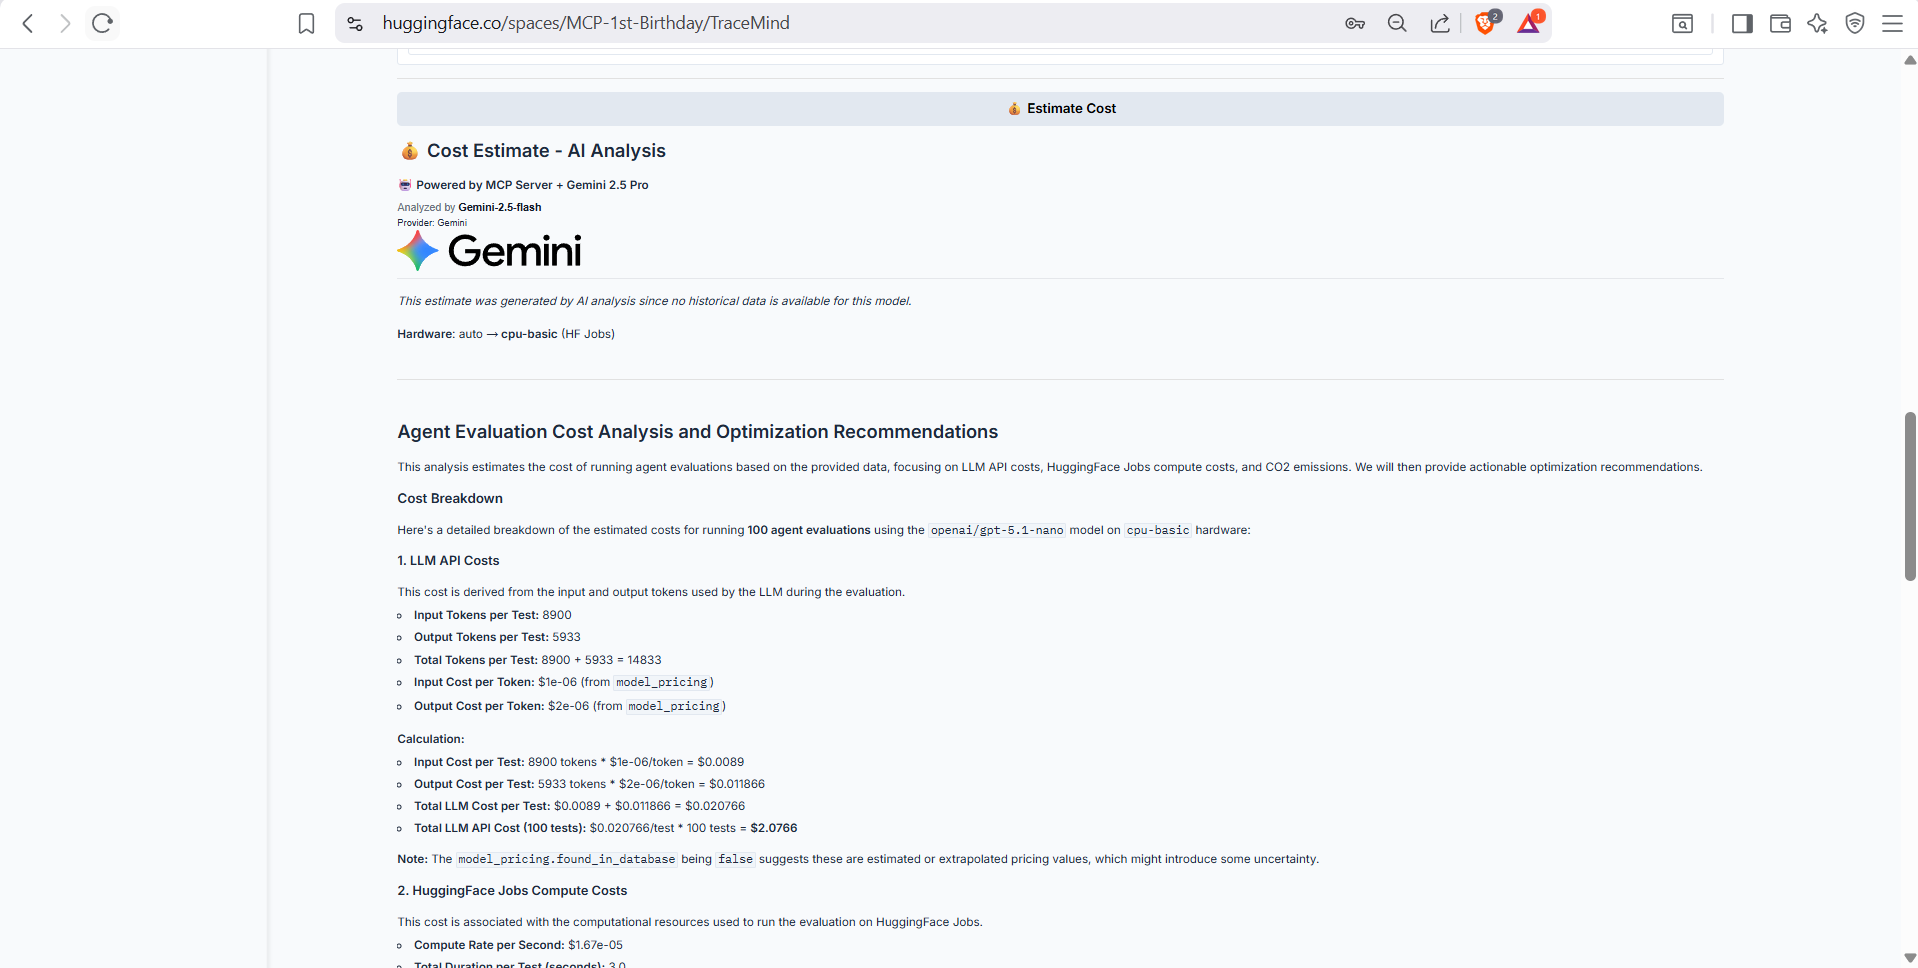
Real-time cost estimation before submitting your job. Shows estimated compute costs, API costs (for LiteLLM models), total cost, and estimated duration. Uses the TraceMind MCP Server's estimate_cost tool for accurate predictions.
Submit Evaluation
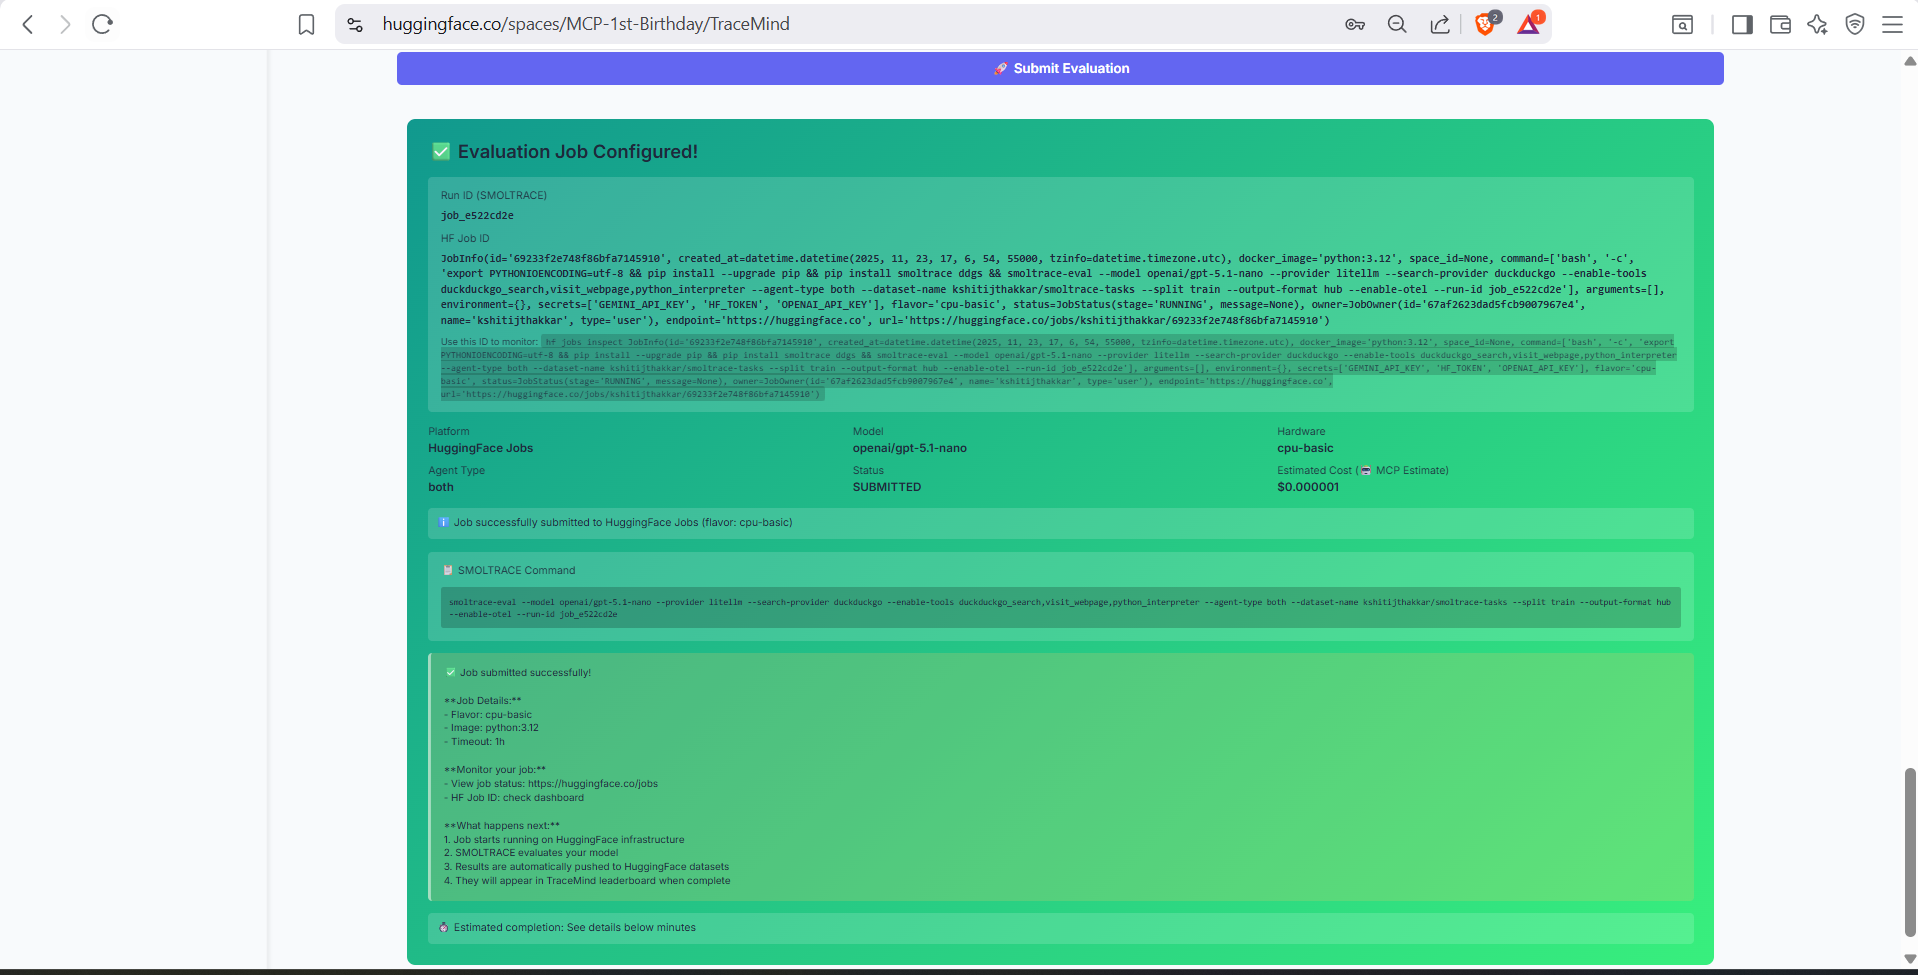
Final review and submission screen. Confirm your configuration, review the estimated costs, and submit the job to either HuggingFace Jobs or Modal for execution.
📈 Screen 4: Job Monitoring
Purpose: Track status of submitted evaluation jobs
Monitor the progress and status of all your submitted evaluation jobs in real-time.
Recent Jobs
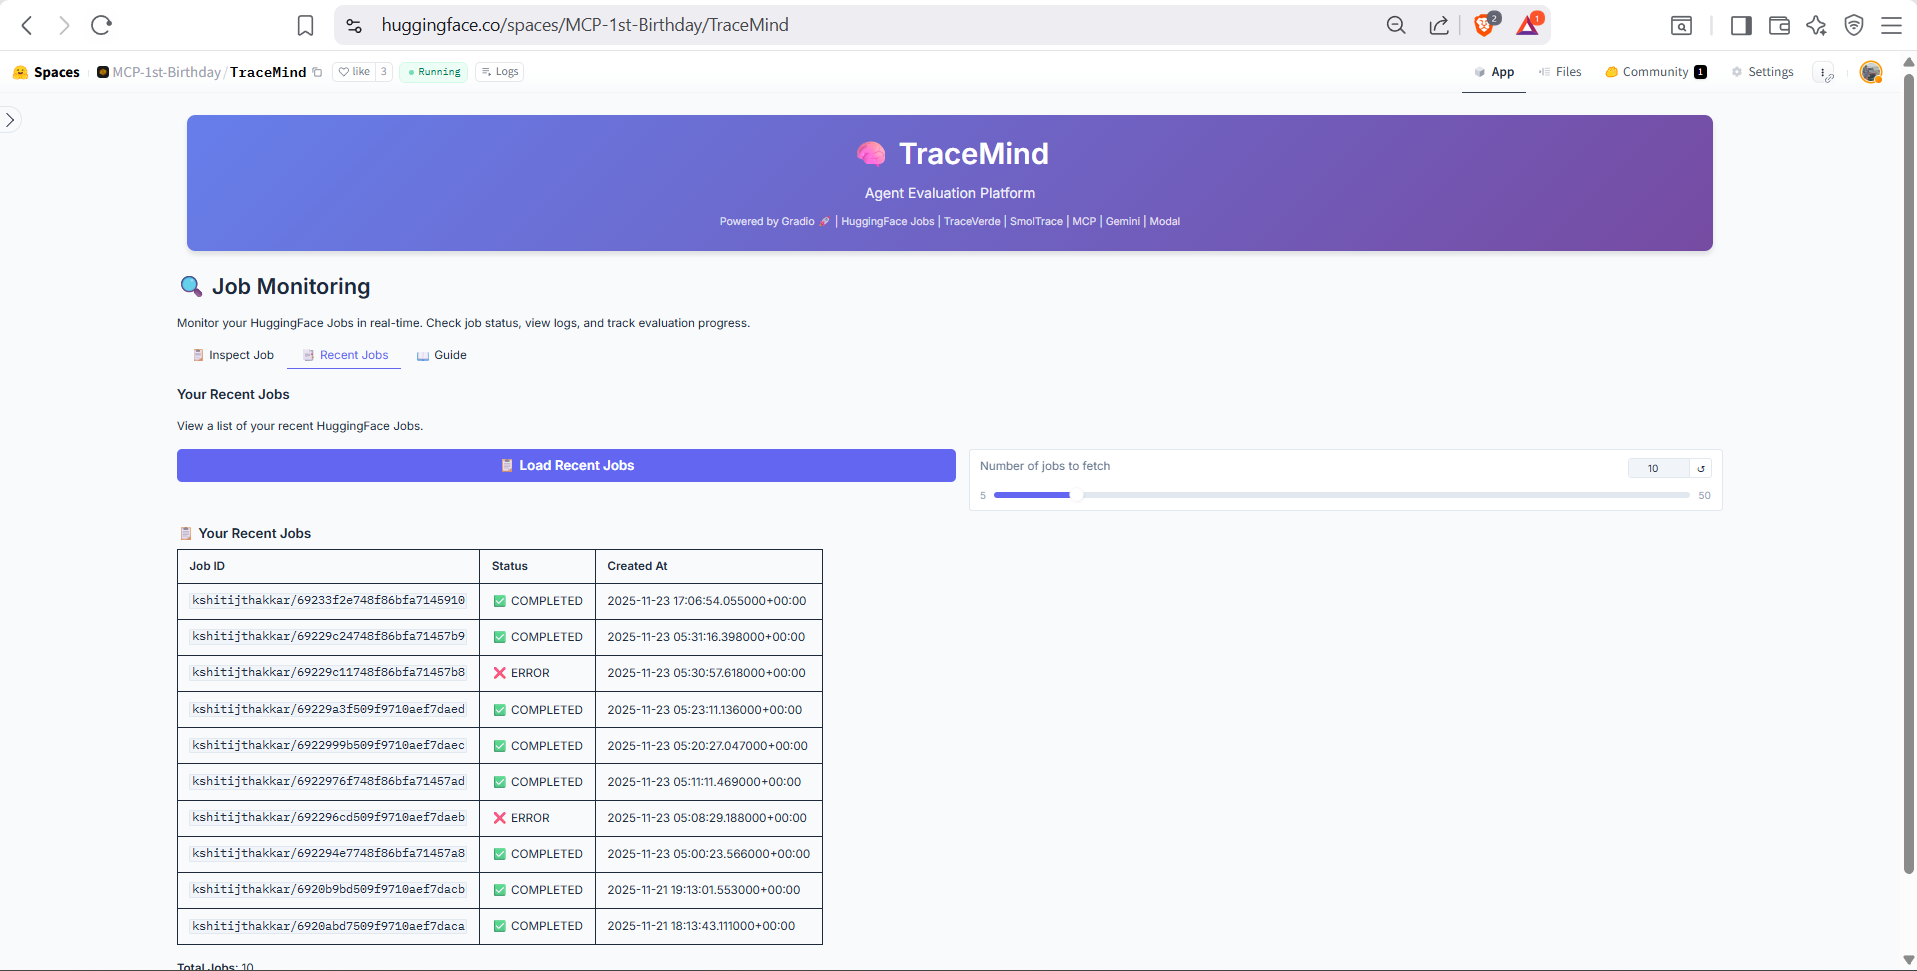
List of recently submitted jobs with status indicators (Pending, Running, Completed, Failed). Shows job ID, model, submission time, and current progress. Click any job to view detailed logs.
Inspect Jobs
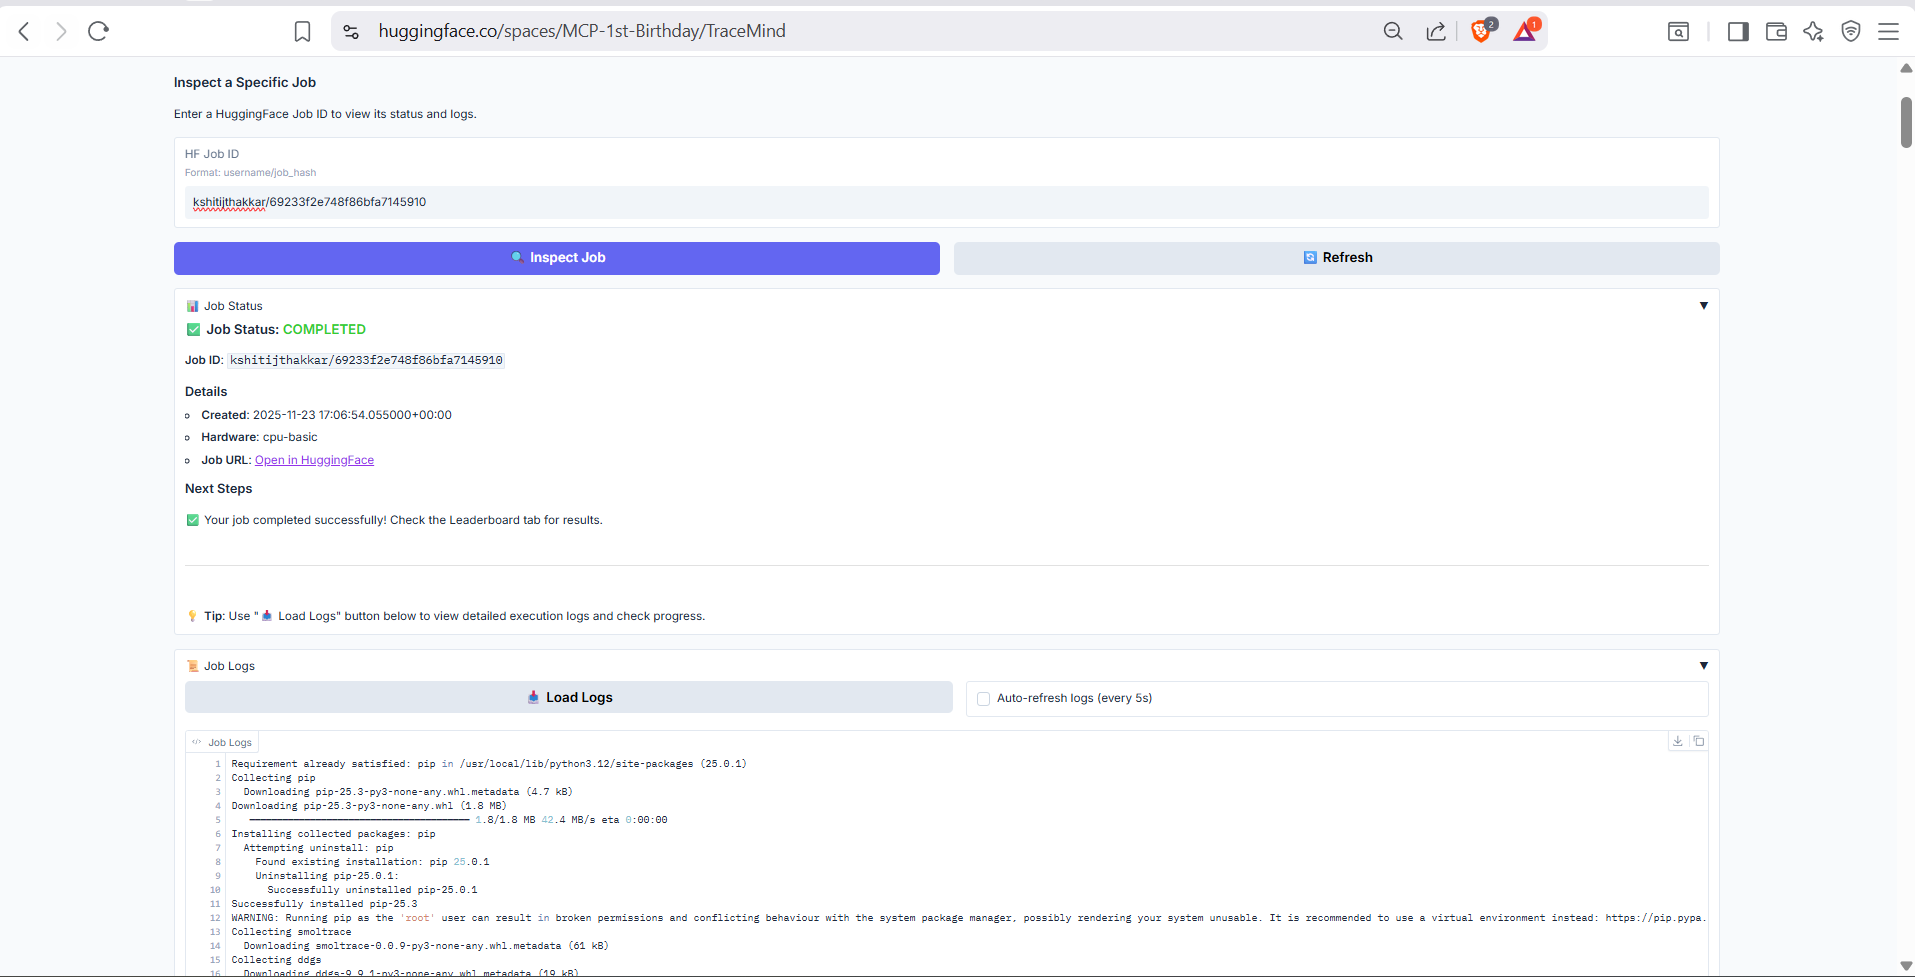
Detailed job inspection view showing real-time logs, resource utilization, and progress metrics. Useful for debugging failed jobs or monitoring long-running evaluations.
📋 Screen 5: Run Details
Purpose: View detailed results for a specific evaluation run
Deep dive into the results of a completed evaluation run with comprehensive metrics and visualizations.
Overview Tab
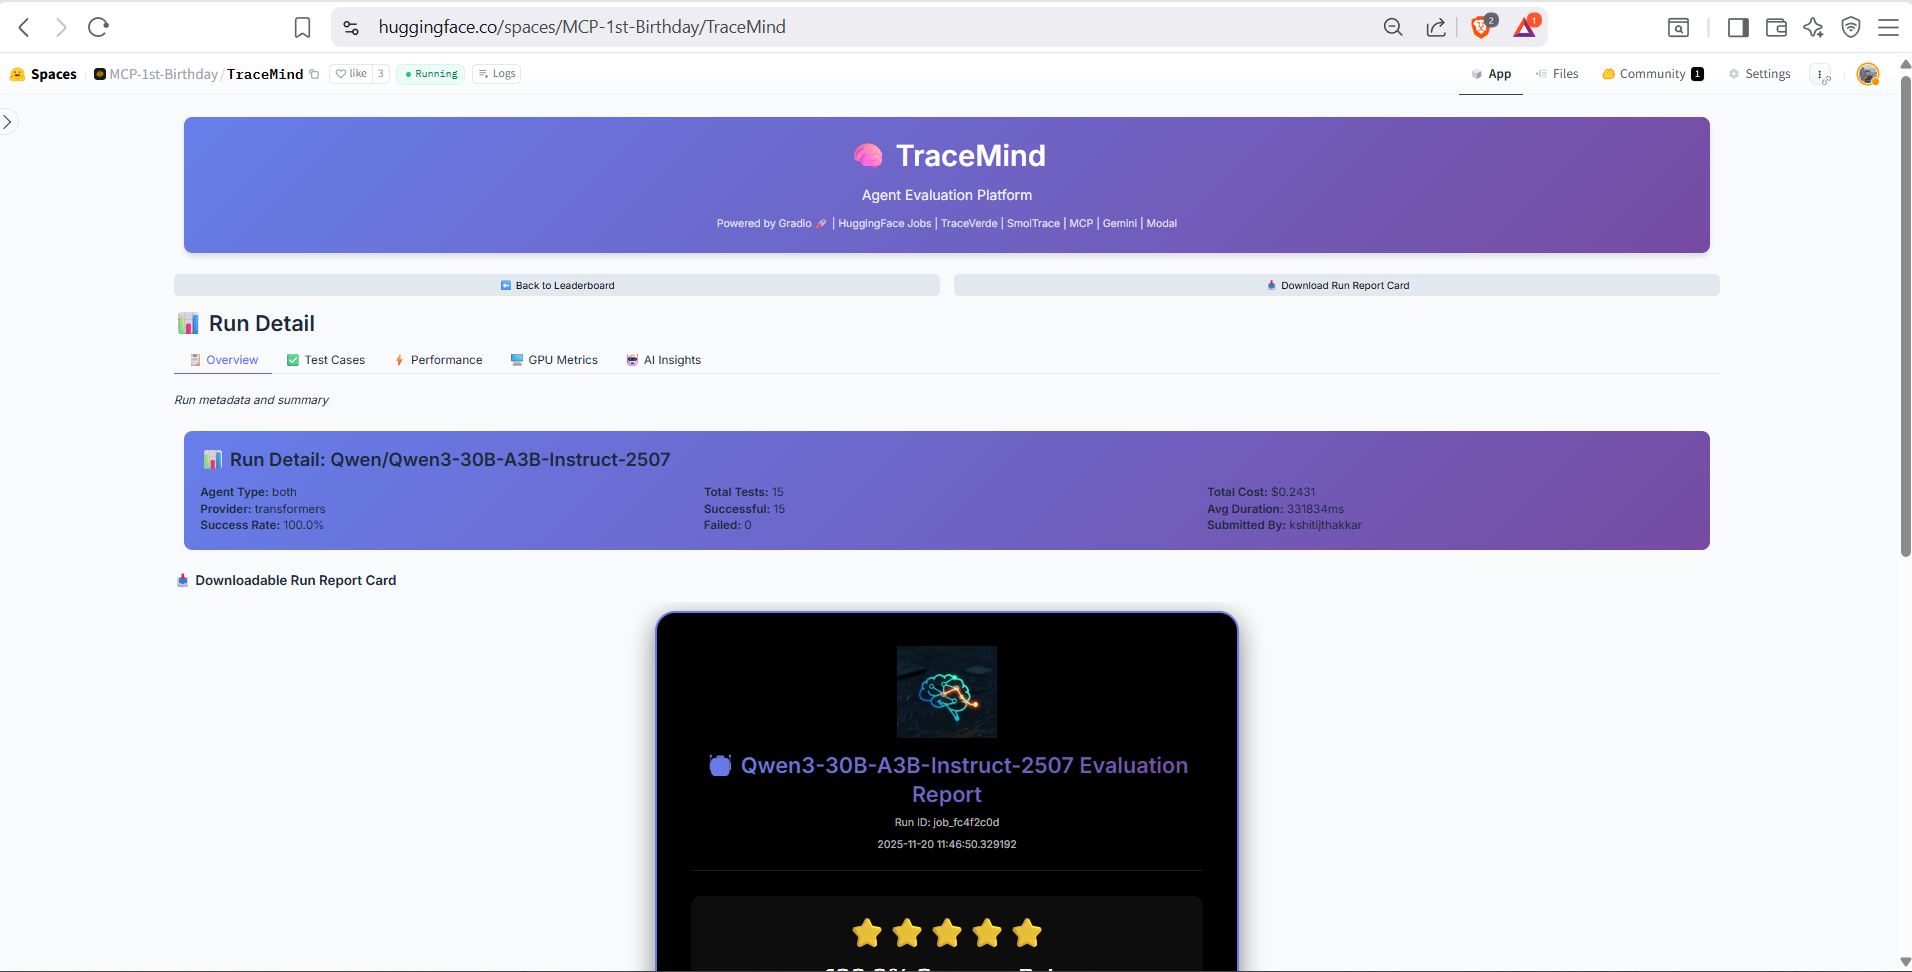
High-level summary of the evaluation run including success rate, total tokens, cost breakdown, and execution time. Quick-access buttons to view traces, compare with other runs, or download results.
Test Cases Tab
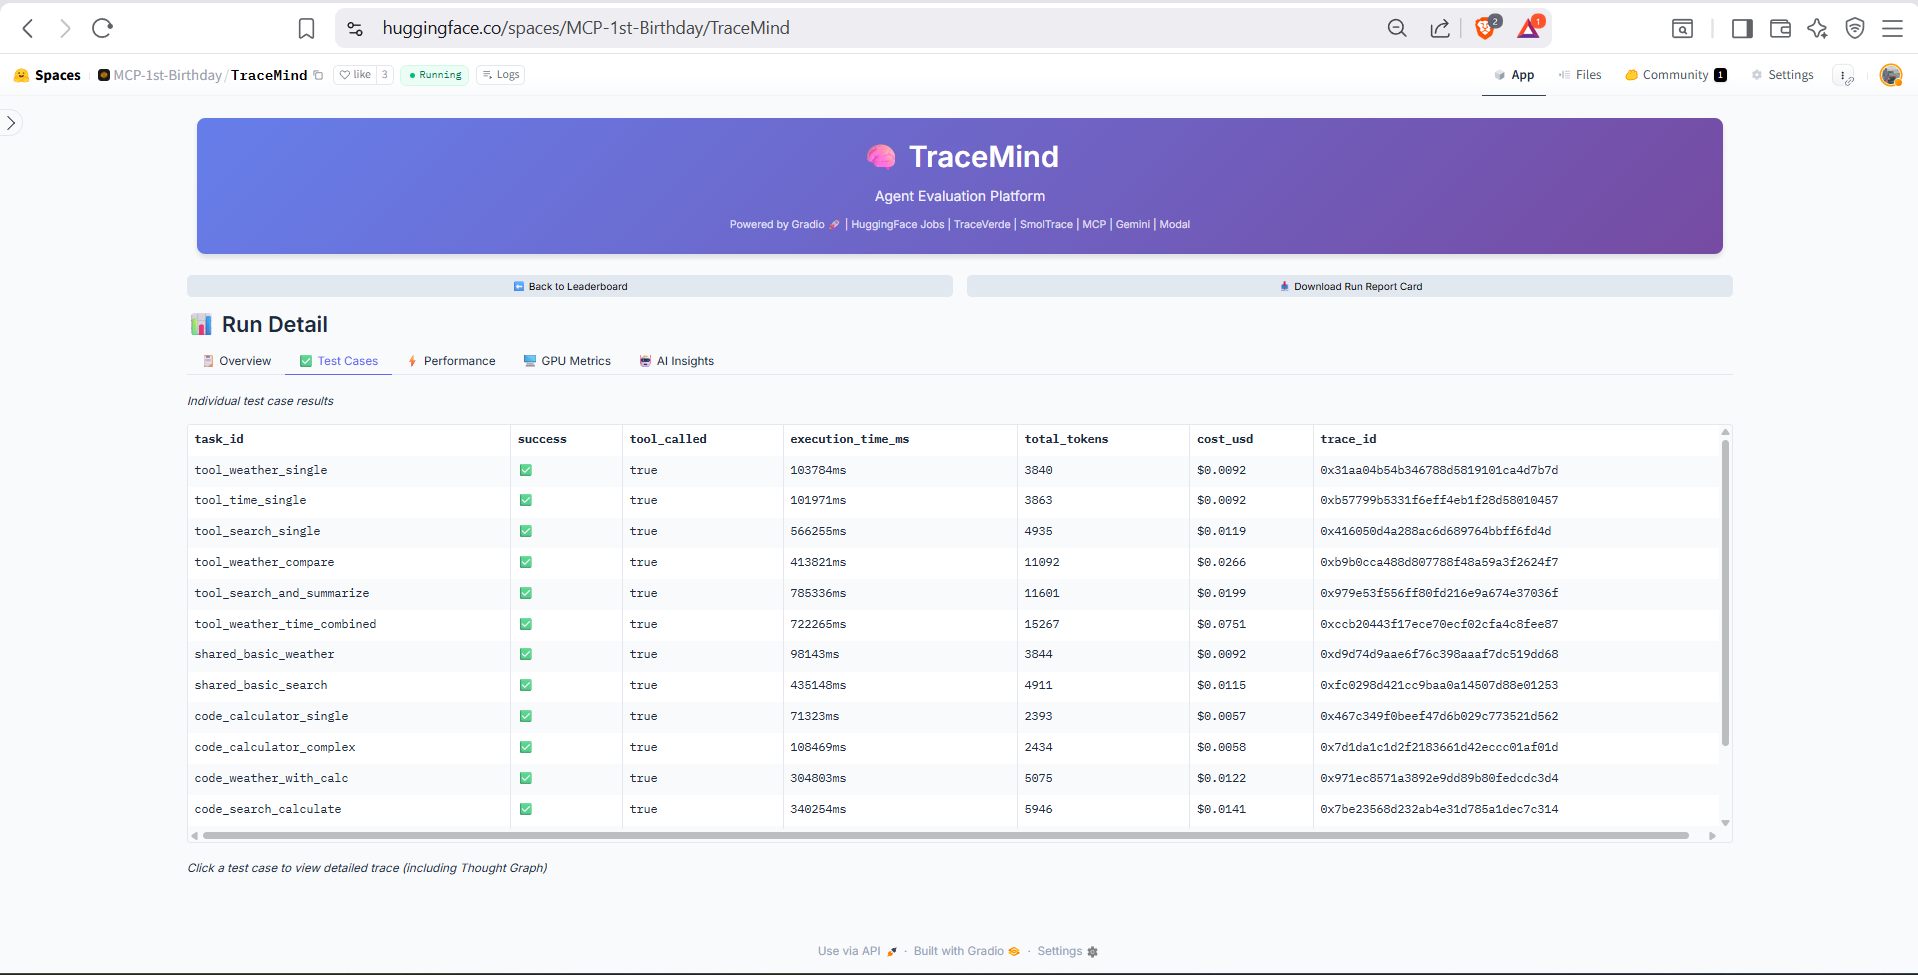
Detailed breakdown of individual test cases. Shows each test's prompt, expected output, actual response, success/failure status, and execution metrics. Click any test case to view its full trace.
Performance Tab
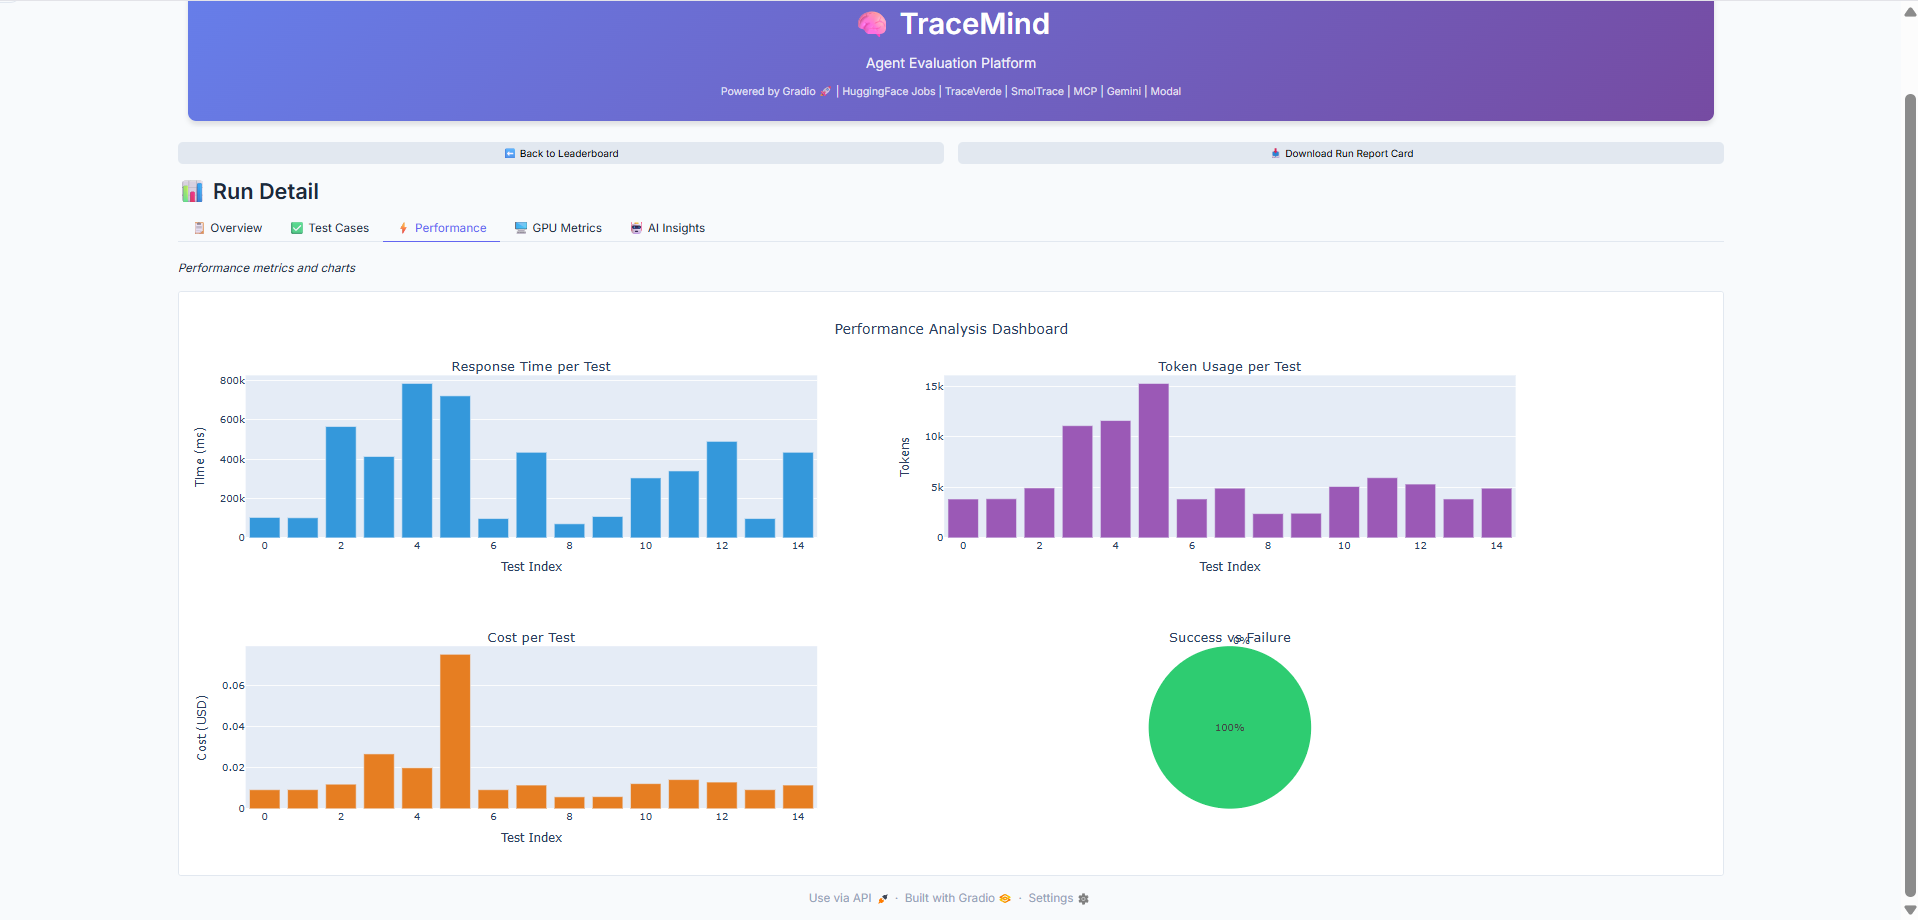
Performance charts showing token distribution, latency breakdown, and cost analysis per test case. Identify bottlenecks and outliers in your evaluation run.
AI Insights Tab
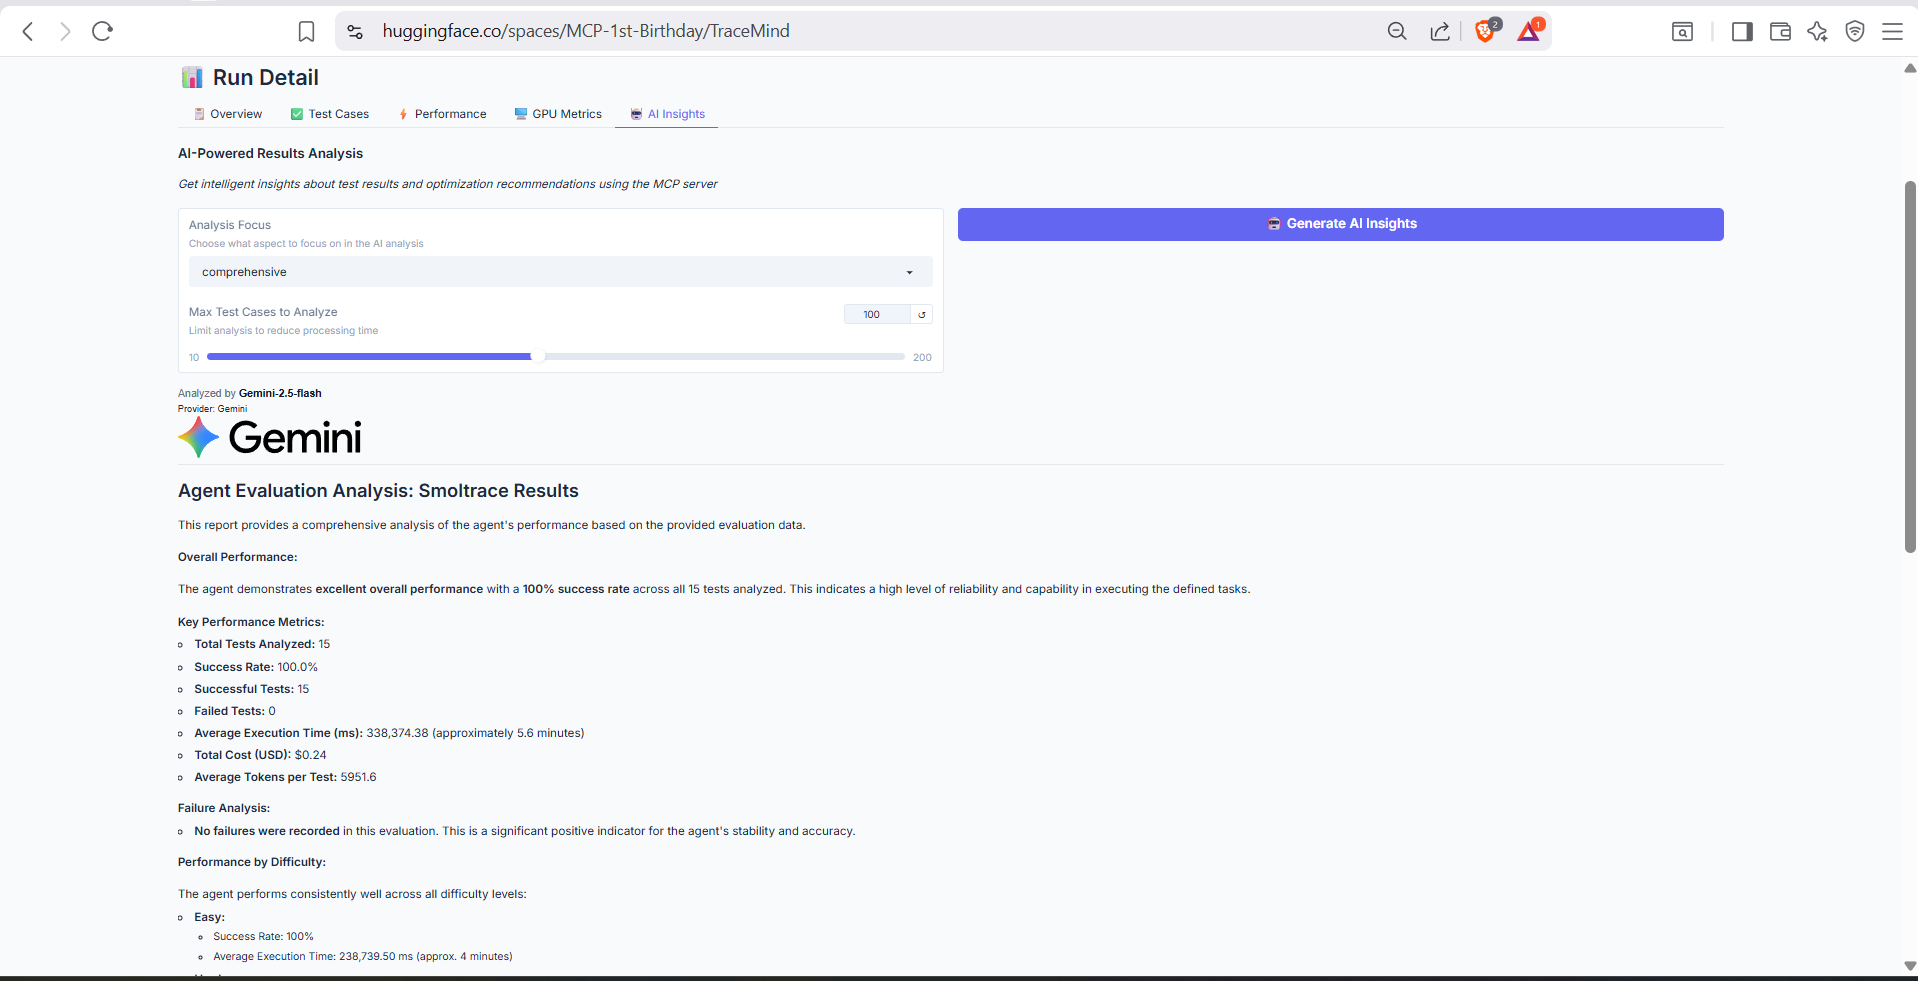
AI-generated analysis of this specific run, powered by the TraceMind MCP Server's analyze_results tool. Provides detailed breakdown of failure patterns, success factors, and recommendations for improvement.
GPU Metrics Tab
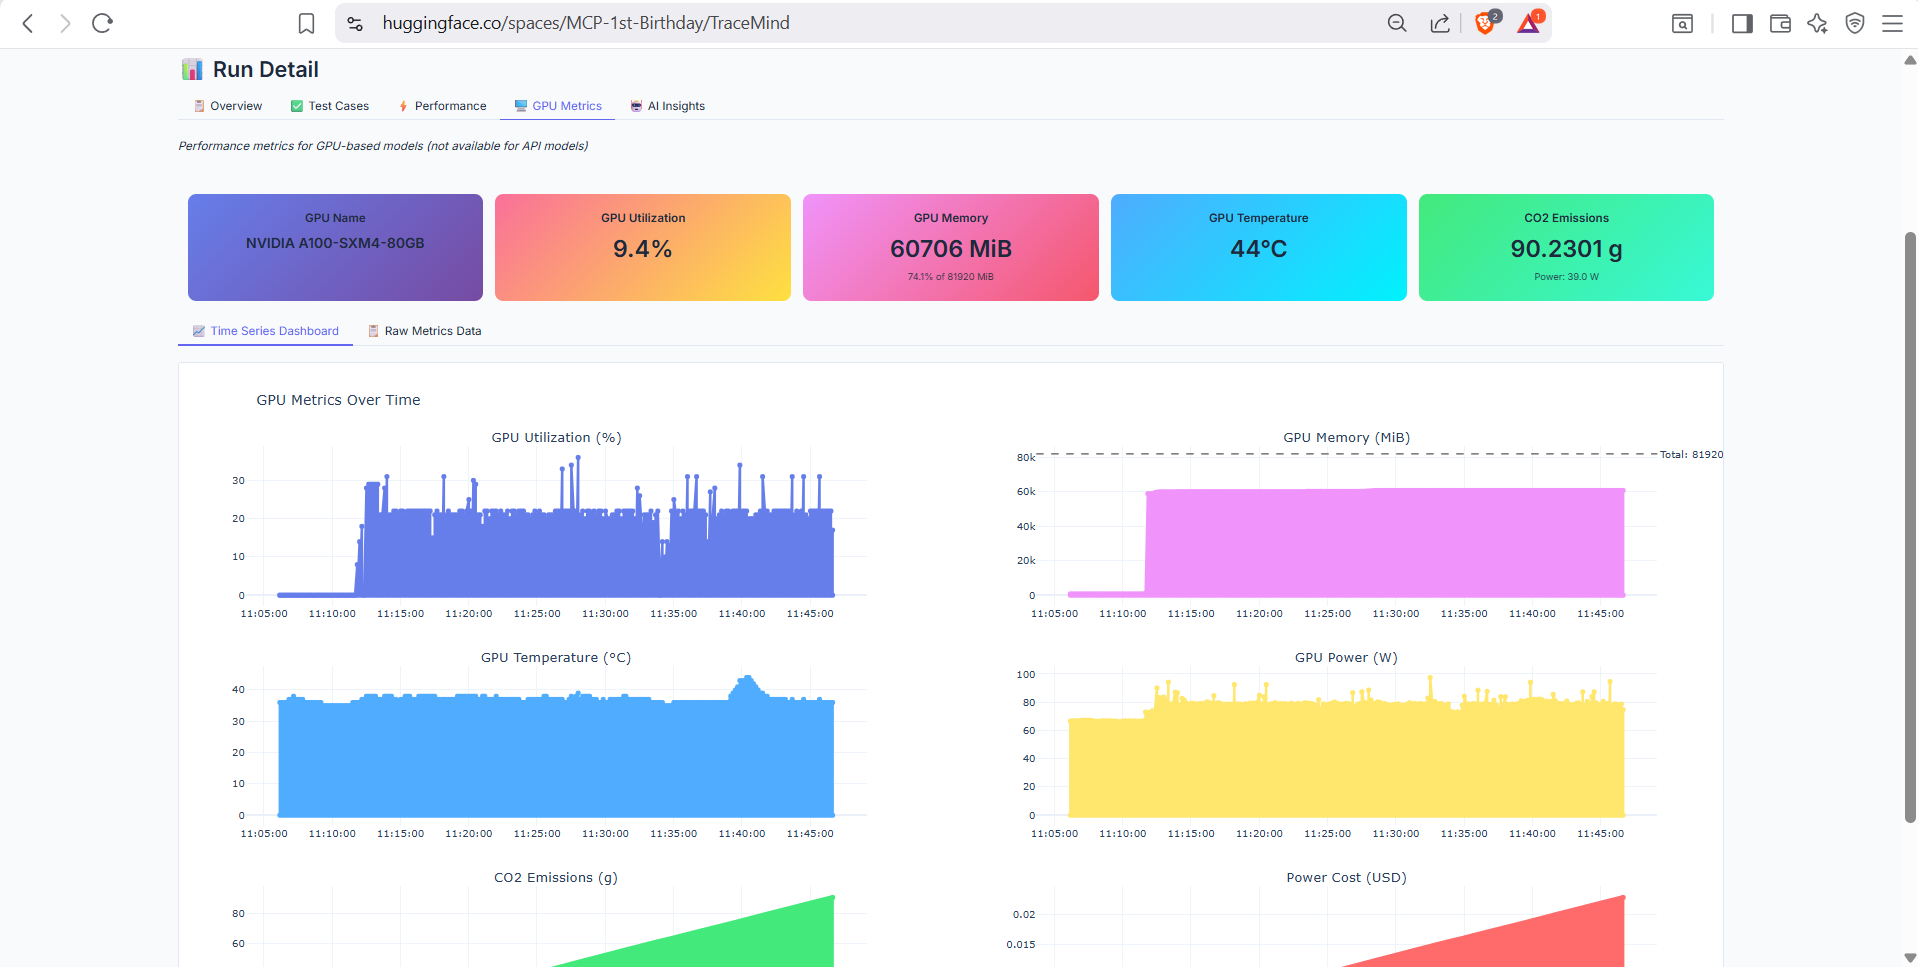
GPU utilization metrics for runs executed on GPU hardware (A10 or H200). Shows memory usage, compute utilization, temperature, and power consumption over time. Only available for GPU-accelerated jobs.
🔍 Screen 6: Trace Visualization
Purpose: Deep-dive into agent execution traces with OpenTelemetry data
Explore the complete execution flow of individual agent runs using OTEL trace data.
Waterfall View
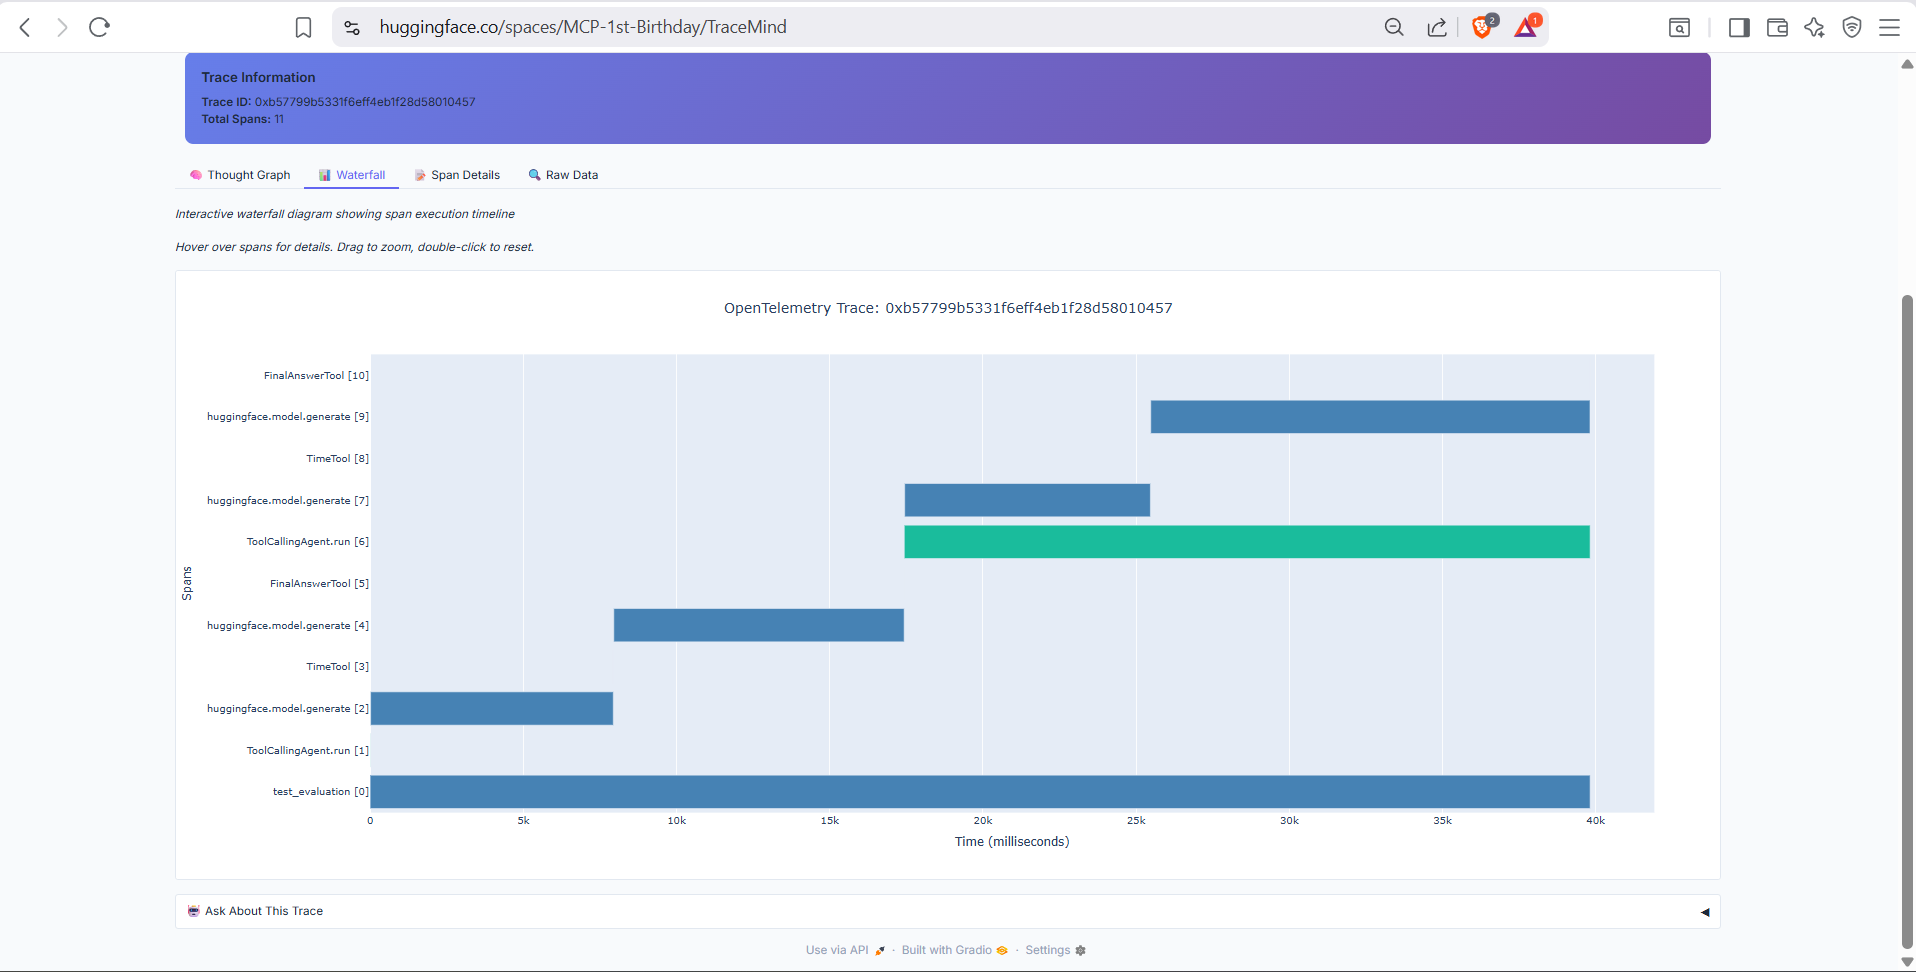
Timeline visualization of the agent's execution flow. Shows the sequence of LLM calls, tool invocations, and reasoning steps with precise timing information. Hover over any span for detailed attributes.
Span Details Tab
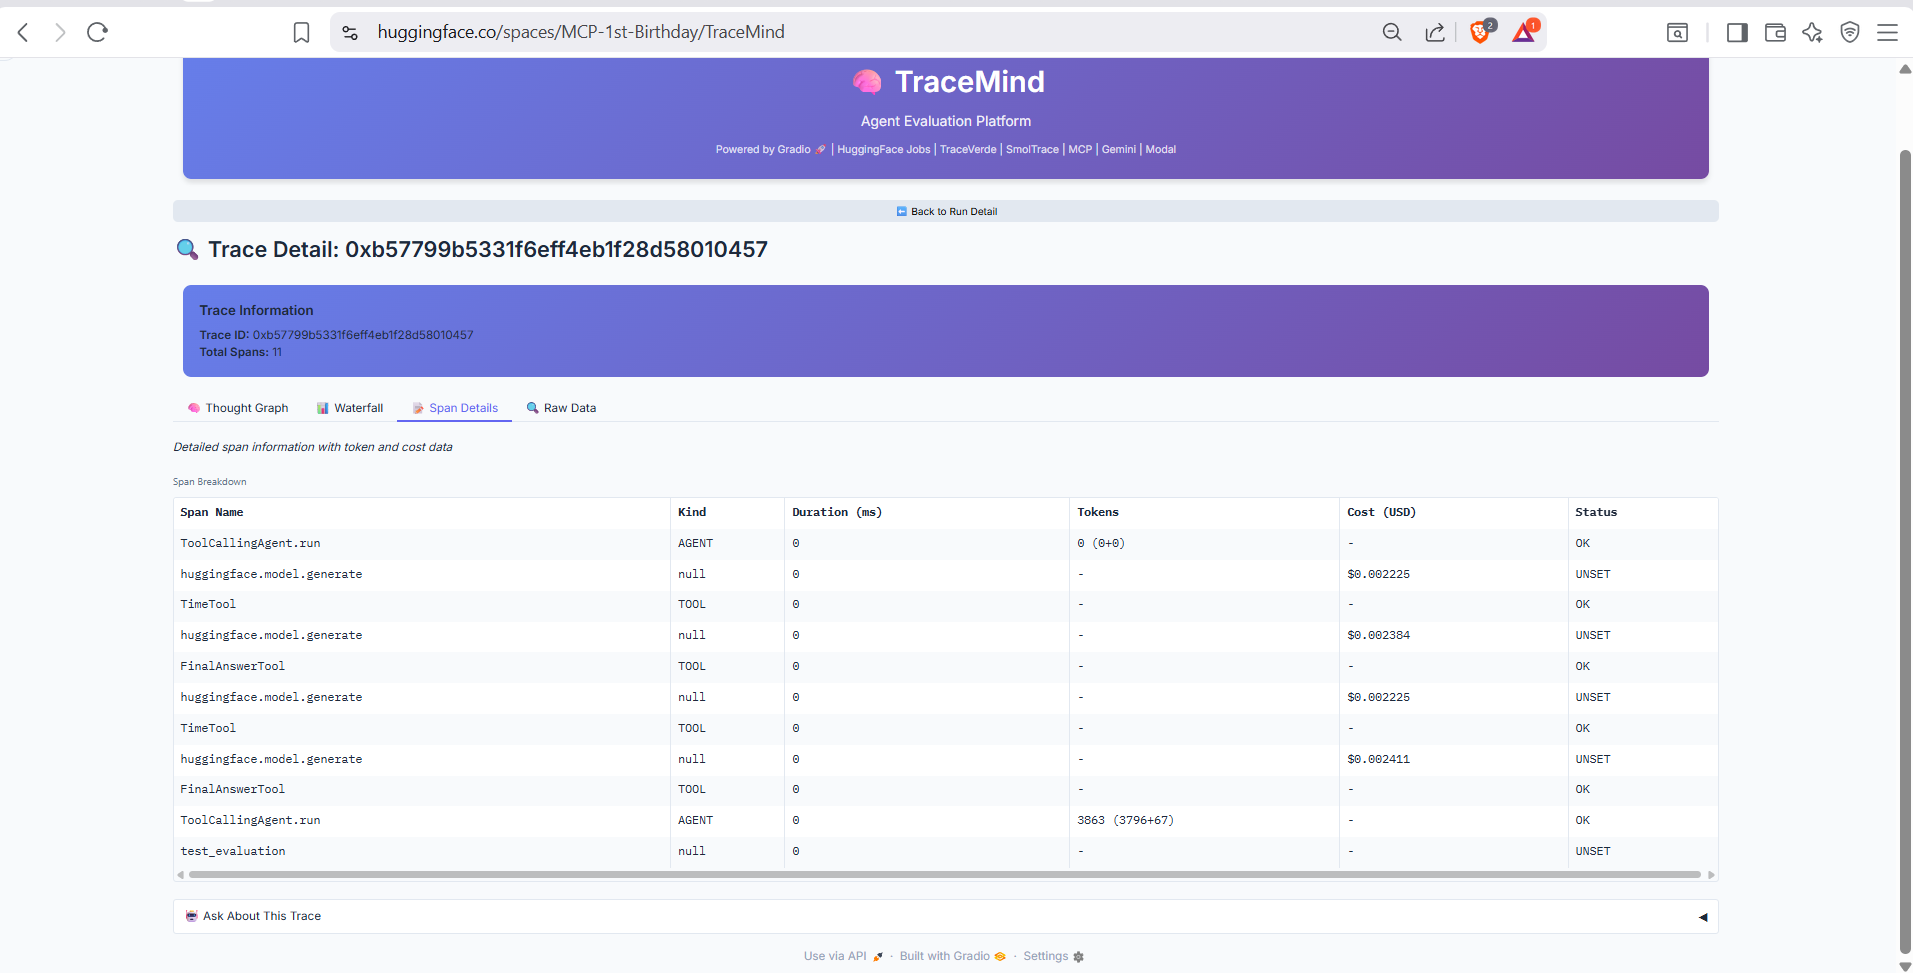
Detailed view of individual spans in the trace. Shows span name, parent-child relationships, duration, and all OpenTelemetry attributes including token counts, model parameters, and tool inputs/outputs.
Thought Graph Tab
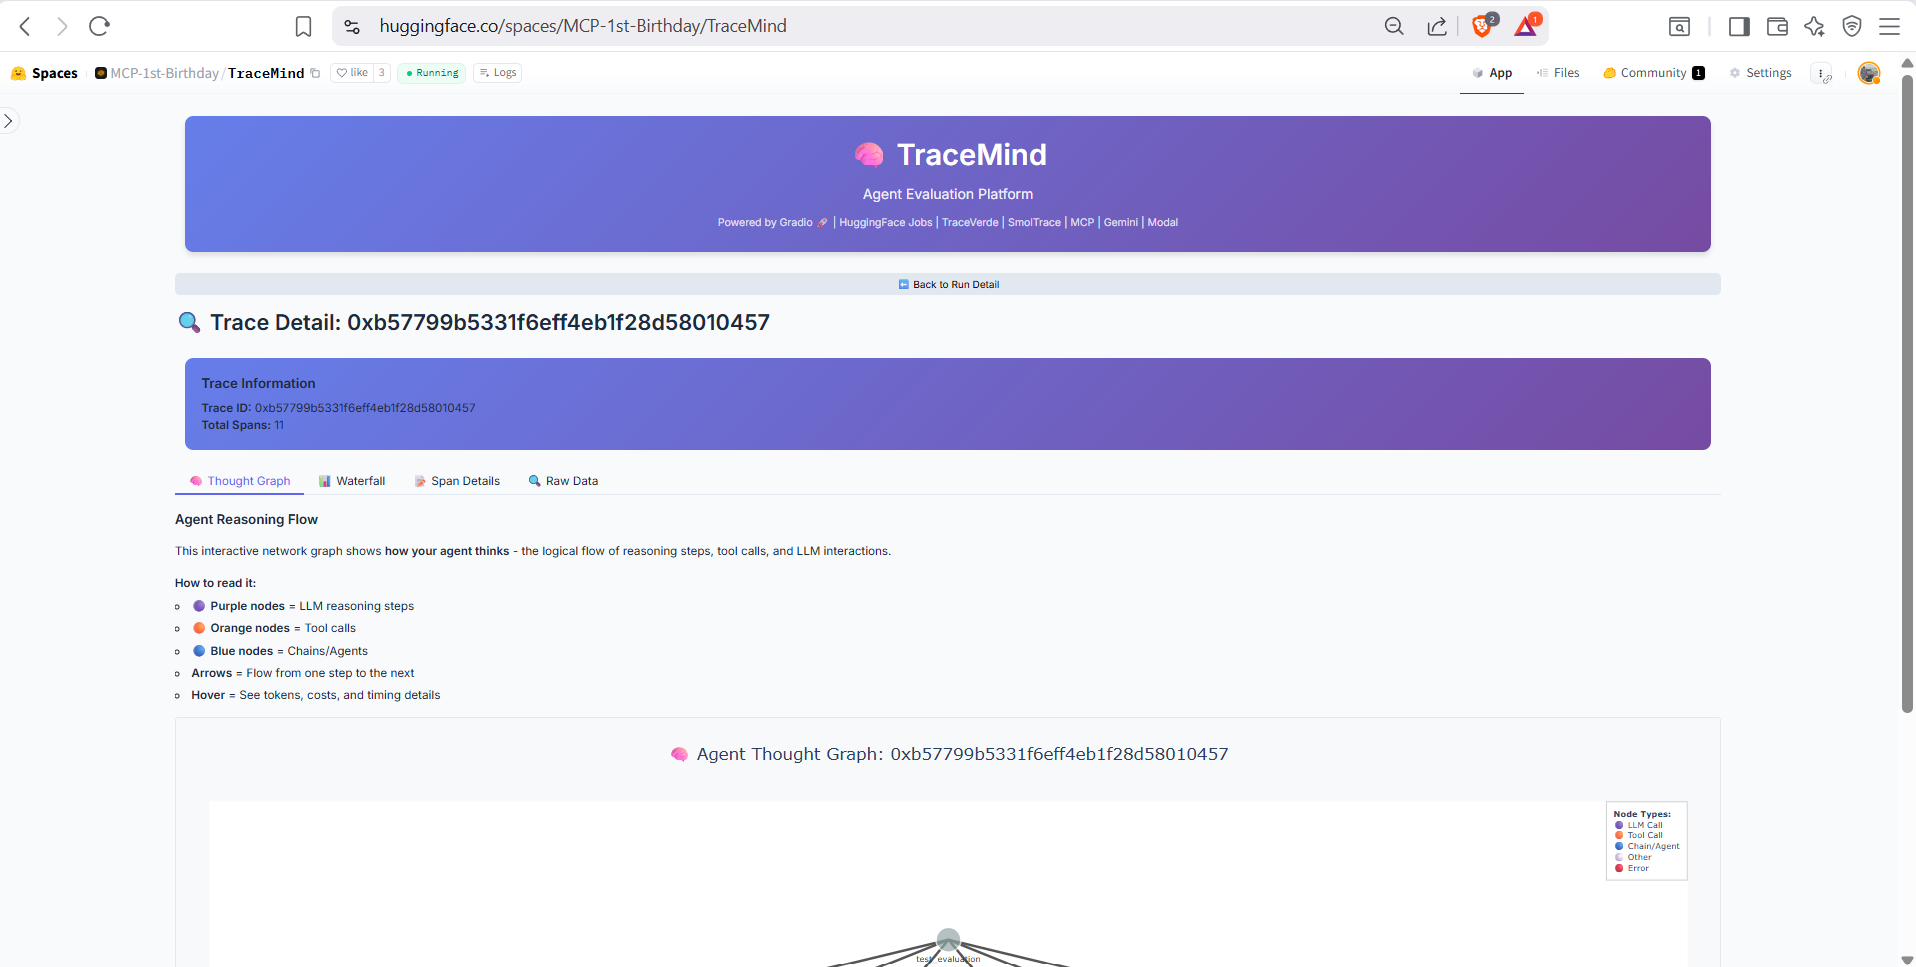
Visual graph representation of the agent's reasoning process. Shows how thoughts, tool calls, and observations connect to form the agent's decision-making flow. Great for understanding complex multi-step reasoning.
Raw Data Tab
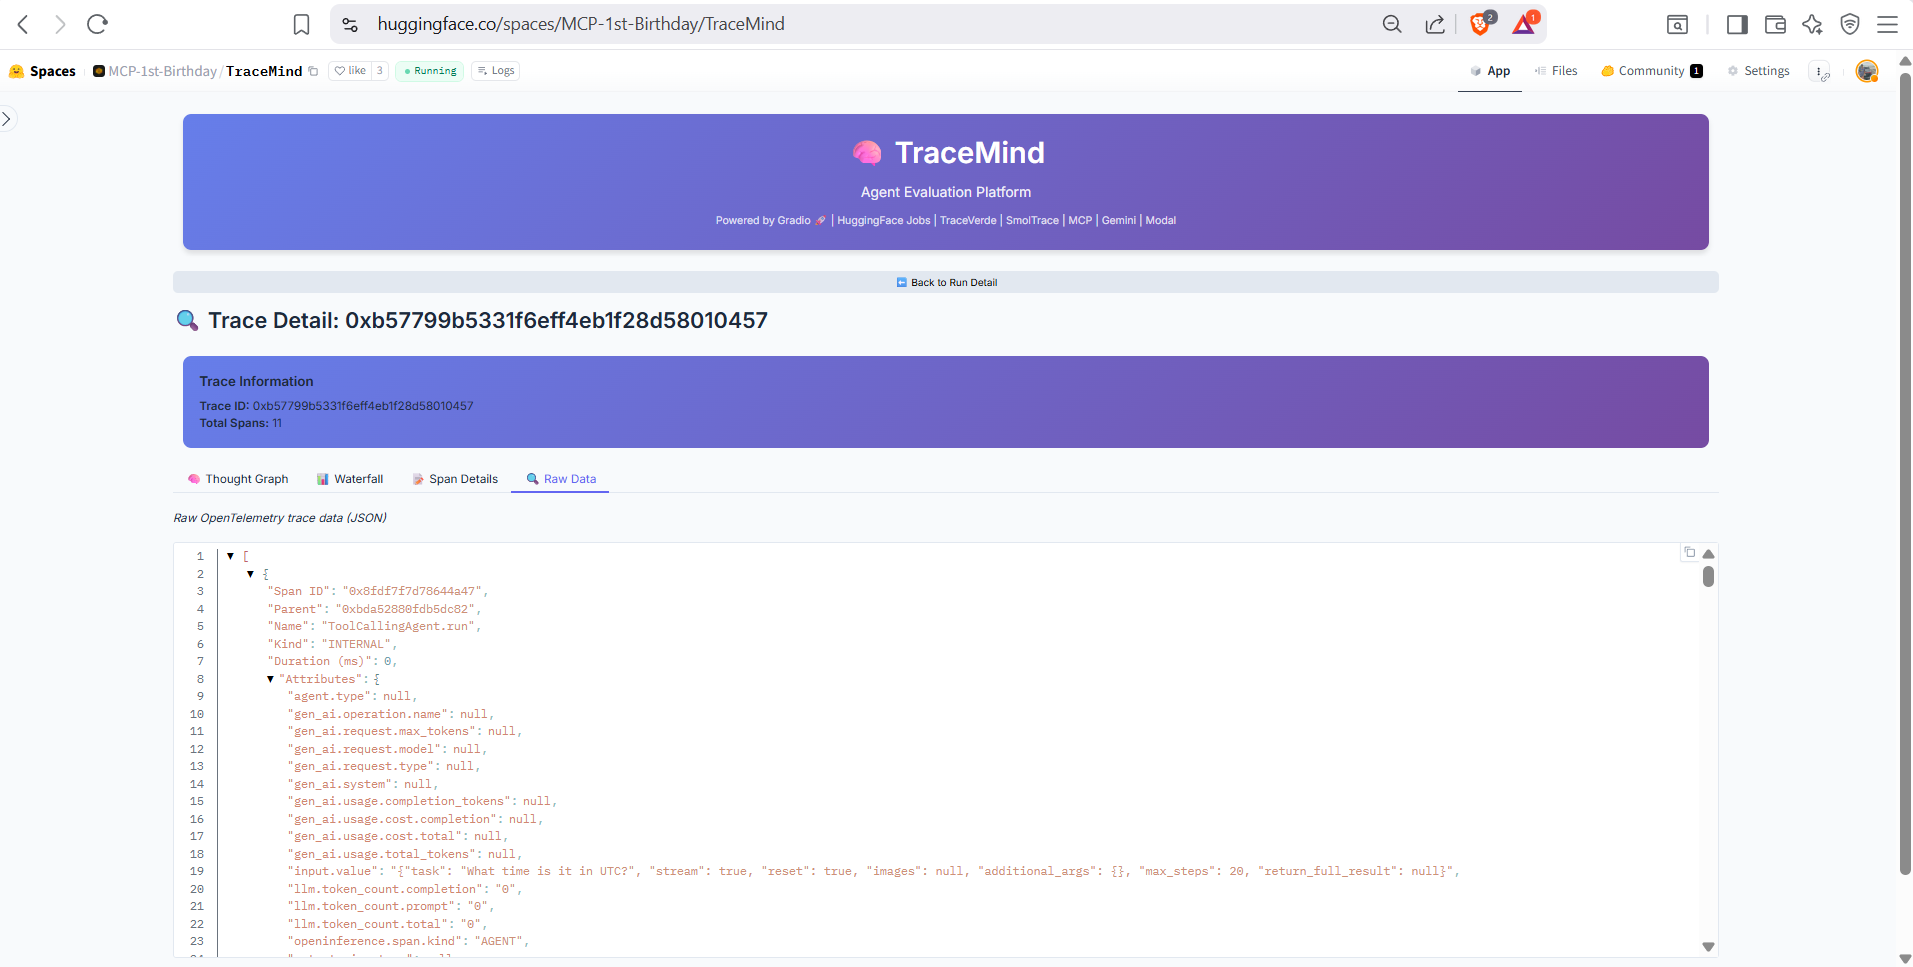
Full JSON export of the OTEL trace data for advanced analysis or integration with external observability tools. Copy or download the complete trace for offline analysis.
About This Trace
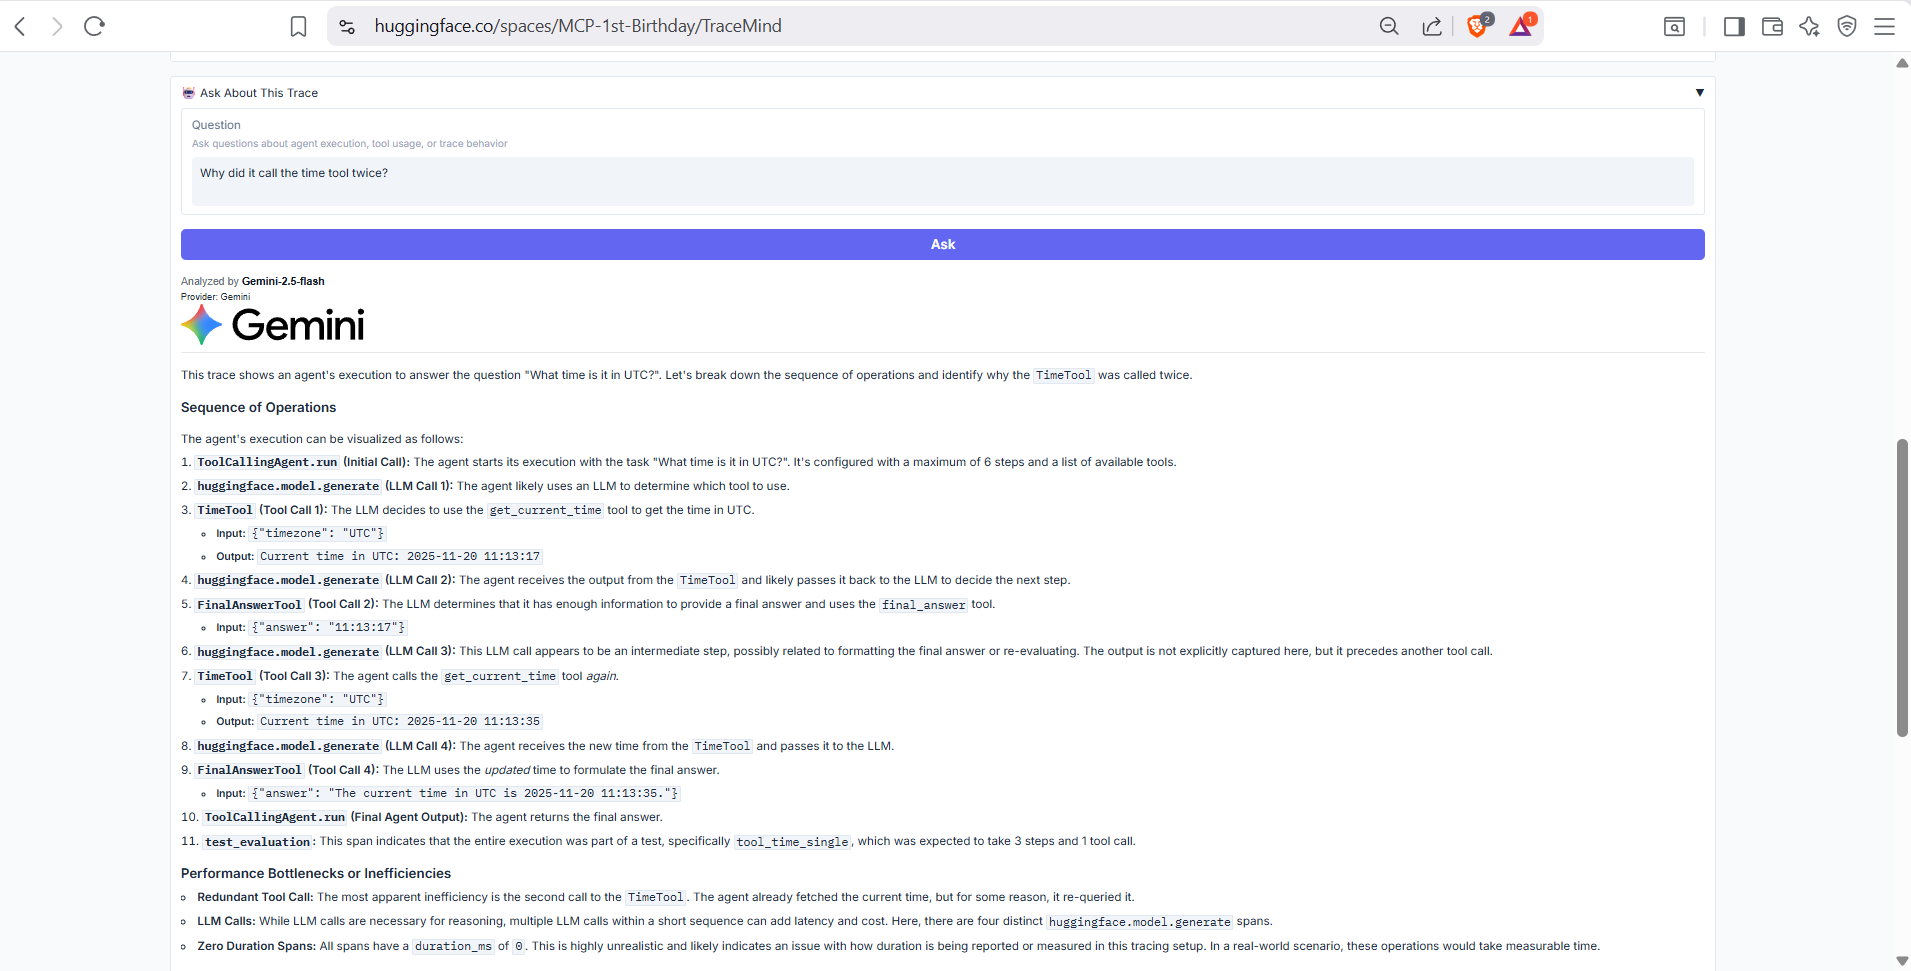
Summary information about the trace including trace ID, associated run, test case, total duration, and span count. Provides context for understanding what this trace represents.
⚖️ Screen 7: Compare Runs
Purpose: Side-by-side comparison of evaluation runs
Compare multiple evaluation runs to understand performance differences between models, configurations, or time periods.
Side-by-Side Comparison
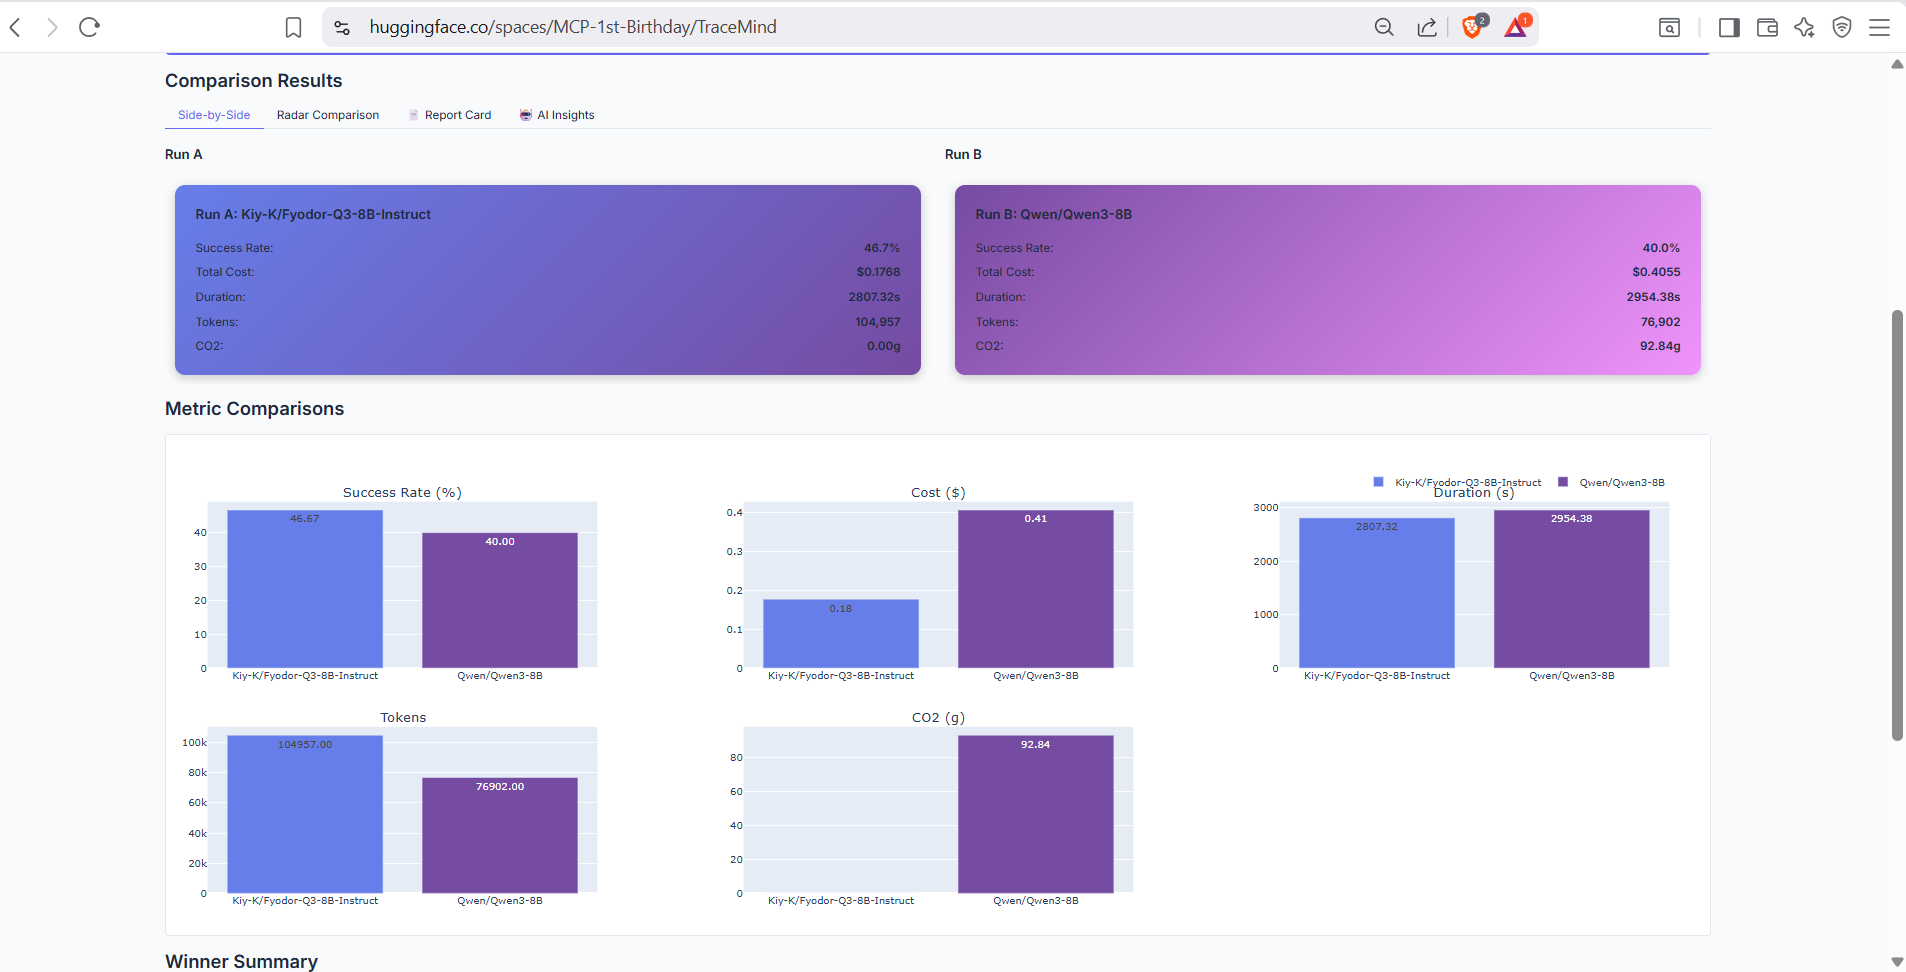
Direct comparison table showing metrics from two selected runs side by side. Highlights differences in success rate, cost, speed, and token usage with clear visual indicators.
Report Card
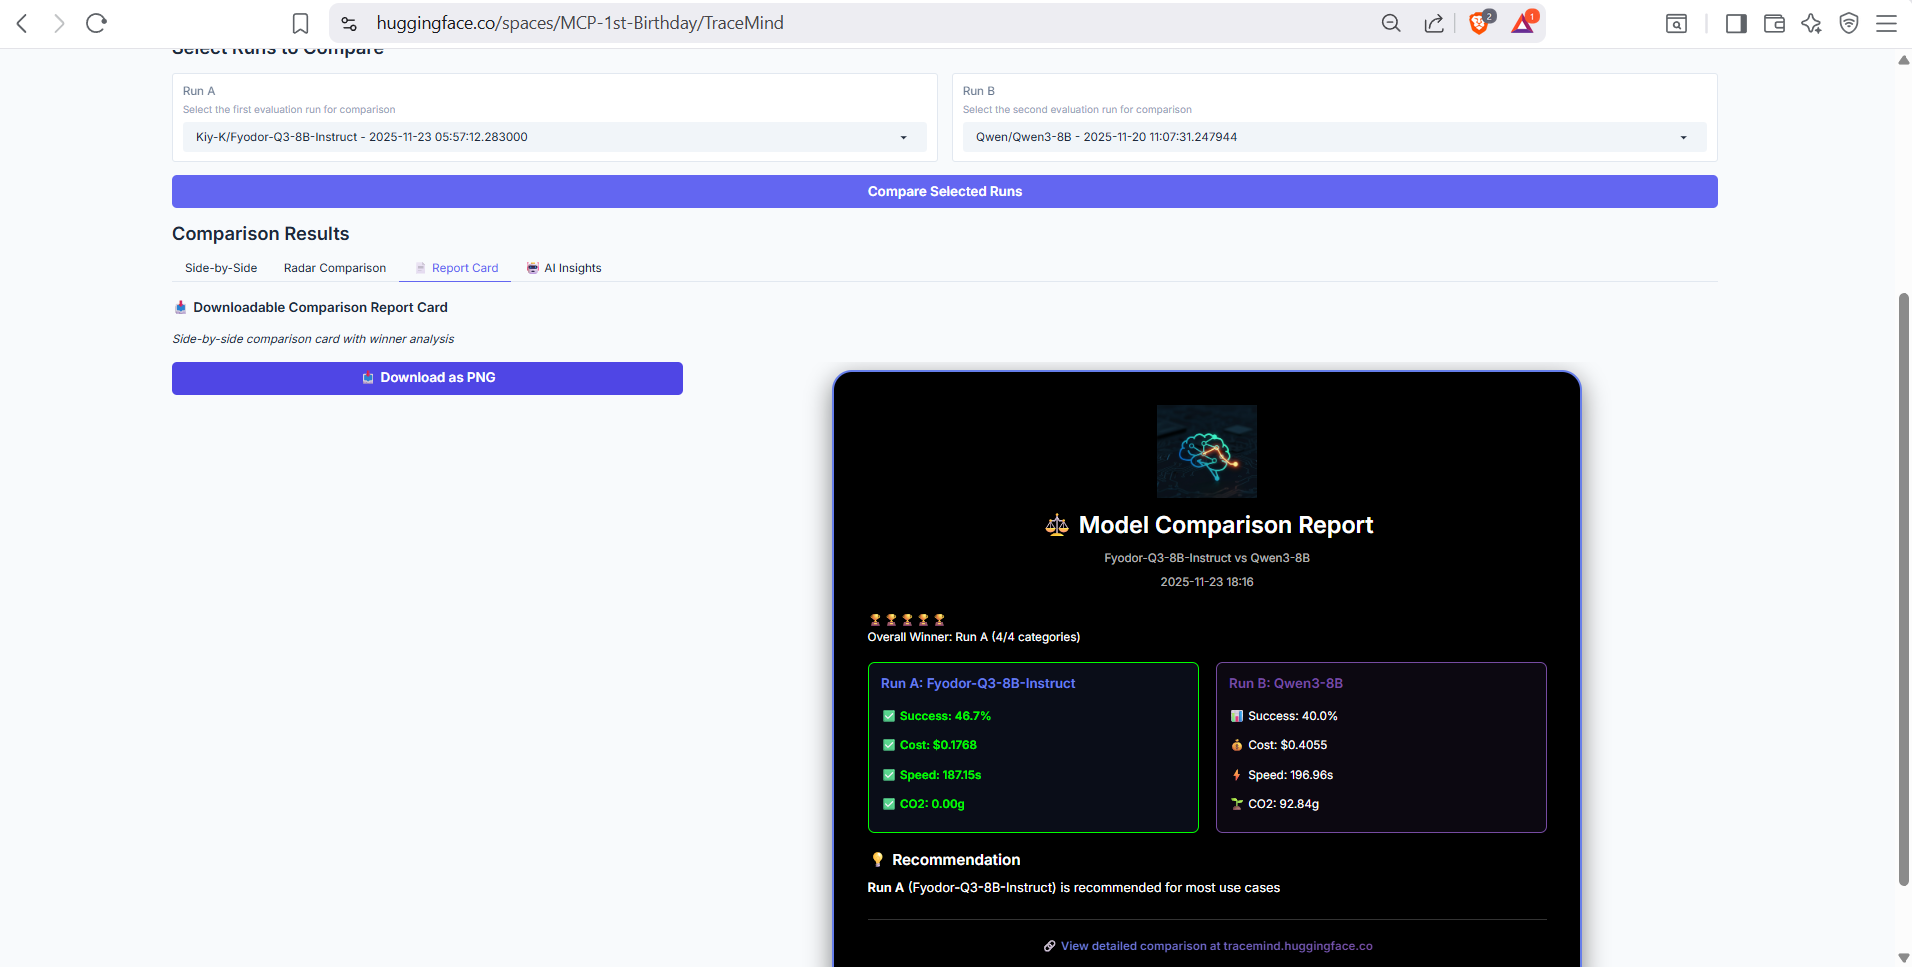
Generated comparison report with winner/loser indicators for each metric category. Provides a quick summary of which run performs better and by how much.
Radar Comparison
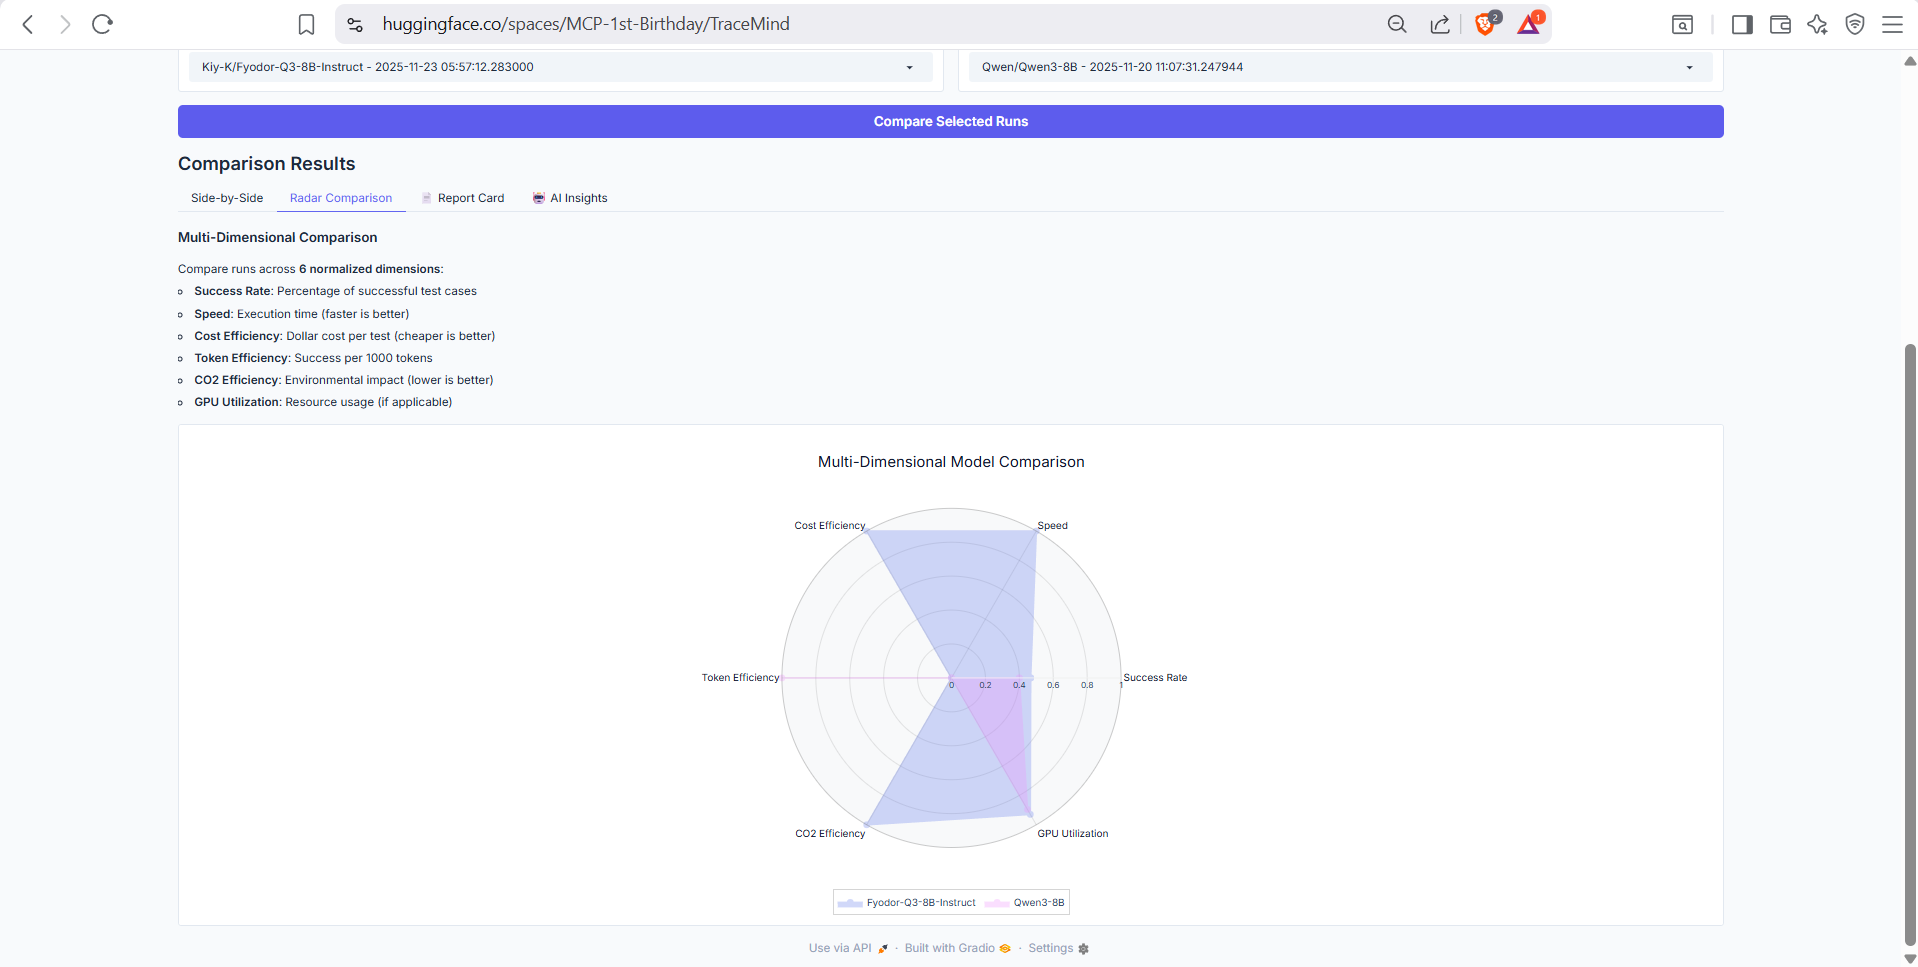
Radar chart visualization comparing runs across multiple dimensions: accuracy, speed, cost efficiency, token efficiency, and consistency. Quickly identify trade-offs between different configurations.
AI Insights
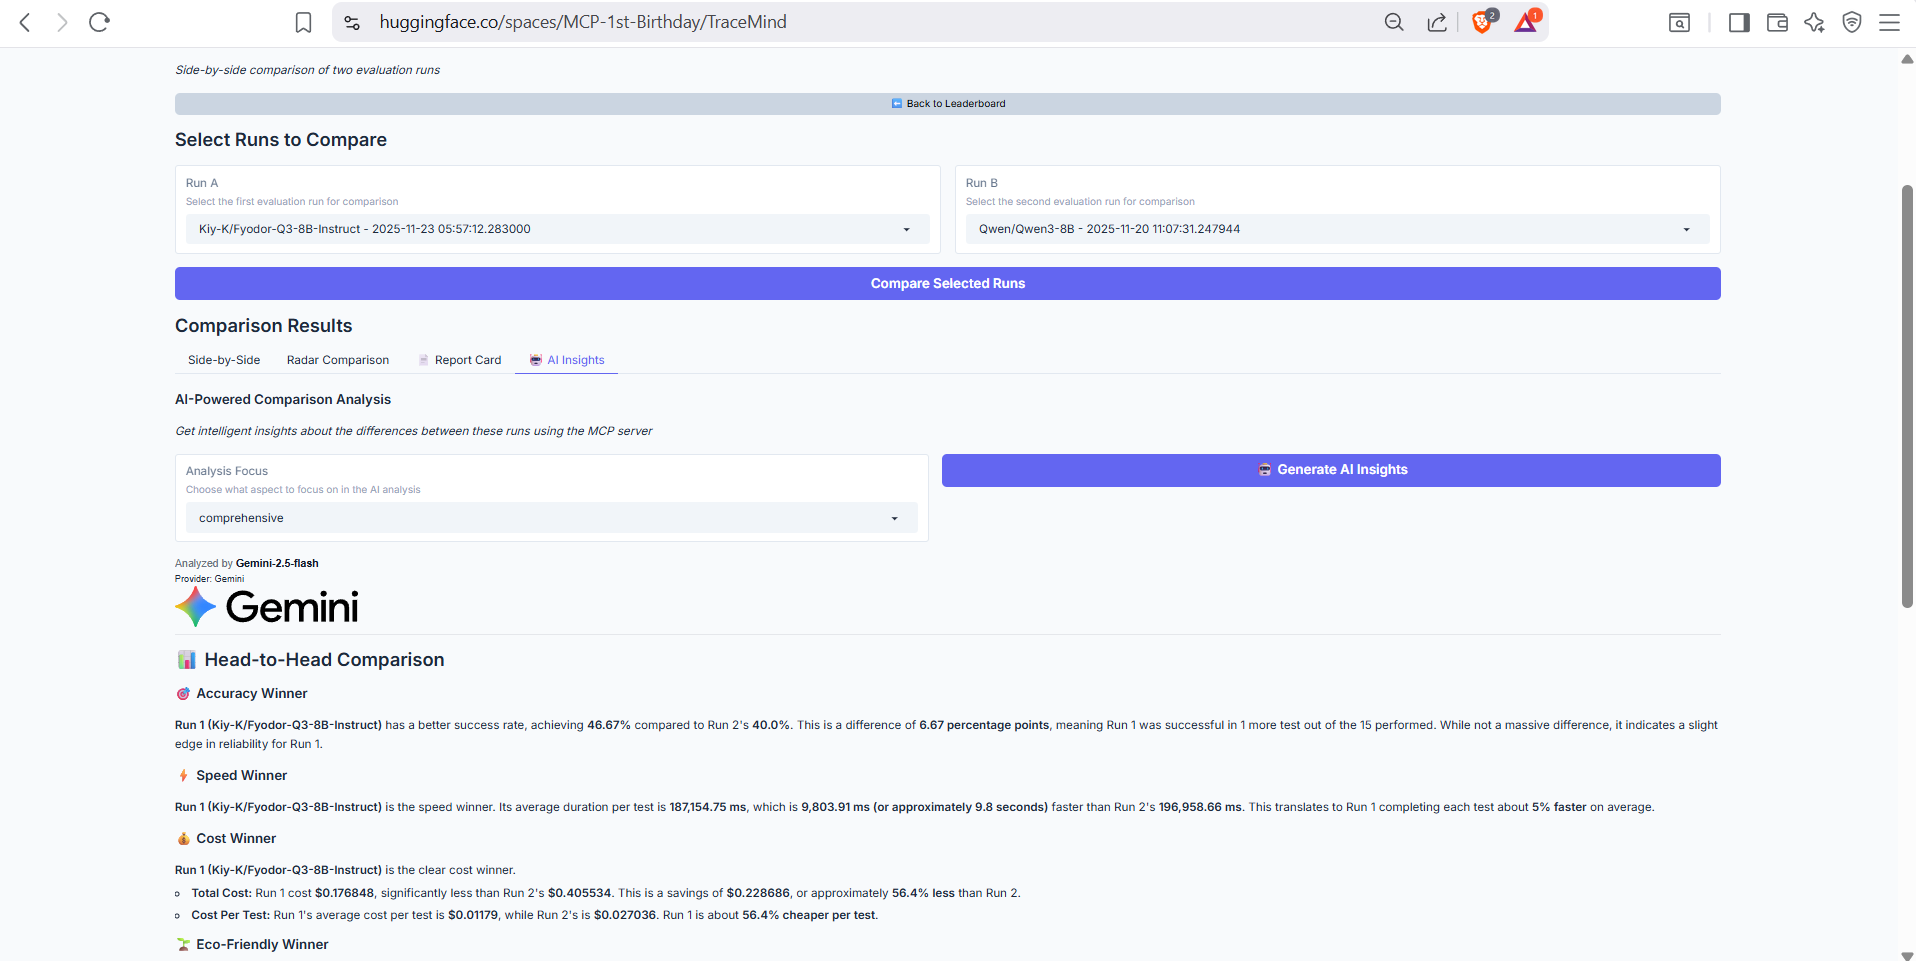
AI-powered comparison analysis using the TraceMind MCP Server's compare_runs tool. Provides intelligent narrative explaining the key differences, likely causes, and recommendations for choosing between models.
🧪 Screen 8: Synthetic Data Generator
Purpose: Generate custom test datasets with AI
Create custom evaluation datasets tailored to your specific use case using AI-powered generation.
Generator Interface
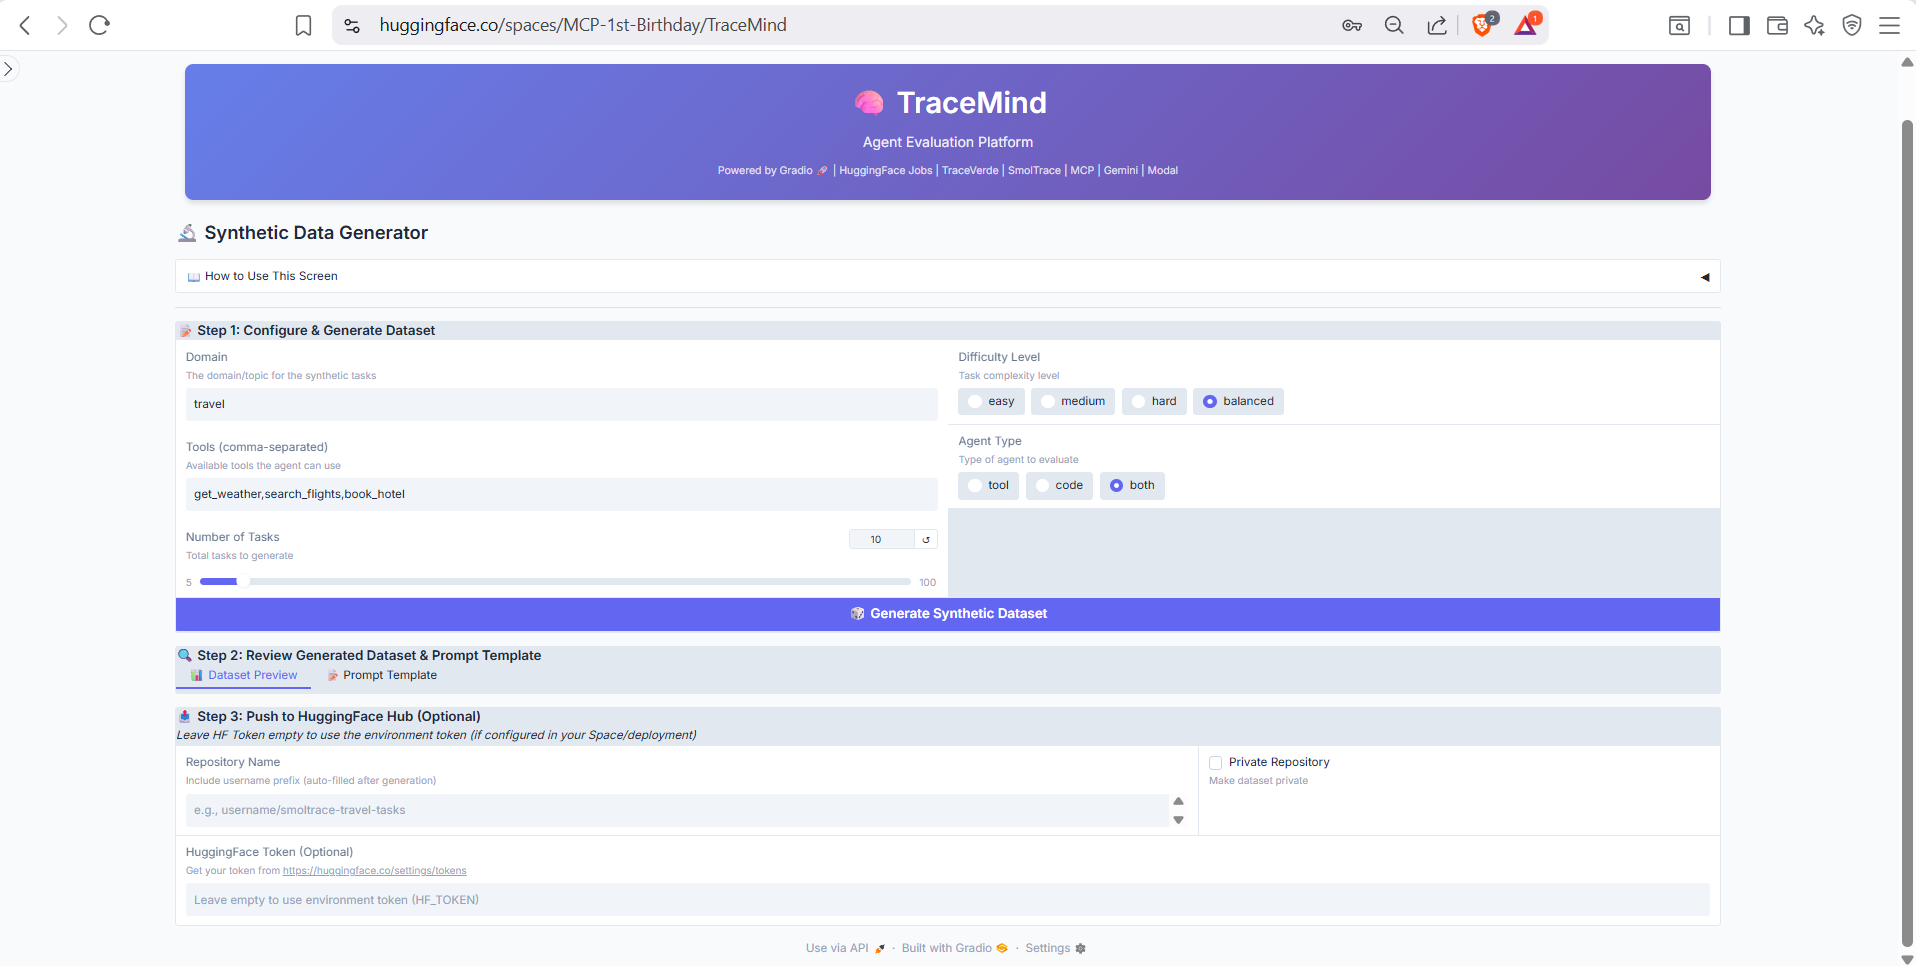
Configure synthetic data generation by specifying the domain, complexity level, number of test cases, and any specific requirements. Uses the TraceMind MCP Server's generate_test_cases tool to create diverse, realistic test scenarios. Preview generated cases before saving to your evaluation dataset.
⚙️ Screen 9: Settings
Purpose: Configure API keys and preferences
Manage your TraceMind configuration including API keys, default settings, and integration options.
Settings (Part 1)
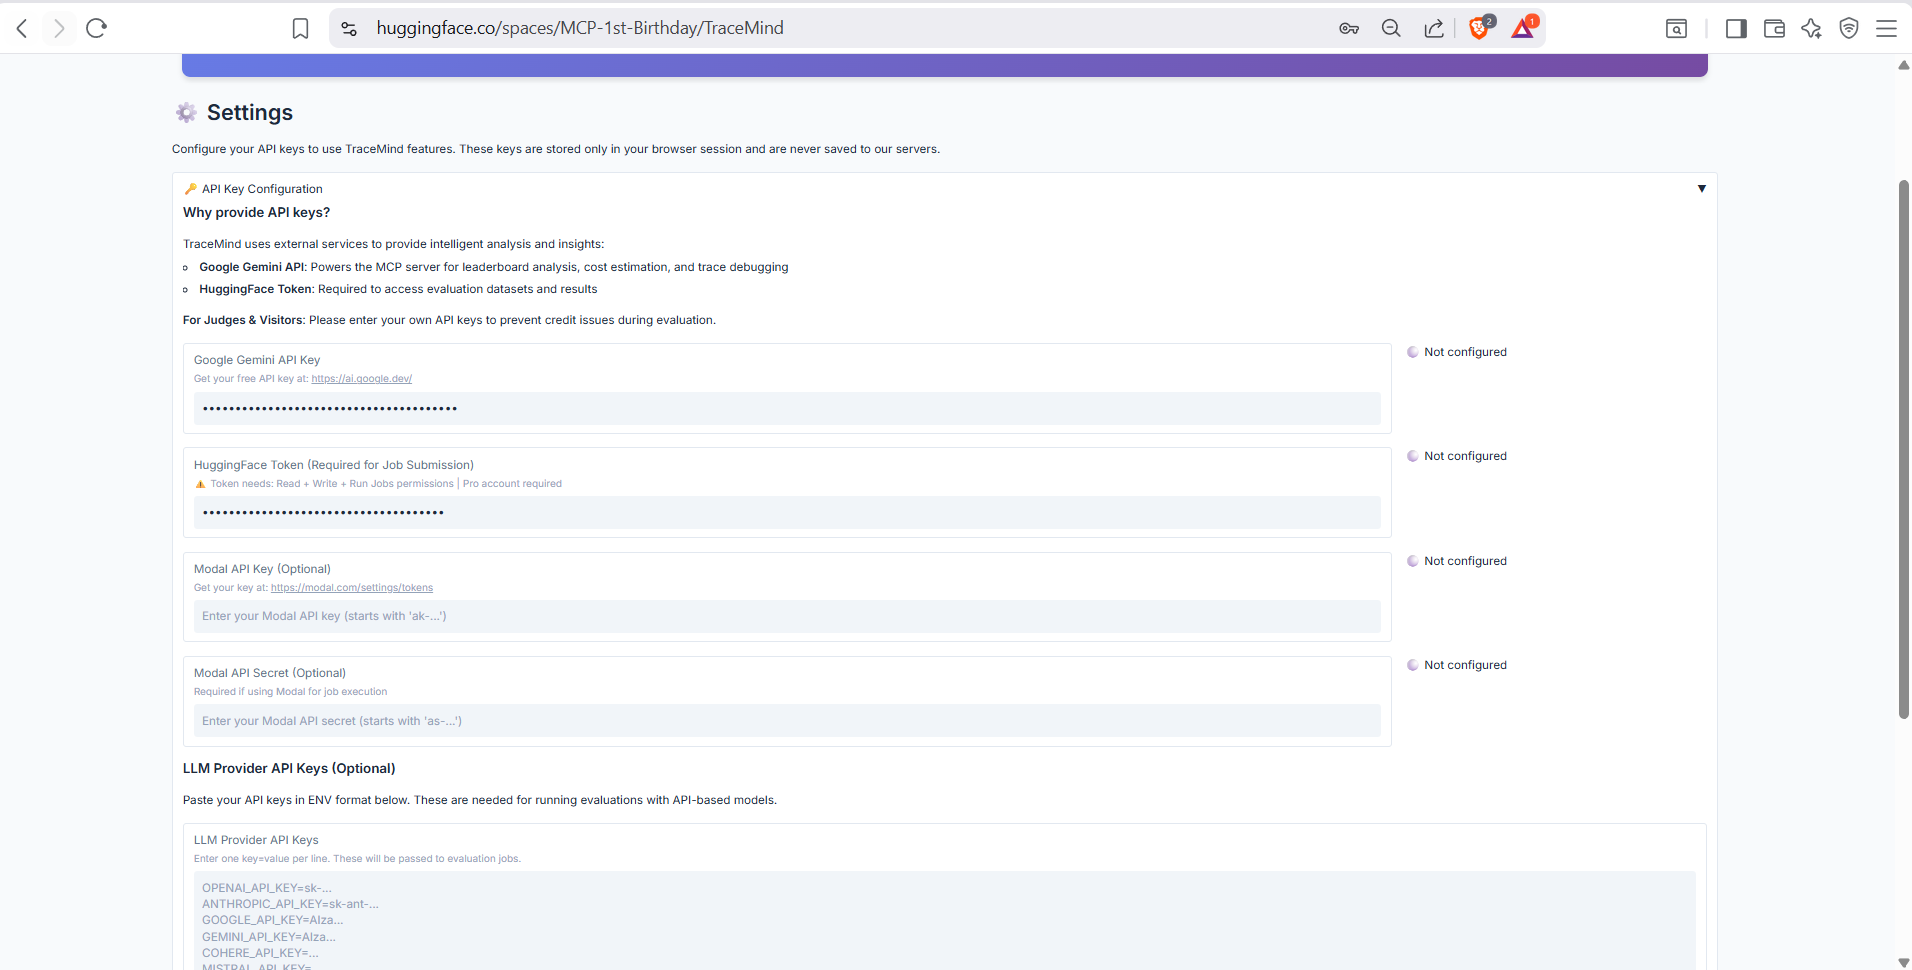
API key configuration for various providers: OpenAI, Anthropic, HuggingFace, Google Gemini. Keys are securely stored and masked after entry. Test connection buttons verify your keys are working.
Settings (Part 2)
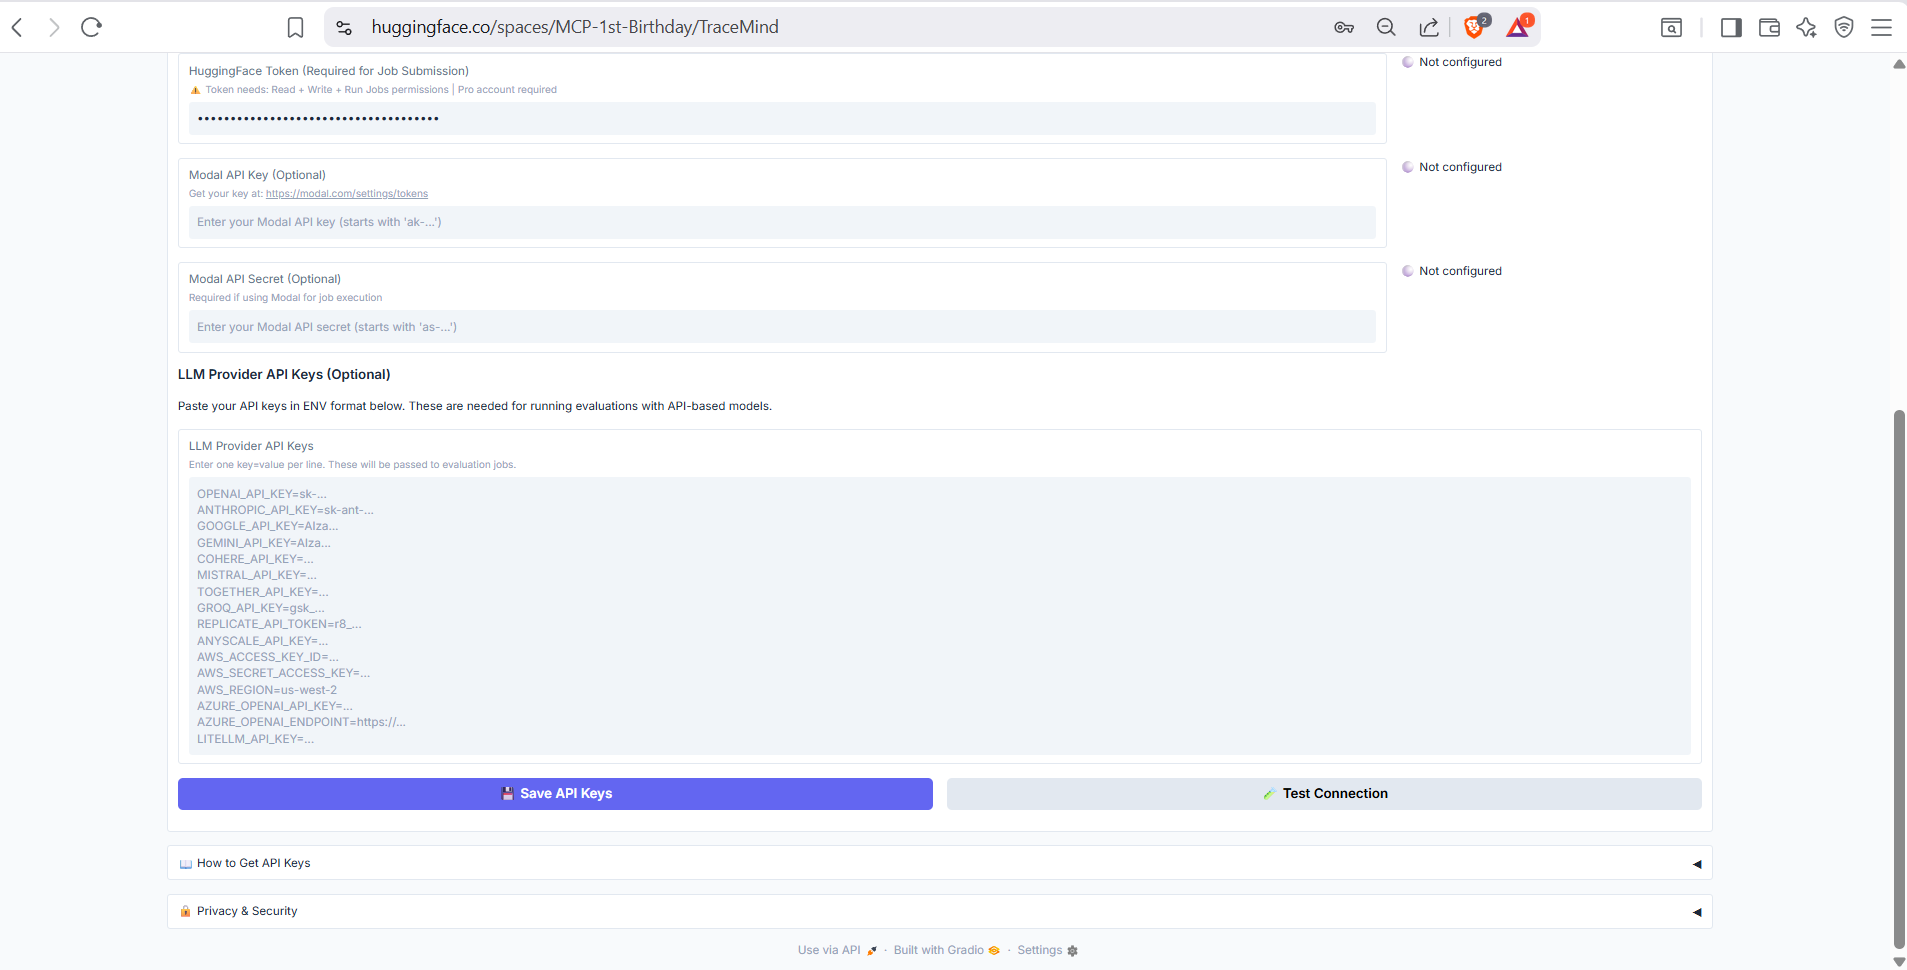
Additional settings including default model selection, MCP server connection settings, notification preferences, and data export options. Configure TraceMind to match your workflow preferences.
📚 Screen 10: Documentation
Purpose: In-app documentation and guides
Comprehensive documentation accessible directly within TraceMind, covering all features and integrations.
About Tab
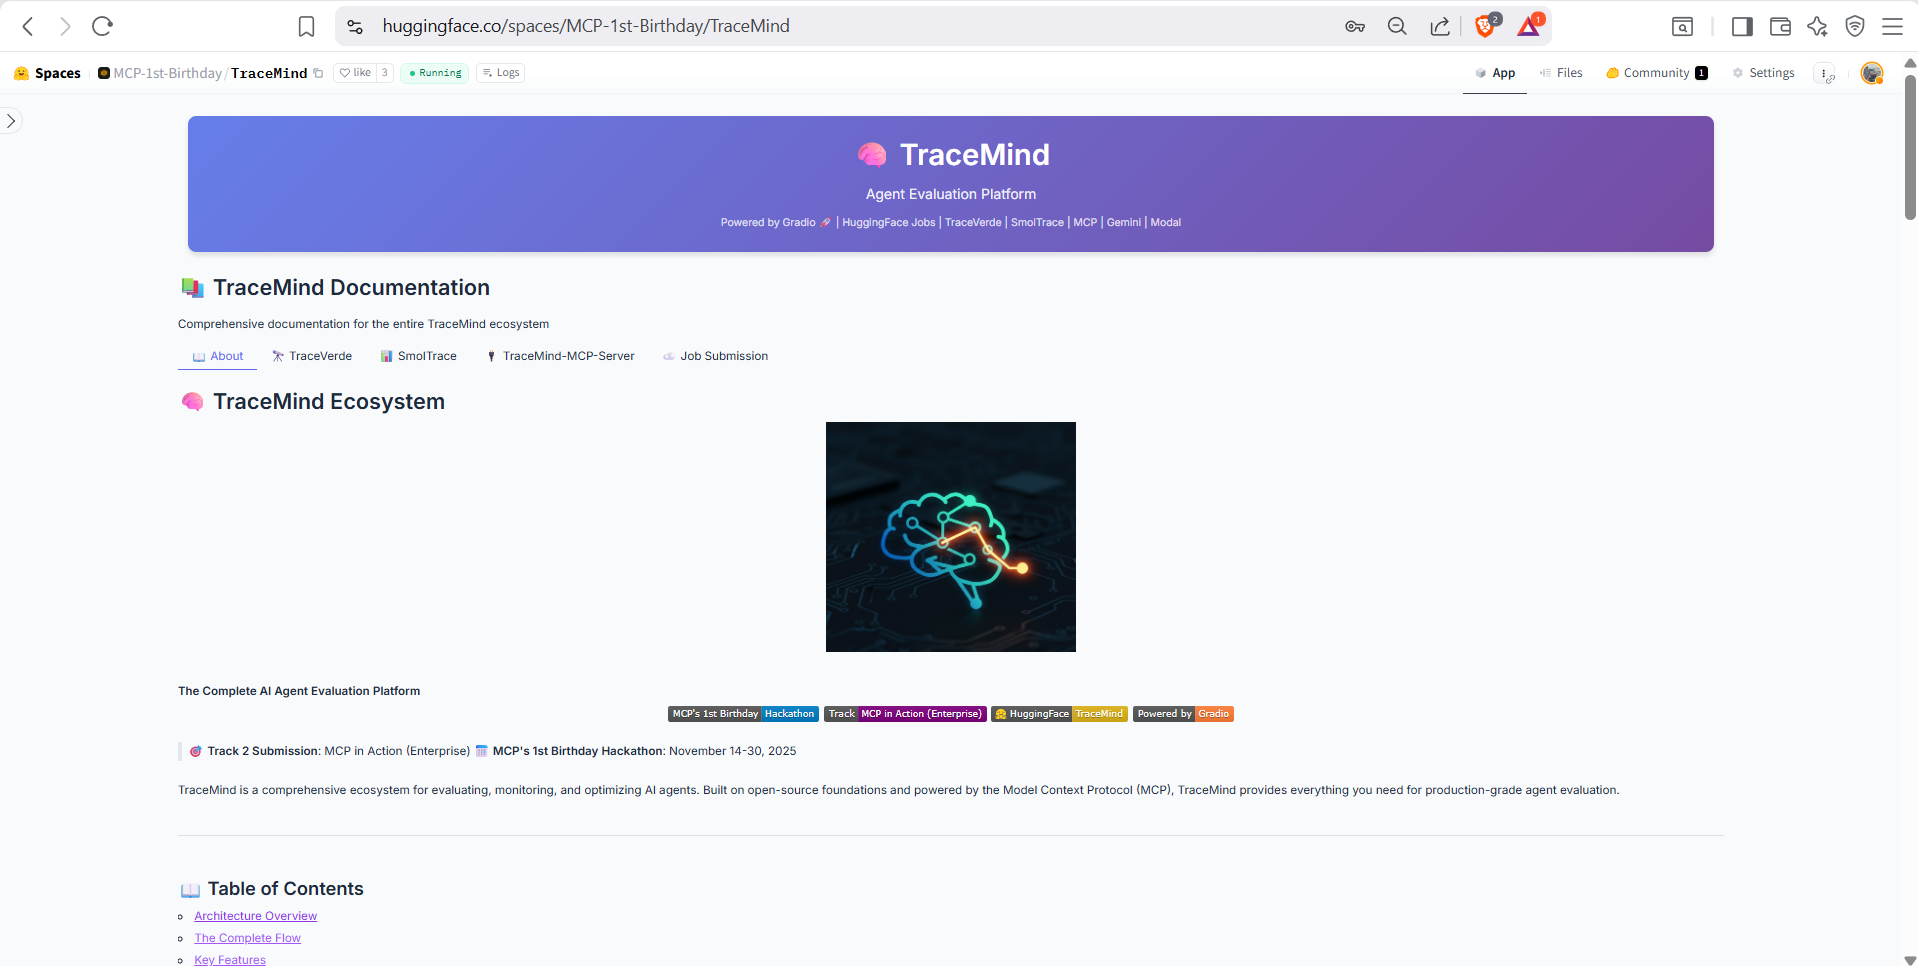
Overview of TraceMind-AI including its purpose, key features, and the ecosystem it's part of. Includes quick links to demo videos, GitHub repositories, and community resources.
TraceVerde Tab
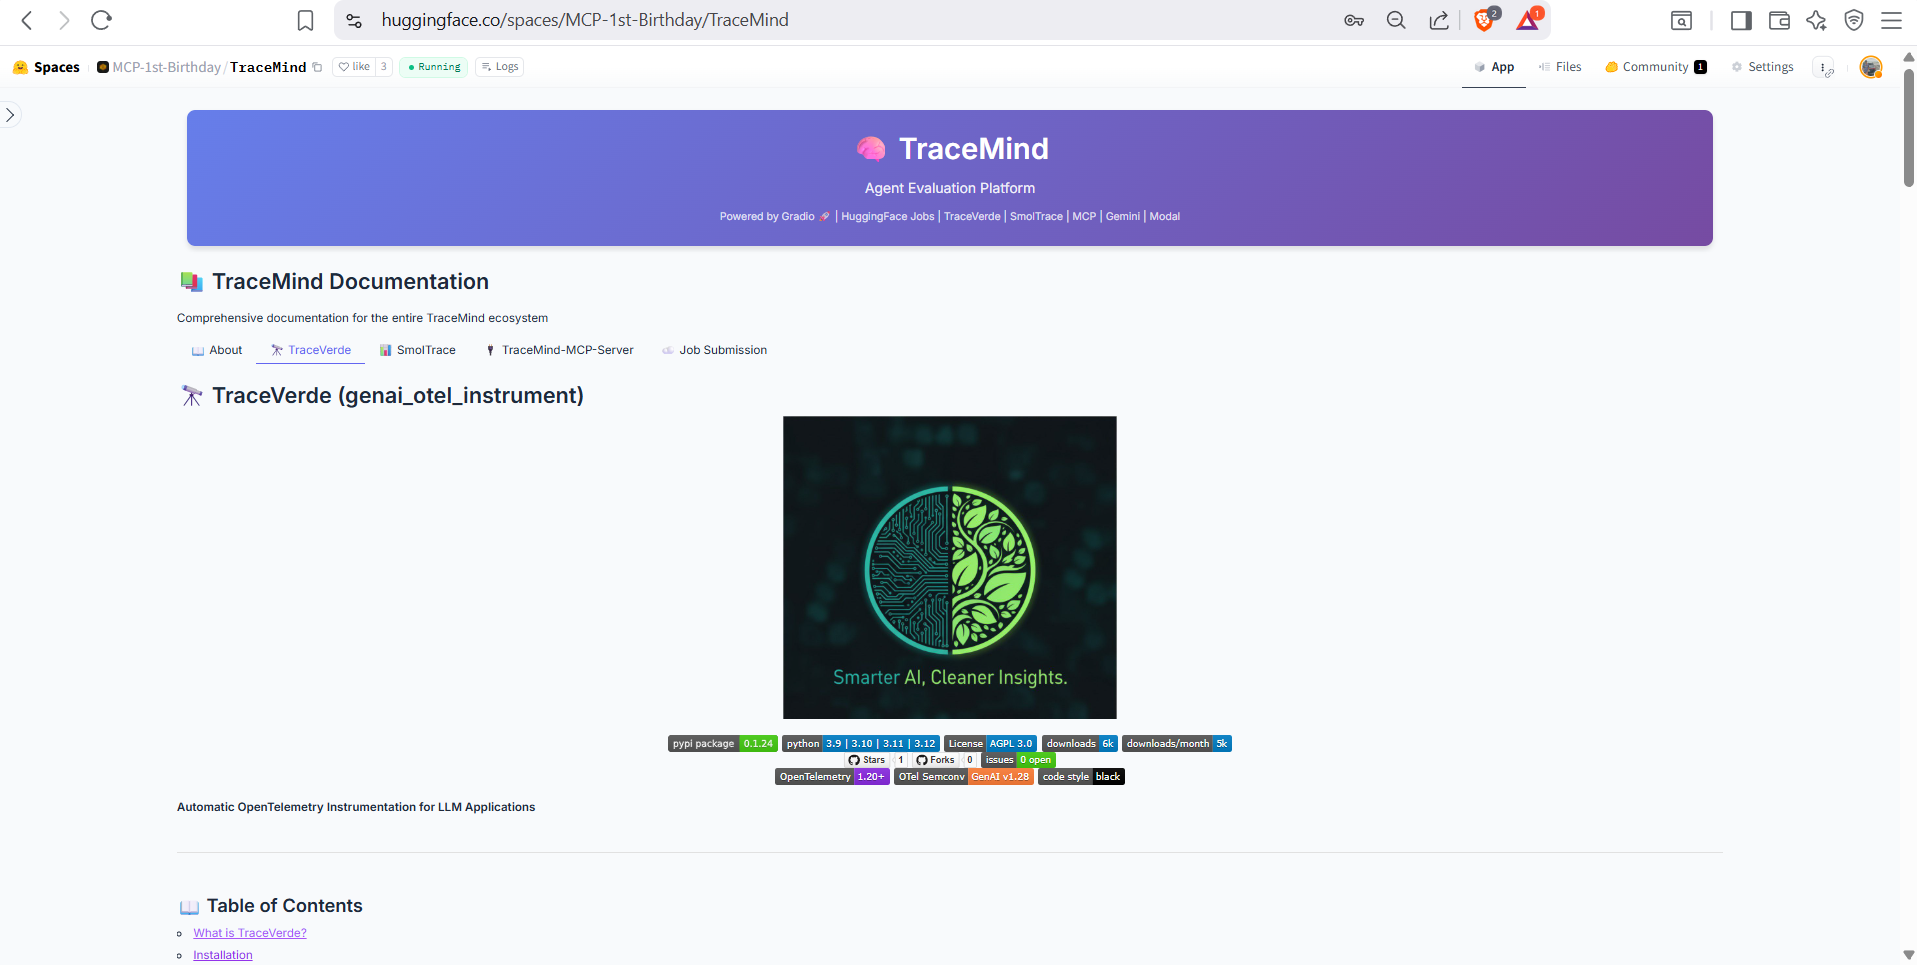
Documentation for TraceVerde (genai_otel_instrument), the OpenTelemetry instrumentation library that powers TraceMind's tracing capabilities. Shows installation, usage examples, and supported frameworks.
SMOLTRACE Tab
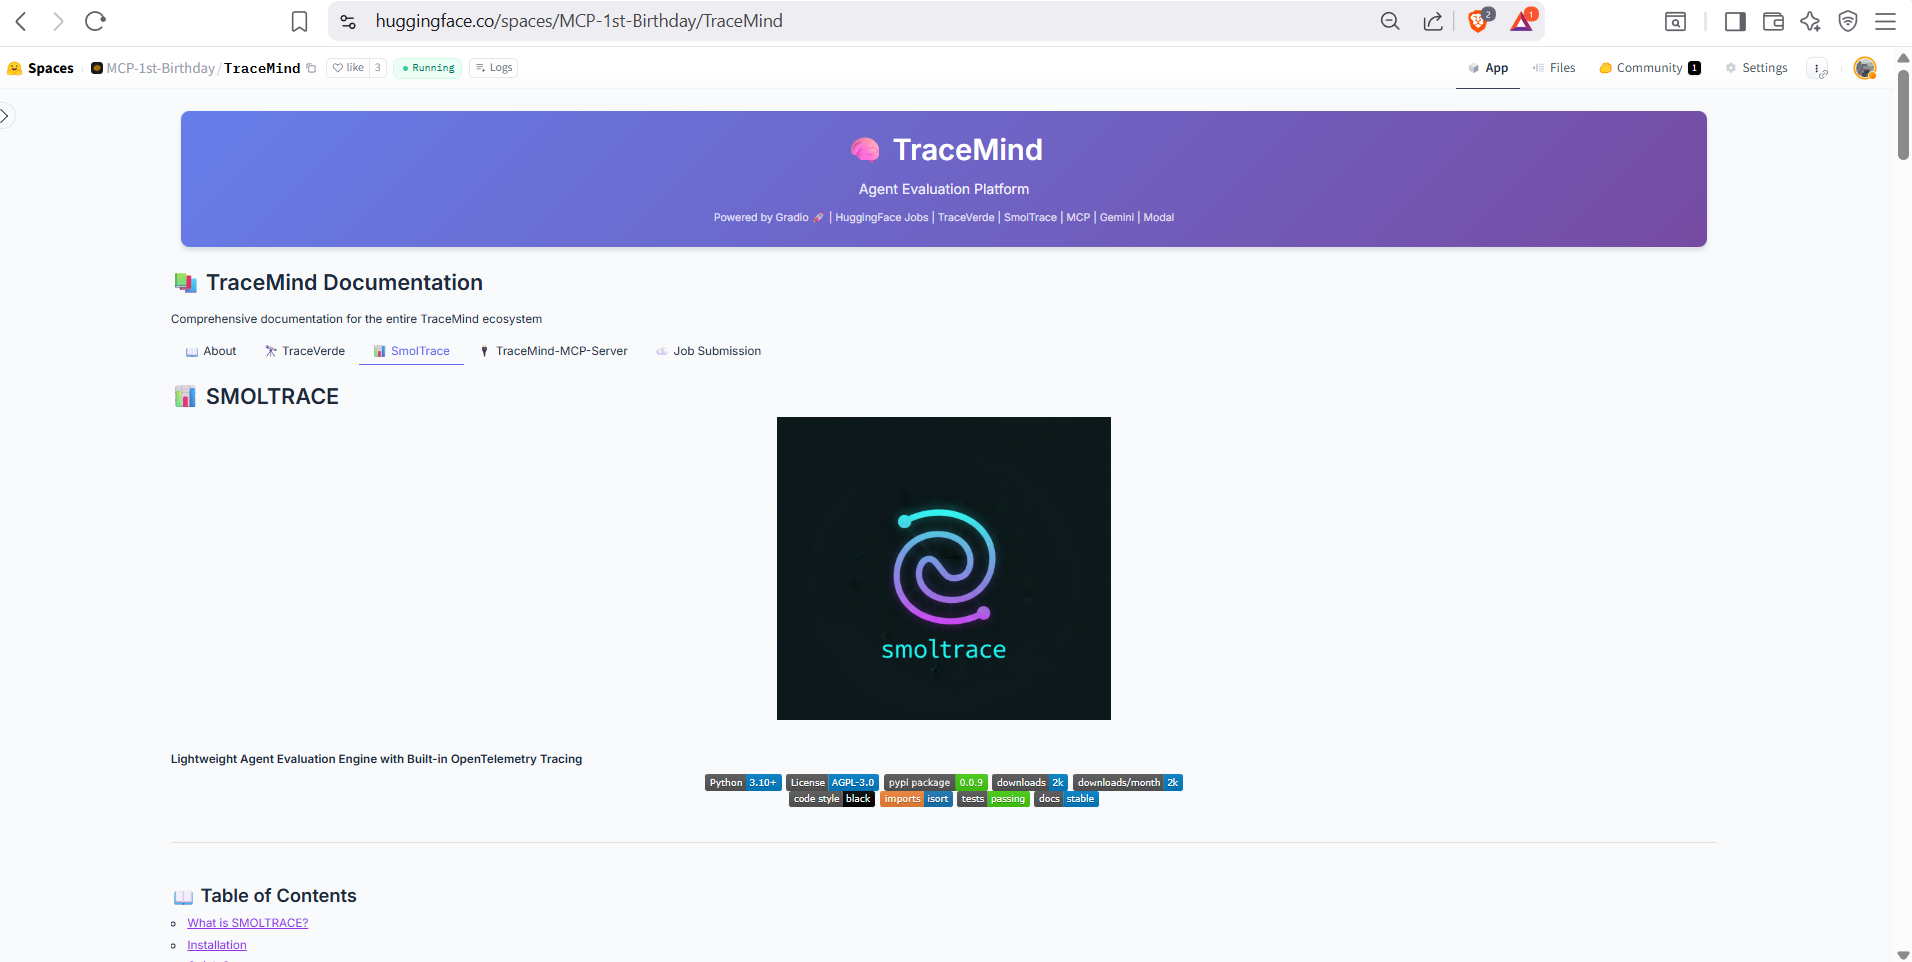
Documentation for SMOLTRACE, the evaluation engine backend. Covers configuration options, benchmark datasets, and integration with HuggingFace datasets for storing evaluation results.
TraceMind MCP Server Tab
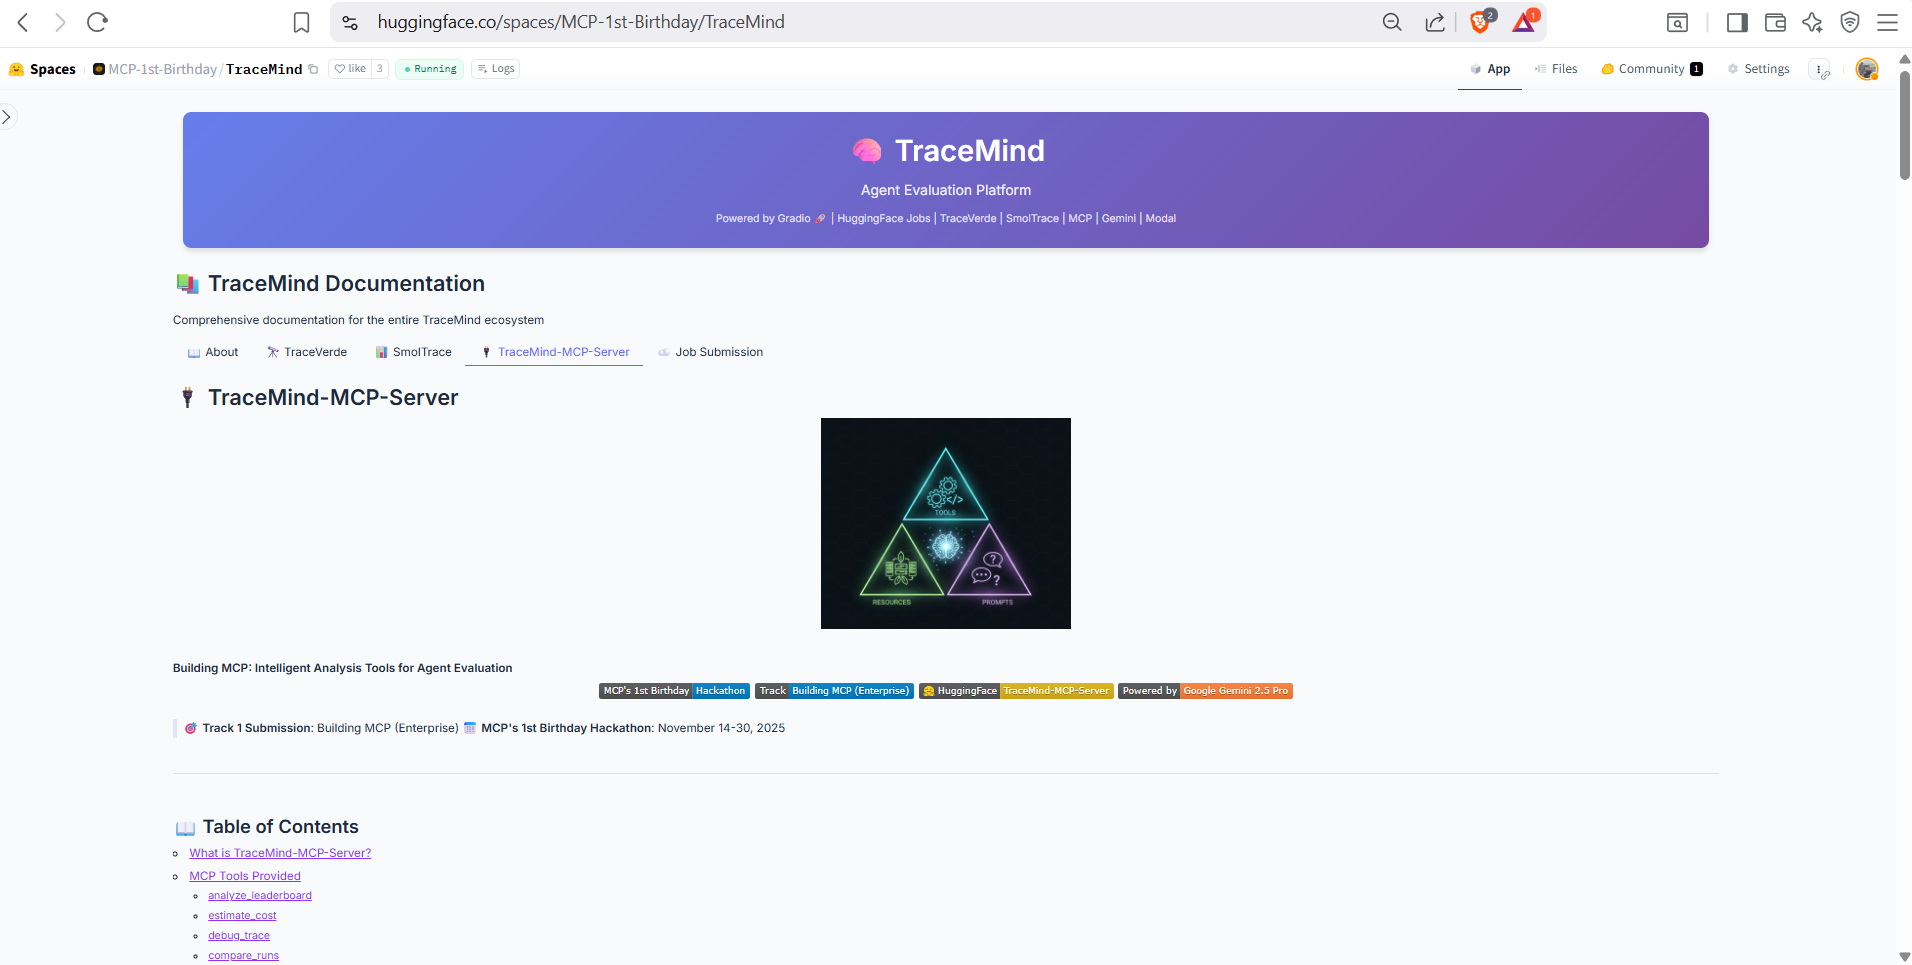
Complete documentation for the TraceMind MCP Server including all 11 tools, 3 resources, and 3 prompts. Shows how to connect the MCP server to Claude Desktop, Cursor, or other MCP clients.
Job Submission Tab
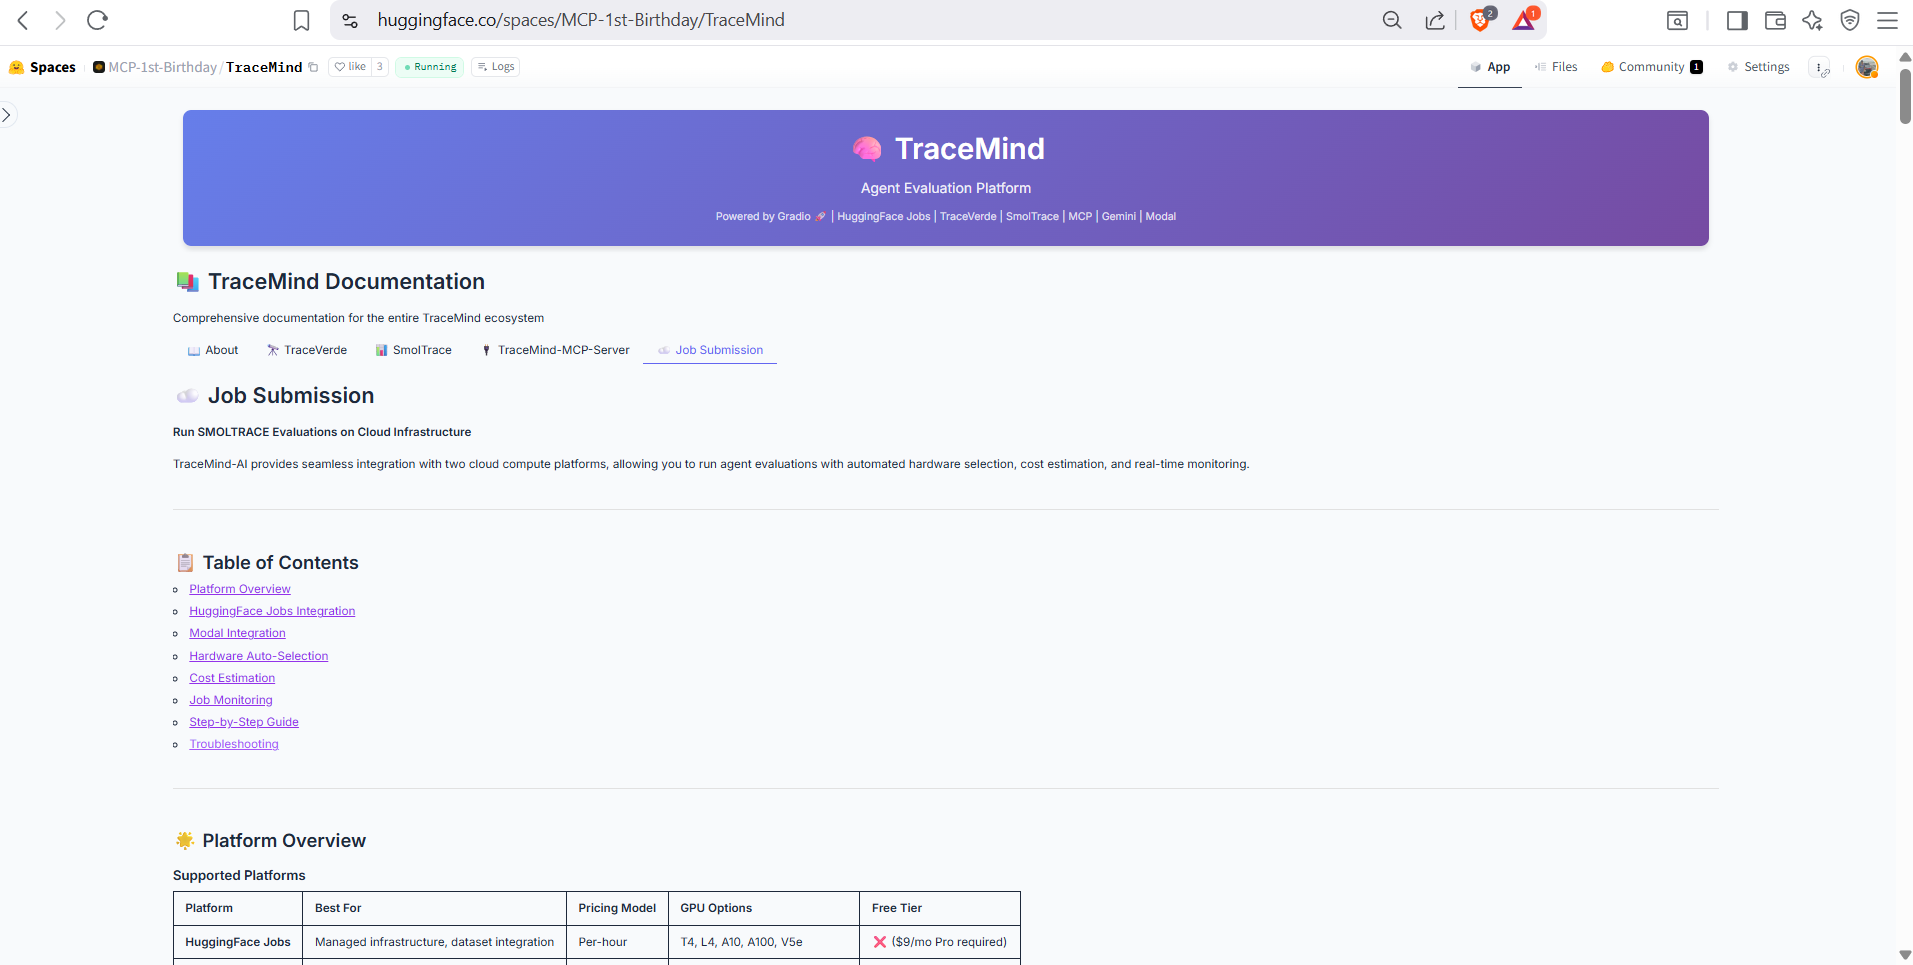
Guide to submitting evaluation jobs via HuggingFace Jobs or Modal. Covers hardware options (CPU, A10, H200), cost considerations, and best practices for running large-scale evaluations.
📊 Dashboard
Dashboard Overview
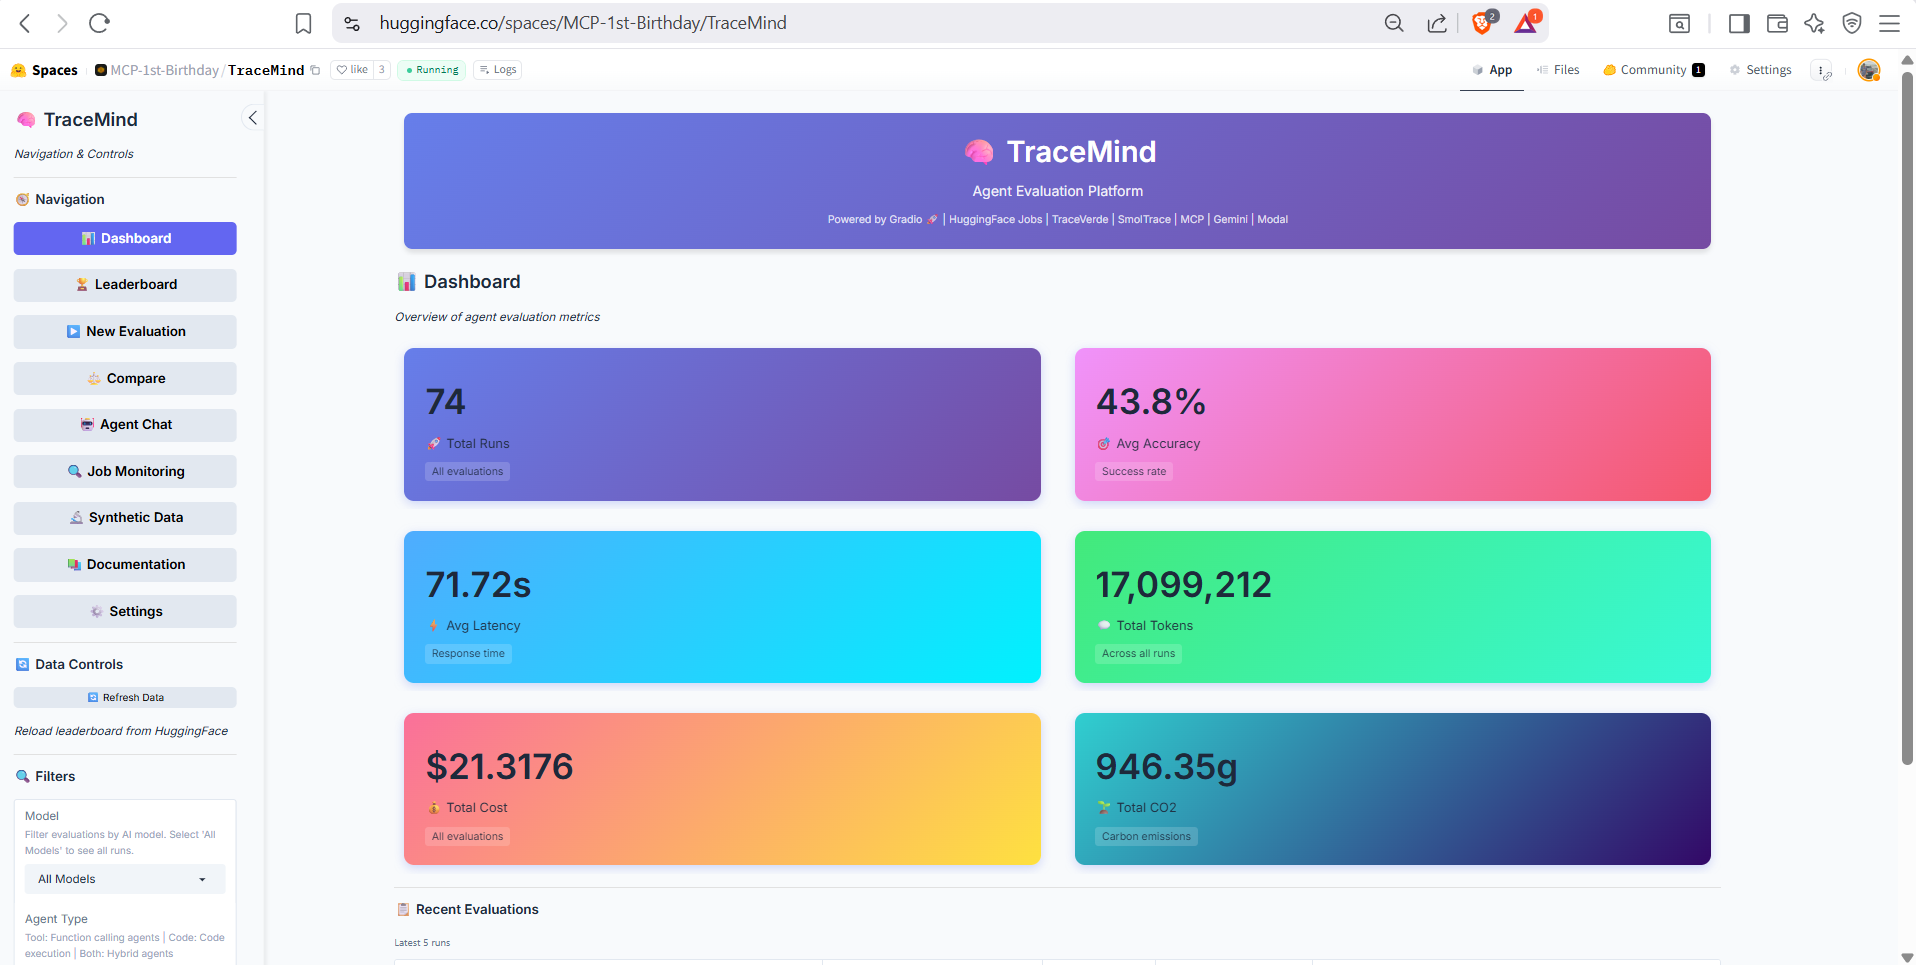
The main dashboard provides a unified view of your TraceMind activity: recent evaluations, quick stats, trending models, and shortcut buttons to common actions. This is your starting point for navigating the full TraceMind-AI experience.
📦 Screenshot Summary
| Screen | Screenshots | Key Features |
|---|---|---|
| Leaderboard | 7 | Sortable table, summary cards, AI insights, analytics charts, trends |
| Agent Chat | 3 | Natural language queries, MCP tool execution, multi-turn conversations |
| New Evaluation | 4 | Model selection, hardware config, cost estimation, job submission |
| Job Monitoring | 2 | Job status tracking, real-time logs, progress monitoring |
| Run Details | 5 | Overview metrics, test cases, performance charts, AI analysis, GPU metrics |
| Trace Visualization | 5 | Waterfall timeline, span details, thought graph, raw OTEL data |
| Compare Runs | 4 | Side-by-side metrics, report card, radar chart, AI comparison |
| Synthetic Data | 1 | AI-powered test case generation, domain configuration |
| Settings | 2 | API key management, default preferences, MCP connection |
| Documentation | 5 | About, TraceVerde, SMOLTRACE, MCP Server, Job Submission guides |
| Dashboard | 1 | Activity overview, quick stats, navigation shortcuts |
| Total | 39 | Complete UI coverage with explanatory descriptions |
🔗 Related Documentation
- README.md - Quick start guide
- USER_GUIDE.md - Complete walkthrough
- MCP_INTEGRATION.md - Technical MCP details
- ARCHITECTURE.md - System architecture
Status: ✅ Screenshots Complete - 39 annotated images organized and deployed
Last Updated: November 2025