Documentation
Installation
Instructions for installing PARROT on your system... Warning: The Orthanc server will run on port 8042 of your local computer and the nginx server on port 2000.
The installation package includes all servers. However, the Orthanc server is a manual installation. The installation instructions can be found below.
Study Management
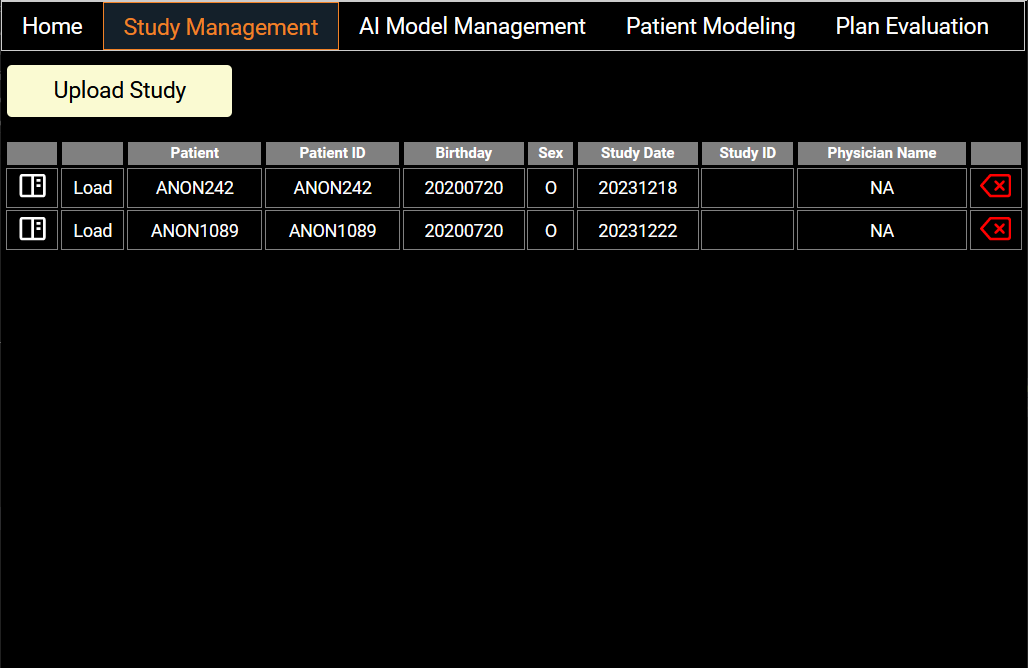
Users can import patient data from this screen to a local Orthanc daemon—a lightweight, standalone DICOM server, which ensures the confidentiality of patient files. A list of patient data present in the Orthanc server is displayed with summarized information. Users can load the data into the app by clicking on the Load button. The left icon displays more complete information from DICOM tags and users can delete a patient study from the server with the red arrow on the right.
AI Models Management
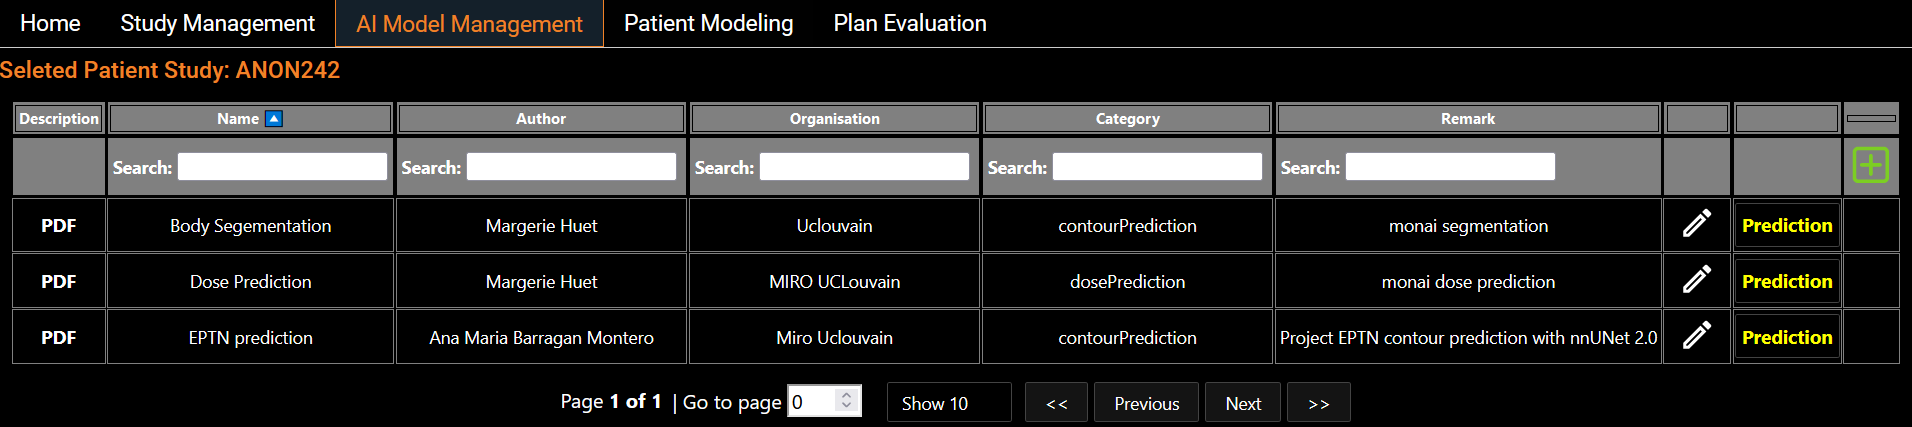
Eight segmentation models and six dose prediction models are made available and listed on the screen (Figure 2). These models are trained from state-of-the-art architectures such as nnUNet, SwinUNETR and HDUNet (Table 1). On the left hand side of each line, a standardized description of the model is available. The PDF description file contains details about the architecture with a link of the original research article, details on the training process including dataset, and performance on our test set (Figure 3). Users also have the flexibility to run their own models using a Python scripting editor and display the output in the viewer (Figure 4). We distinguish two categories of models: the segmentation models and the dose prediction models. A key difference between the two categories is that segmentation models require only the anatomy of the patient (CT scan or MRI image) whereas dose prediction models also require binary masks of tumor volumes (TV) and organs at risk (OARs). For that latter, we implemented a dialog that allows users to map structures present in the current patient data and the input required for the AI dose prediction model (Figure 5).
Patient Modeling
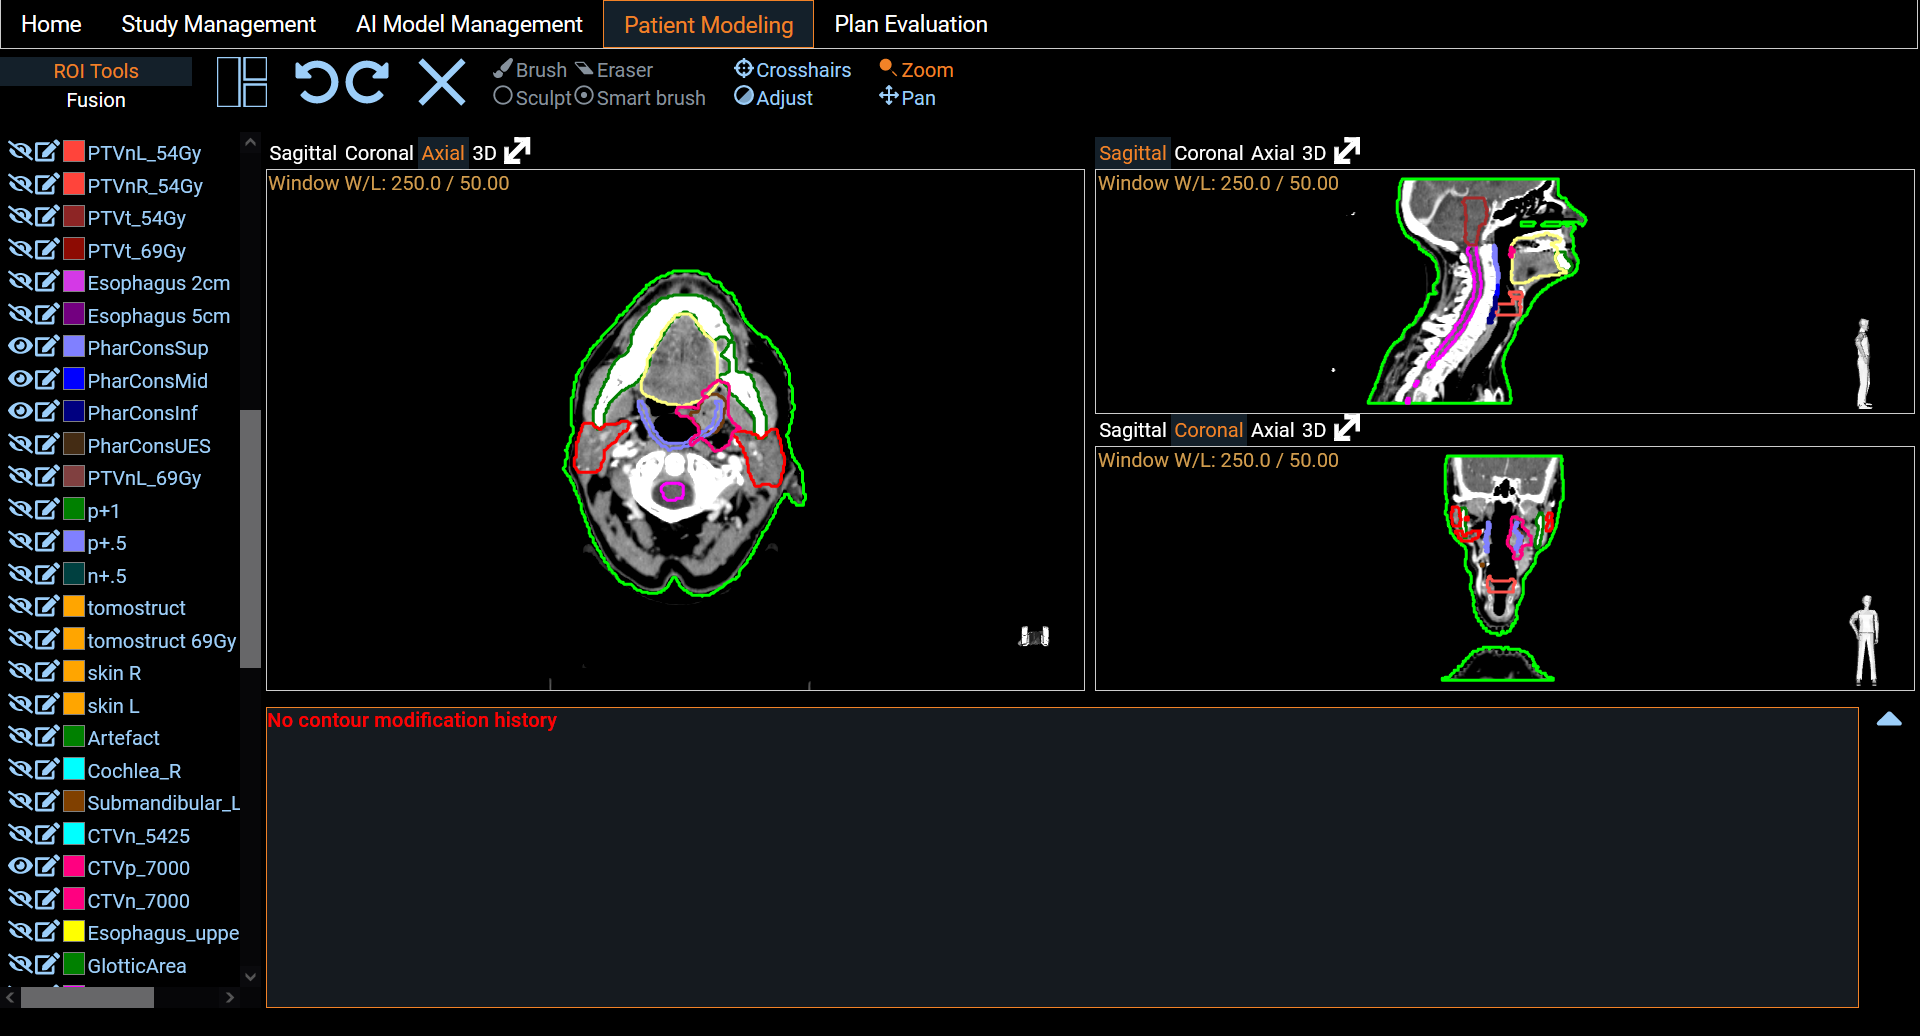
Eight segmentation models and six dose prediction models are made available and listed on the screen (Figure 3). These models are trained from state-of-the-art architectures such as nnUNet [2], SwinUNETR [3] and HDUNet [4] (Table 1). On the left hand side of each line, a standardized description of the model is available. The PDF description file contains details about the architecture with a link of the original research article, details on the training process including dataset, and performance on our test set (Figure 4). To run a model prediction, the user simply clicks on the yellow Prediction button on the right hand side of the model line. This will open a Python scripting editor to run the code (Figure 5). Two choices are available to the user: either run the code locally or in one of the Python environments provided. The latter option provides a Python version with a set of libraries. Users can select a Python environment with the drop-down menu in the upper right corner and by hovering on it, a description of the libraries they contain is displayed. Once the prediction is done, users can upload the result to the study to visualize the output in the Patient Modeling screen (Figure 7). Users also have the flexibility to run their own models by loading their own code in the Python scripting editor. On our website, we provide a description and examples using the API to retrieve the patient information loaded on PARROT and upload the result. We distinguish two categories of models: the segmentation models and the dose prediction models. A key difference between the two categories is that segmentation models require only the anatomy of the patient (CT scan or MRI image) whereas dose prediction models also require binary masks of tumor volumes (TV) and organs at risk (OARs). For that latter, we implemented a dialog that allows users to map structures present in the current patient data and the input required for the AI dose prediction model (Figure 6).
Plan Evaluation
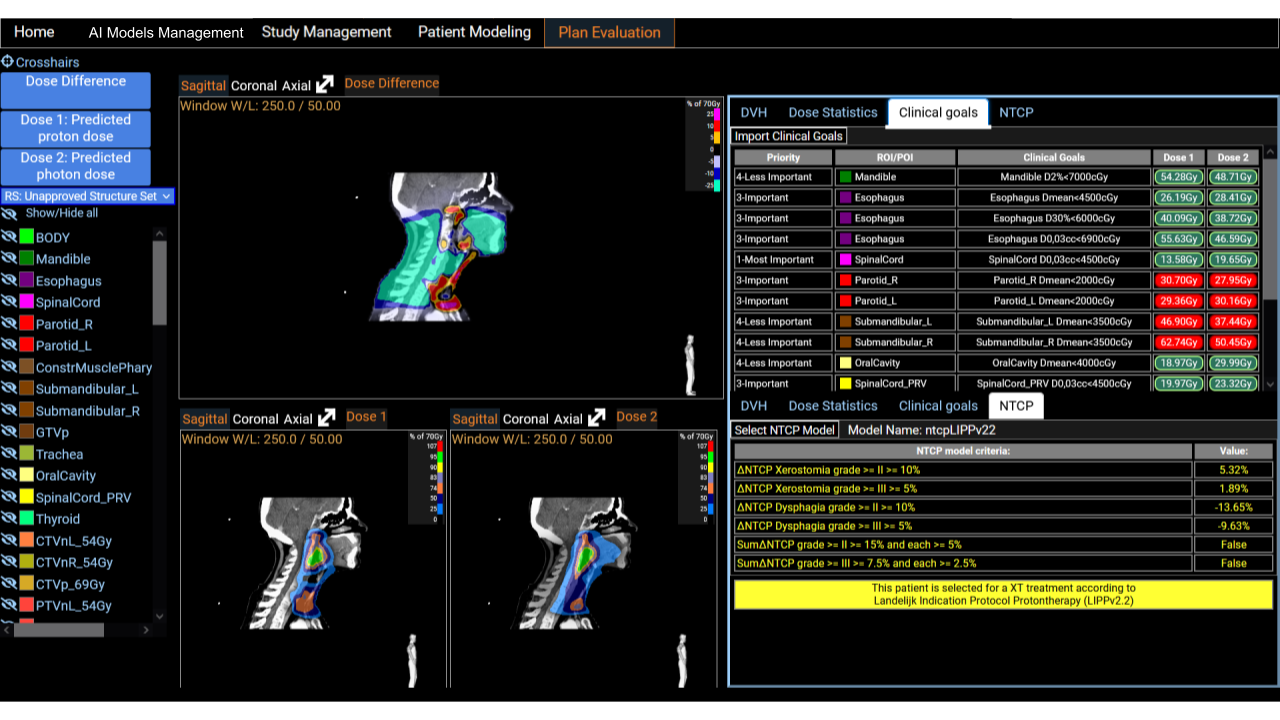
A comprehensive display of two dose distributions comparison is presented on the last screen. The two dose distributions can originate from the importation step or result from the inference of ai models. We provide a set of tools for comparison, such as DVH curves, dose statistics, and the fulfillment of clinical goals. Clinical goals can be uploaded following an Excel template so that it fits any clinical requirements of the users institutions. The platform incorporates treatment indications based on NTCP protocols. It has been shown in multiple studies that predicted dose distributions yield meaningful output when used with NTCP models for treatment selection decision support [5] [6]. This is a useful decision support tool for the clinical community.